POPULATION AP HUMAN GEOGRAPHY UNIT 2 DEMOGRAPHY Demography


 • Measure used by geographers to better understand")
 • Lower rates of… •")


 • Unchecked population would exceed food supply")

 • Pandemic is a")
 • Characterized by… •")
- Slides: 31
POPULATION AP HUMAN GEOGRAPHY UNIT 2
DEMOGRAPHY • Demography is the study of population. • How people are distributed based on age, gender, occupation, fertility, health, socio-economic factors, etc. • Why is understanding demographic trends important? • More people are alive now – 7 billion – than historically before. • Population increased in the 2 nd half of the 20 th century at faster rate than before • Almost all population growth is in LDCs • Overpopulation is not a global threat – it is a phenomenon in some regions, but not others.
POPULATION CARTOGRAM
POPULATION CONCENTRATION • Humans are not uniformly distributed across the globe (as illustrated by the cartogram). • We look at population based on concentration and density. • 2/3 of the world’s population is concentrated in 4 regions • East Asia, Southeast Asia, South Asia, Europe • Some similarities: • • Ample water (near oceans or major rivers) Low lying areas Good farmable soil Temperate climate
SPARSELY POPULATED AREAS • Humans avoid clustering in certain physical environments. • • Dry Lands Wet Lands Cold Lands High Lands • Of course there are exceptions to the rule (i. e. Bedouin of the Arabian desert, Quecha peoples of the Andes, Inuit, etc. ) • Places of permanent human settlement are termed the ecumene. • Places considered too harsh for occupancy have diminished over time. • Remember possibilism – we can ADAPT, and have
POPULATION DENSITY • Density can be computed in up to three ways for a place: • Arithmetic Density • Total number of objects in an area • Computation: Divide the population by the land area • Physiological Density • Number of people supported by a unit area of arable (farmable) land • Computation: Divide the population by the arable land area • Agricultural Density • Ratio of the number of farmers to amount of arable land • Computation: Divide the population of farmers by the arable land area
ARITHMETIC
PHYSIOLOGICAL
AGRICULTURAL
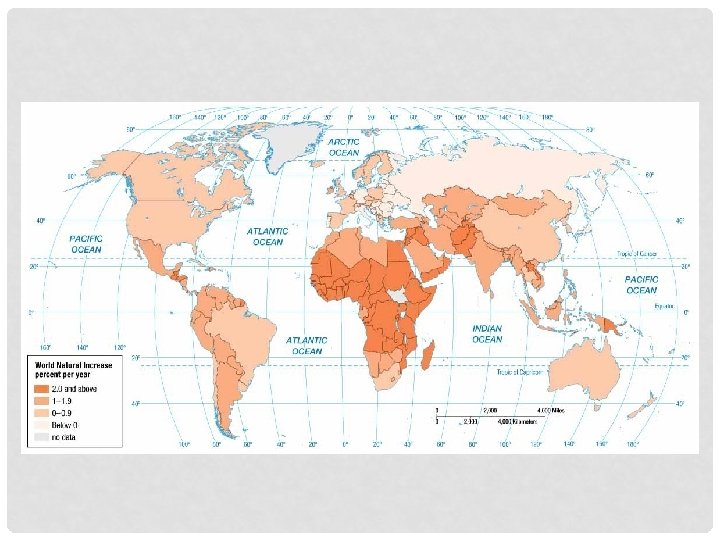
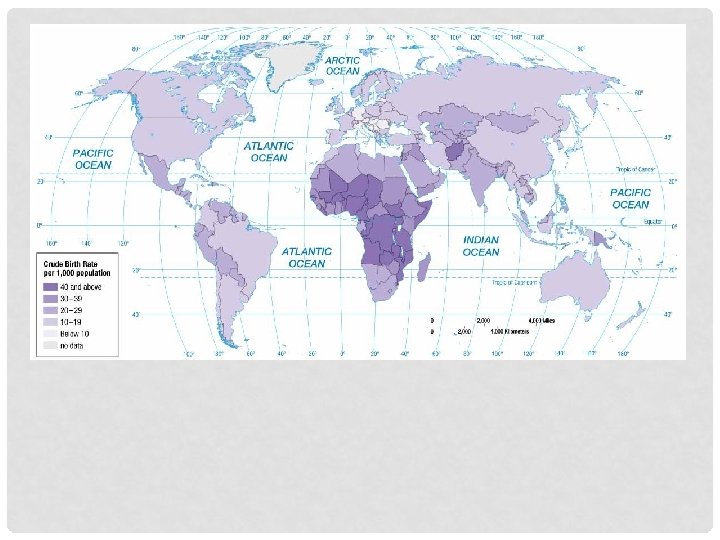
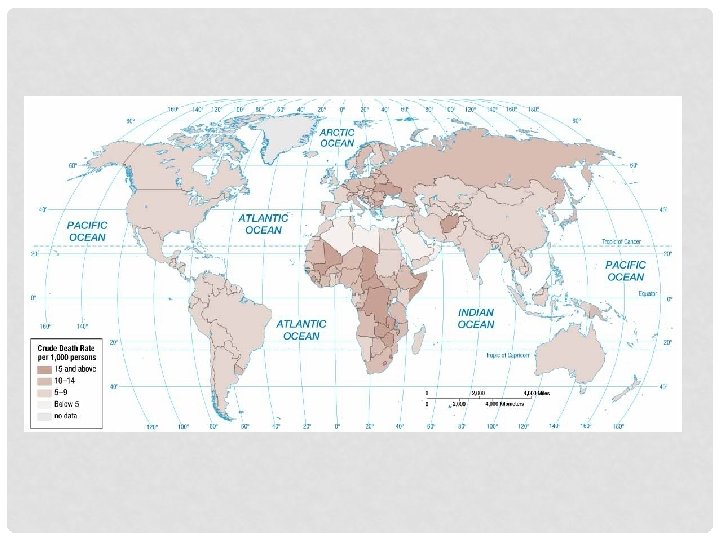
NATURAL INCREASE • Crude Birth Rate – number of live birth rates in a year per 1000 people. • Crude Death Rate – number of deaths in a year per 1000 people. • Natural Increase Rate - % by which population grows in a year • Find it by subtracting CDR from CBR after converting both to percentages. • Doubling time - projected amount of time that it will take for population to double • • Resource management Urban planning Economic planning More than 95 percent of the natural increase is clustered in developing countries.
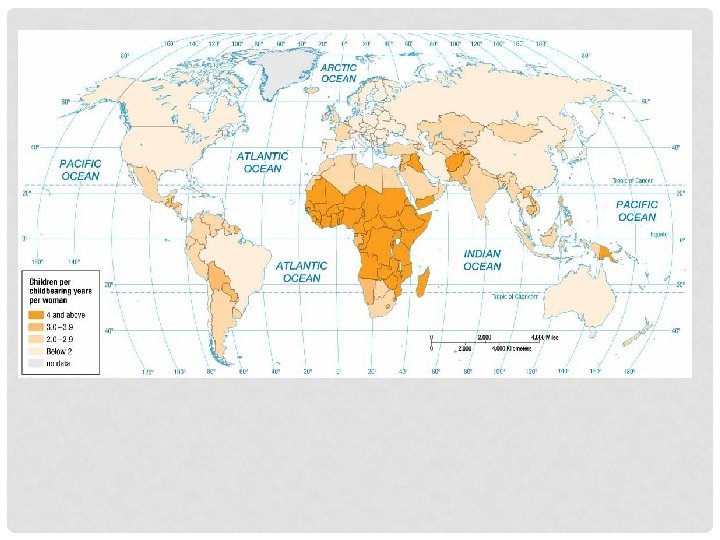
FERTILITY • Number of children born to a population’s women – • Difference between crude fertility rate and total fertility rate (fecundity) – CFR is actual, TFR is potential • Most women do not have 20 children • Social norms, birth control, biological constraints • Social, political, economic and environmental factors affect fertility. • LDC tend to higher TFRs; i. e. , Sub-saharan Africa is greater than 6. 0, less than 1. 9 in Europe.
MORTALITY • Infant Mortality Rate (IMR) • Measure used by geographers to better understand death rates in a society • Defined as the annual number of deaths of infants under one year of age, compared with total live births • Usually expressed per 1, 000 births rather than a percentage • IMR is 5 in developed countries and 80 in sub. Saharan Africa.
WHY IS GLOBAL POPULATION INCREASING? • Developed Countries (MDC) • Lower rates of… • Natural increase • Crude birth • Total fertility • Infant mortality • Developing Countries (LDC) • Higher rates of… • Natural increase • Crude birth • Total fertility • Infant mortality
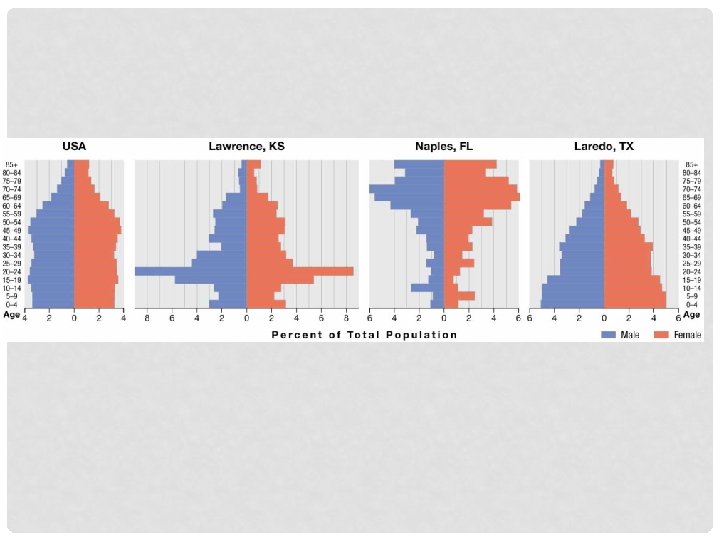
POPULATION PYRAMIDS • A special bar graph known as a population pyramid can visually display a country’s distinctive population structure. • X-axis • Percent male displayed to the left of zero • Percent female displayed to the right of zero • Y-axis • Age cohorts typically grouped in 5 -year intervals • Youngest displayed at bottom and oldest at top
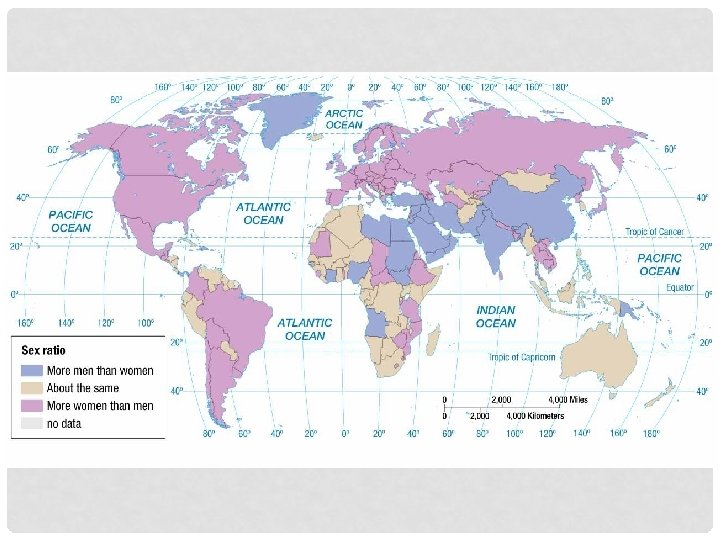
DEPENDENCY RATIO AND SEX RATIO • Dependency Ratio • Defined as the number of people who are too young or too old to work, compared to the number of people in their productive years. • People aged 0 to 14 and over 65 years old are considered dependents. • Larger dependency ratios imply greater financial burden on the working class. • 85 percent in sub-Saharan Africa, while 47 percent in Europe. • Sex Ratio • Defined as the number of males per 100 females in the population • Developed countries have more females than males, because they tend to live 7 years longer.
THE DEMOGRAPHIC TRANSITION • A model consisting of four stages that helps to explain the rising and falling of natural increase over time in a country. • Historically, no country has ever reverted back to a previous stage. • Thus, the model can be thought to have a beginning, middle, and an end.
THE DEMOGRAPHIC TRANSITION? • Stage 1: Low Growth • Marked by very high birth and death rates. • No long-term natural increase • No country presently is in Stage 1 • Stage 2: High Growth • Marked by rapidly declining death rates and very high birth rates • High natural increase • Europe and North America entered stage 2, as a result of the industrial revolution (~1750). • Africa, Asia, and Latin America entered stage 2 around 1950, as a result of medical revolution-improved medical care.
THE DEMOGRAPHIC TRANSITION? • Stage 3: Moderate Growth • Marked by rapid decline in birth rates and steady decline in death rates • Natural increase is moderate. • Gap between CBR and CDR is narrower in stage 3 countries than stage 2 countries. • Population grows, because CBR is still greater than CDR. • Most European countries and North America transitioned to stage 3, during first half of twentieth century.
THE DEMOGRAPHIC TRANSITION? • Stage 4: Low Growth • Marked by very low birth and death rates • No long-term natural increase and possibly a decrease • Country reaches stage 4 when population gains by CBR are diminished by losses because of CDR. • Condition known as zero population growth (ZPG) • Demographers more precisely define ZPG as the TFR that produces no population change. • Population change results from immigration. • Demographers may eventually ad a 5 th stage for countries in decline.
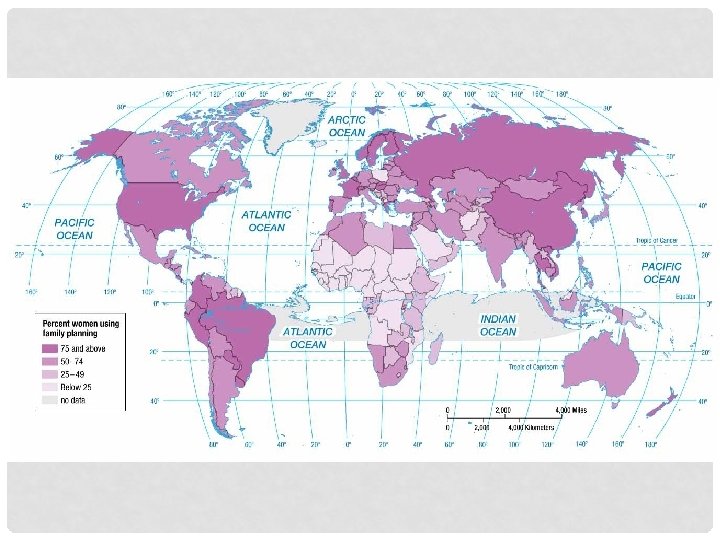
WHY ARE BIRTHRATES DECLINING ? • Two Successful Strategies for Lowering Birth Rates: • Improving Education and Health Care • Emphasizes improving local economic conditions so that increased wealth is allocated to education and health programs seeking to lower birth rates. • Contraception • More immediate results reaped than previous approach • Met with greater resistance, because it goes against cultural or religious beliefs of some.
THOMAS MALTHUS ON OVERPOPULATION • Theory (1798) • Unchecked population would exceed food supply • Increasing population increases likelihood of famine, disease, and war • Poverty increases • The poor are responsible for population increases, because wealthy are educated and understand this • Poor need to stop having children • Reality • Food production has increased over last 50 years faster than Malthus predicted. • His model predicted world population to quadruple over the course of 50 years. • Not even in India has population growth outpaced food production. • Elitist – hold only poorest responsible
EPIDEMIOLOGIC TRANSITION • Medical researches have identified an epidemiologic transition that focuses on distinct health threats in each stage of the demographic transition. • Stage 1: Pestilence and Famine (High CDR) • Principal cause of death: infectious and parasitic diseases • Ex. black plague (bubonic plague)
EPIDEMIOLOGIC TRANSITION • Stage 2: Receding Pandemic (Rapidly Declining CDR) • Pandemic is a disease that occurs over a wide geographic area and affects a very high proportion of the population. • Factors that reduced spread of disease, during the industrial revolution • Improved sanitation • Improved nutrition • Improved medicine • Famous cholera pandemic in London in mid nineteenth century.
EPIDEMIOLOGIC TRANSITION • Stage 3: Degenerative Diseases (Moderately Declining CDR) • Characterized by… • Decrease in deaths from infectious diseases. • Increase in chronic disorders associated with aging. • Ex. Cardiovascular diseases, Cancer • Stage 4: Delayed Degenerative Diseases (Low but Increasing CDR) • Characterized by… • Deaths caused by cardiovascular diseases and cancer delayed because of modern medicine treatments.