Population and Settlement Patterns Key trends in the

 population growth • More population growth")


")


 Notes 400 BC 20")


- Slides: 27
Population and Settlement Patterns
Key trends in the Netherlands • Flat (low) population growth • More population growth in suburbs rather than in center cities (reversing past trend of urbanization) • Suburbanization of poverty
Most populous European countries: 1. 2. 3. 4. 5. 6. 7. Germany France UK Italy Spain Poland Romania 82 million 61 61 59 46 38 22 8. Netherlands 17 U. S. 327 228 ppl/km 2 115 256 201 94 118 90 488 35
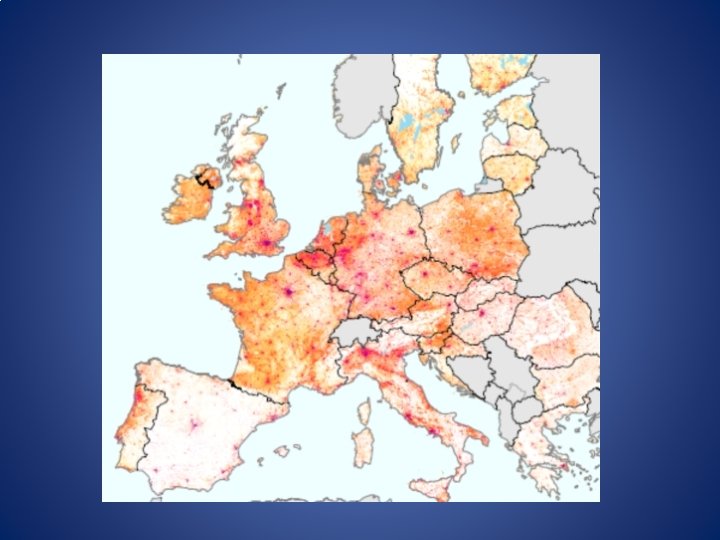
Population density of Europe https: //onlinemaps. blogspot. com/2014/09/europe-population-density-map. html
Population density of Netherlands By Province By Eurostat Div.
The northeast megalopolis of “Bosnywash”
Randstad
The “Green Heart” of Ranstad (Groene Hart)
Urbanization in context Country Percent population in urban areas Belgium 97. 9 Netherlands 91. 5 United States 82. 0 France 80. 0 Germany 75. 7 Italy 69. 3 Portugal 64. 6 China 57. 9
Netherlands most populated cities Name Population 1 Amsterdam, North Holland 741, 636 2 Rotterdam, South Holland 598, 199 3 The Hague, South Holland 474, 292 4 Utrecht, Utrecht 290, 529 5 Eindhoven, North Brabant 209, 620 6 Tilburg, North Brabant 199, 613 7 Groningen, Groningen 181, 194 8 Almere Stad, Flevoland 176, 432 9 Breda, North Brabant 167, 673 10 Nijmegen, Gelderland 158, 732 http: //www. geonames. org/NL/largest-cities-in-netherlands. html
The Netherlands’ City Cores, Commuter Sheds, and Rural Areas Source: PBL Netherlands Environmental Assessment Agency, Cities in the Netherlands, 2016
Growing urban inequalities: • Market-oriented urban policies • Events and spectacles to attract the middle class • Promotion of home ownership • Integration into the global economy • University students graduate and remain
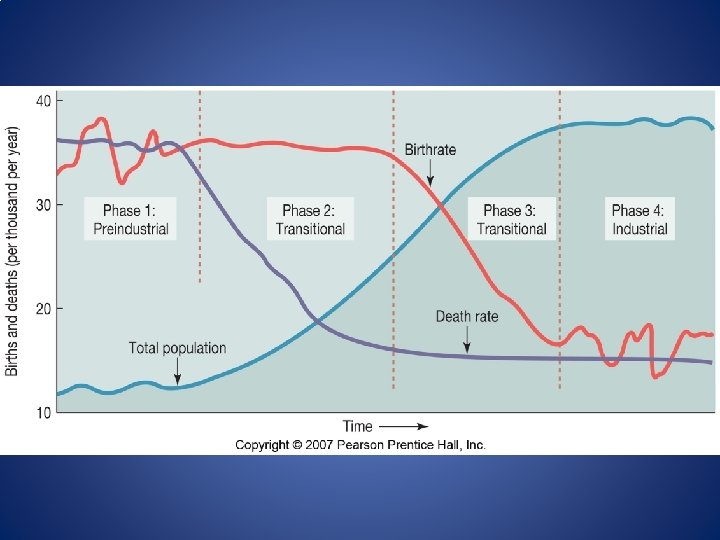
Population Growth and Change
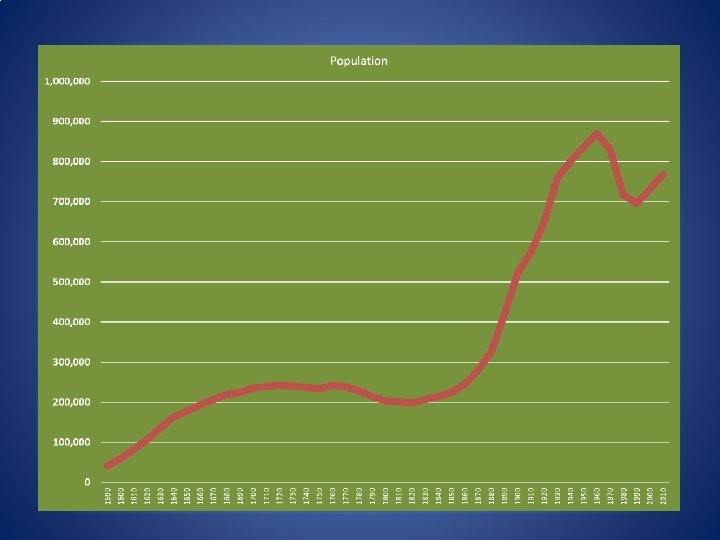
Historical trends in European population growth: Year Population (in millions) Notes 400 BC 20 Greeks and their colonies 200 AD 36 Roman Empire 800 29 Fall of Rom Empire; pandemics 1300 80 Black Death in 1340 s 1500 80 1800 160 1940 515 Industrial Revolution; Great Migration 2010 600 In-migration
Understanding the Population Trend in Amsterdam
Fertility rates over time
Fertility rates by European NUTS regions Under 1. 2 up to 1. 4 up to 1. 6 up to 1. 8 up to 2. 0 and over
Demographic change in Amsterdam Births/ Deaths Settling/ Moving Away Immigration/ Emigration 1980 2010 2040
Forecasted Population Change in NL Source: UN, World Population Projections, http: //worldpopulationreview. com/countries/netherlands-population/
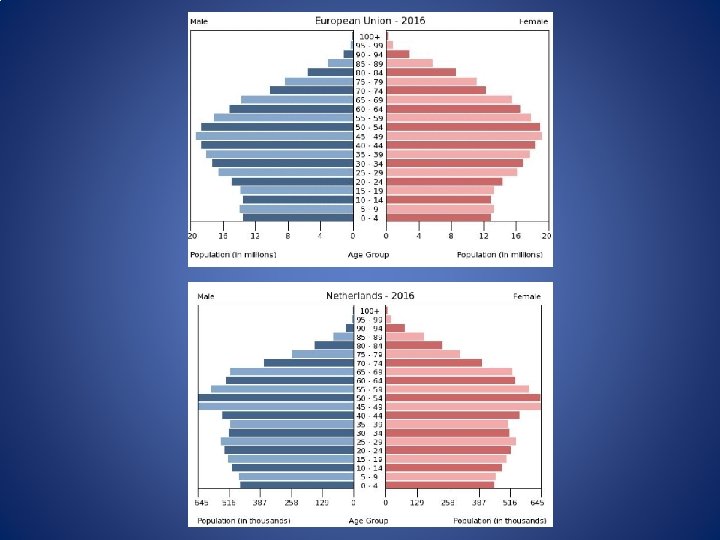
Population Structure: Age and Sex
Population Pyramids
Comparative dependency ratios Total % Youth Elderly Netherlands 53. 1 25. 6 27. 4 France 59. 2 29. 1 30. 2 Italy 56. 5 21. 5 35. 0 United States 51. 2 29. 0 22. 1 China 37. 7 24. 3 13. 3 South Sudan 83. 7 77. 3 6. 4 Youth (0 -14) + Elderly (65+) Working Population (15 -64)
End of show