Population and Global Health Stephen Gloyd MD MPH

Population and Global Health Stephen Gloyd, MD, MPH GH 101 February 2014
 “As we crawled")
“One stinking hot night in Delhi” (description of the population problem) “As we crawled through the city [in a taxi], we entered a crowded slum area. The temperature was well over 100, and the air was a haze of dust and smoke. The streets seemed alive with people. People eating, people washing, people sleeping. People visiting, arguing, and screaming. People thrusting their hands through the taxi window, begging. People defecating and urinating. People clinging to buses. People herding animals. People, people, people. As we moved slowly through the mob, hand horn squawking, the dust, noise, heat, and cooking fires gave the scene a hellish aspect. Would we ever get to our hotel? ” Paul Ehrlich, ‘The Population Bomb’ 1960

Response: Mahmood Mamdani “The fact is that a hot summer night on Broadway in New York or Picadilly Circus in London would put Ehrlich in the midst of a far larger crowd. …. . …what disturbed him about the crowd in Delhil was not its numberss, but its ‘quality’ – that is, its poverty. …to talk, as Ehrlich does, of ‘overpopulation’ is to say to people: you are poor because you are too many. ’ Mamdani, The Myth of Population Control, 1972
 Crude Mortality Rate #")
Population Terms Crude Birth Rate # births/1000 pop (or women) Crude Mortality Rate # deaths/1000 pop (General) Fertility Rate # births/15 -44 women Total Fertility Rate avg # children/woman in lifetime Population Growth Rate CBR-CMR Dependency Rate Pop <20 + Pop >65/pop 20 -64

History of Approaches to Population • Encouragement of population growth • Malthus 1798 – anti-public assistance for poor • Eugenics movement (USA – 1900 -30) • Population crisis (1960 -1980) • Debates about population-health-povertyenvironment – – – Mexico City Conference 1964 Cairo Conference 1994 Clinton-Gore policies (Homer-Dixon, Kaplan) Projections of late 2002 Bush policies (“Global Gag Rule”) Obama’s policies

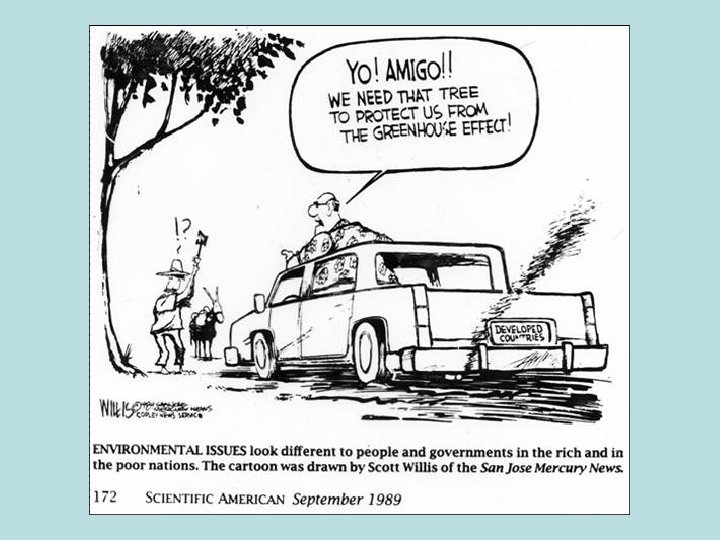
Population, poverty & hunger • India has 2 x more cropped land/person than China • Bangladesh has 2 x more farmland/person than Sri Lanka • Honduras has more farmland than Costa Rica Population and Pollution • Average American consumes 30 x more than average African • African growth rate would have to be 10 x higher to be a problem for world’s non-renewable resources • Brazil: 2% own 60% of arable land. Logging and cattle ranching patterns reflect land ownership patterns

Is population a root cause of… • Poverty? – Poor families have more children – Poor countries have high growth rates • Hunger? – Famines in India, Bangladesh, Ethiopia – World production of food vs. population • Environmental degradation? Contributors: – Rich areas (fossil fuels, consumption, waste) – Poor areas (wood (fuel) – erosion)
")
Basics: Empirical evidence exists that: • Population is growing rapidly (esp. in developing countries) • Migration to urban areas has increased everywhere • Poor countries have higher population growth rates • Poor families have more children • Global environment is compromised by pollution & warming Questions for policy: • Are population growth, large family size, high population density root causes of poverty, hunger, pollution? • Is urbanization a root cause of poverty hunger, pollution? • Does family planning reduce population growth? • Does family planning improve health and development?

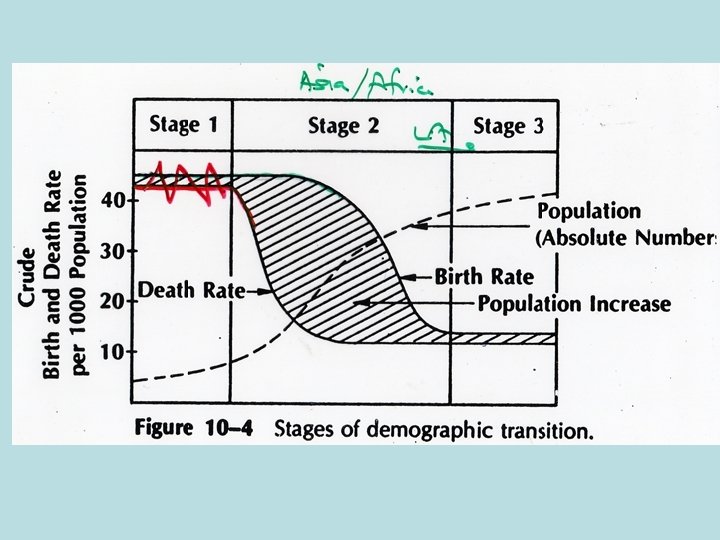
Classic Stages of Demographic Transition Note: Natural increase is produced from the excess of births over deaths.

Less Developed Countries Have More Young People Relative to Elderly Source: United Nations Population Division, World Population Prospects: The 2006 Revision, and Population Reference Bureau (2010)

Relationships between Population, Health and Poverty Are there causal relationships between: 1. Rapid population growth 2. High population density 3. Large family size and health and poverty indices? Overall answer: – Variable associations (positive and negative) – Usually small quantitative relationships, if any – Not a dominant effect

Population Density
 (among countries over 20 m pop) Poorest Ethiopia Bangladesh DRC Uganda")
Population Density (pp/km) (among countries over 20 m pop) Poorest Ethiopia Bangladesh DRC Uganda Myanmar 1997 34 688 13 86 62 2010 75 1033 28 139 71 Other countries Vietnam Netherlands India China Haiti Kenya Nigeria Kerala (30 m) Richest USA Japan Germany France UK 1997 223 351 227 107 192 33 104 819 1997 25 322 225 110 230 2010 265 400 373 140 360 70 171 Source: United Nations World Population Prospects (2004 revision). Data is for 2005. 2010 32 335 231 114 255

Global Population Density Source: http: //sedac. ciesin. columbia. edu/wdc/map_gallery. jsp

Is population density a causal factor in poverty or malnutrition? • High population density might potentially lead to poverty, malnutrition, or poor health by decreasing the amount of arable land for farming, thus reducing available food. • Also, increased density might increase pollution and reduce fuel biomass No analysis has demonstrated a causal link. Note: Many of the densest populations are well off rich countries in Europe or Asia. Pollution is not consistently associated with high population density (e. g. , USA)

Family Size

Is large family size a causal factor in poverty? Theoretical arguments, pro and con: Large family size can lead to poverty by • increasing intra-household inequality, by decreasing the ability of women to work for pay • decreasing opportunities for education and health of children • by reducing the family's ability to save and invest to protect itself from unexpected decreases in income. Large family size can operate to reduce poverty by • providing resources to a resource-poor household (from family chores to income generation) • providing security for old age • enlarging the pool of potential generators of wealth for families who have income insecurity.

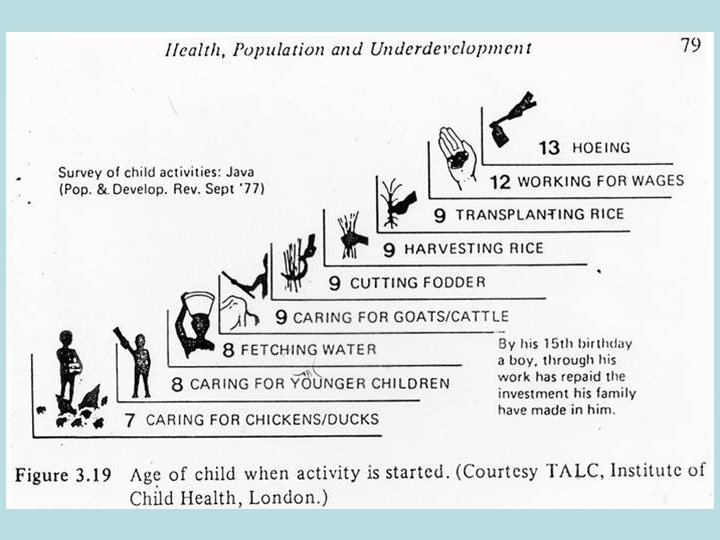
Why do poor families have many children? 1. Children as resources: labor, income, insecurity 2. Powerlessness of women, men 3. Son preference 4. Religion, social class, culture 5. Lack of health services

Women of Childbearing Age and Fertility Worldwide Source: United Nations, World Population Prospects: The 2004 Revision (medium scenario), 2005.

Is large family size a causal factor in poverty? Evidence: • Studies from developed countries generally find evidence of a negative impact of family size on child well-being • Empirical studies from developing countries is mixed – both positive and negative impacts (Ahlburg, Pop Growth & Poverty 1994) • Extra birth (twins) reduces schooling of siblings 17 -34% (Rosensweig, JPol. Econ 1990) • Large families (older children and relatives) provide additional resources and level out fluctuations of income in poor families • Small impact of family size compared to education, assets, family income (most authors)

Population Growth
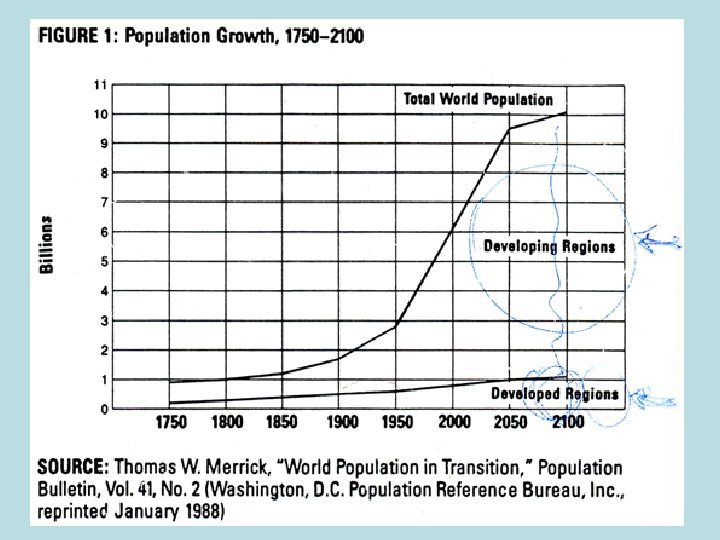
: 1950 -2050")
Developing Regions Make Up an Increasing Share of World Population (in Billions): 1950 -2050 Source: United Nations Population Division, World Population Prospects: The 2006 Revision, and Population Reference Bureau (2008).

Projected Population Change Percent Population Change, 2005 -2050 Source: Population Reference Bureau, 2005 World Population Data Sheet.

Less Developed Countries Have More Young People Relative to Elderly Population by Age and Sex, Less Developed Countries: 2008 Source: United Nations Population Division, World Population Prospects: The 2006 Revision, and Population Reference Bureau (2008)

Population Growth - some studies • Regression analysis of 22 countries from 1960 -1985: Pop growth was not associated with changes in poverty, using different measures of poverty, models, and time periods (Squire, Am. Ec. Rev 1993) • No evidence of wage decrease during 60 -80 population growth (accommodations –land reform, land inputs, increased non-agricultural employment, development of human capital of poor) • Past population growth = higher GNP/capita growth; recent pop growth = lower GNP/capita growth difficult to assess cause and effect (Johnson, Lee, Pop Growth&Devt 1987)

Other studies/observations re Population Growth • Common property decrease from 1950 -80 (firewood, free ranging for animals, water, building materials) – but result of government policy as much as growth (Jodha 1990) • Decrease educational expense per child in countries with larger population growth – but mostly related to economic adjustment and social policies (Cox, Jiminez)

Thus, Causal effect of rapid population growth and poverty is basically unclear “It is likely that …these studies are too unreliable for significant inferences to be made, except perhaps for two: 1) that population is not a dominant effect—…. and 2) that no analyses have yet been conducted that fully meet contemporary econometric standards. ” Robert Cassen, 1994, ODC Policy Implication: “…If family planning programs are driven by demographic goals (as they frequently have been), they will often fail to address women's reproductive health problems and actually diminish the prospects of the demographic goals being met. ”

Summary Are there causal relationships between: • High population growth • Large family size • High population density and health and poverty indices? Overall answer: • Variable associations (positive and negative) • Usually small quantitative relationships, if any • Not a dominant effect
 (estimates from PRB, studies not")
Does birth spacing improve health? Birth spacing (>2 yrs) (estimates from PRB, studies not documented) • Reduces mortality of second child by 2 x • Can prevent 25% of infant deaths • Can prevent 25% of maternal deaths (20% if meeting just existing demand) BUT, no change in risk of death • Doubling birth intervals increases birth weight 3 -6%; postponing birth one year increases BW 1. 4 -3. 2%
 work? Family Planning = Conscious effort of couples to")
Does family planning (in general) work? Family Planning = Conscious effort of couples to regulate the number and spacing of births through artificial and natural methods of contraception. Among users compared to non-users • Reduction in child mortality (~25%) • Reduction in maternal deaths (~25%) How? • Reduces maternal depletion and teen childbearing • Reduces abortions (20 m/yr resulting in ~75, 000 deaths) • Condom use prevents HIV/AIDS • Gives women (and men) power to choose when to be pregnant Source: White Ribbon Alliance for Safe Motherhood

Use of contraception Population control programs: “But they were so nice, you know. And they came from distant lands to be with us. Couldn’t we even do this much for them? Just take a few tablets? Ah! Even the gods would have been angry with us. They wanted no money for the tablets. All they wanted was that we accept the tablets. I lost nothing and probably received their prayers. And they, they must have gotten some promotion. ” Khanna Study, Mamdani, “The Myth of Population Control” 1972

Different Patterns of Contraceptive Use Percent of Married Women Using Contraception, Selected Countries N. A. – Data not available. Sources: Demographic and Health Surveys and United Nations Population Division, Population Reference Bureau

100 Percentage of Women Giving Birth by Age 20, by Level of Education None 75 Primary Grade Secondary Grade 50 25 Africa Latin America, Caribbean Asia (U. N. Population Fund. State of the World Population 2003. http: //www. unfpa. org/swp/2003 swpmain. htm )

Application of Family Planning Programs • Large unmet need (Mozambique – 80% want to “rest” between pregnancies) • Current demand 150 million women –worldwide • Low cost (~$2/cap/yr) • Works within health care system • Donors like it Source: White Ribbon Alliance for Safe Motherhood

Different Patterns of Fertility Decline Fertility Patterns for Selected Countries: 1950 -2010 Sources: United Nations Population Division, World Population Prospects: The 2006 Revision; Population Reference Bureau; and Korea National Statistics Office.

Underlying conditions Intermediate outcomes & symptomatic issues Desired outcomes Lower pop- density Lower fertility Reduced teen pregnancy Family planning Birth spacing Smaller family size Reduced Maternal Mort Education Poverty Reduction Family income National Income (GNP/cap) Access to PHC, prenatal, birth, child care Family Nutrition Water, San, Hygiene Reduced perinatal & child mortality Reduced disease (HIV, malaria, etc)

Food and Hunger

Global Cropland

Source: http: //sedac. ciesin. columbia. edu/wdc/map_gallery. jsp
 from “Food First” 1. There is simply not enough food")
Myths regarding hunger (1) from “Food First” 1. There is simply not enough food 2. Droughts and other natural conditions beyond human control cause famine 3. There are too many mouths to feed 4. Pressure to feed the world is destroying the environment 5. The green revolution is the answer 6. Efficient production requires large scale farming
 7. A free market will alleviate hunger 8. Free international")
Myths regarding hunger (2) 7. A free market will alleviate hunger 8. Free international trade would increase exports of poor countries to allow importation of goods to alleviate hunger 9. The poor are too hungry, too passive to revolt against the conditions which make them poor and hungry 10. More international assistance will help the hungry 11. People in rich countries benefit from the conditions which create poverty and hunger in poor countries 12. Societies which have eliminated hunger also eliminate freedoms

Climate Change & the Environment

Source: http: //sedac. ciesin. columbia. edu/wdc/map_gallery. jsp

Developed Countries Consume More

Third World population growth and the environment – a bum rap?

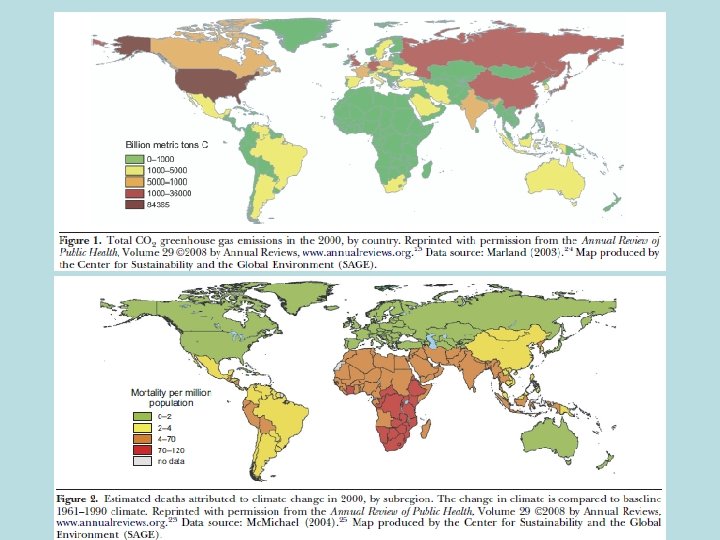
Health Impacts of Climate Change

Thank you!
- Slides: 52