
Population and Development www assignmentpoint com www assignmentpoint
- Slides: 20
Population and Development www. assignmentpoint. com
www. assignmentpoint. com
www. assignmentpoint. com
www. assignmentpoint. com
www. assignmentpoint. com
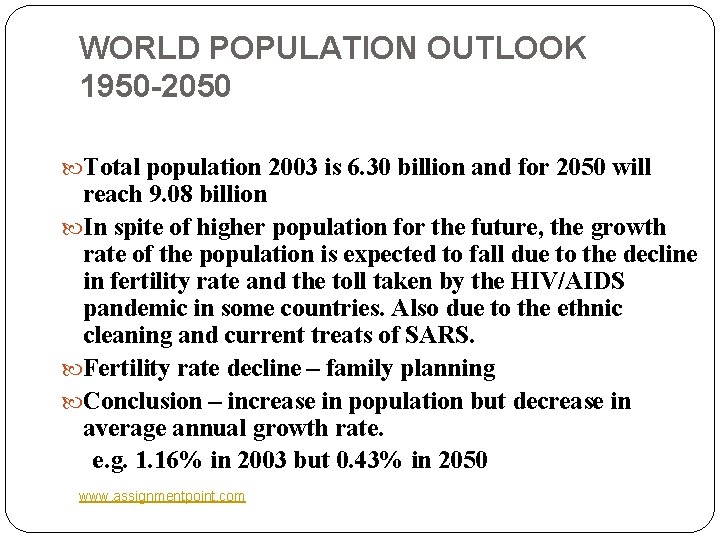
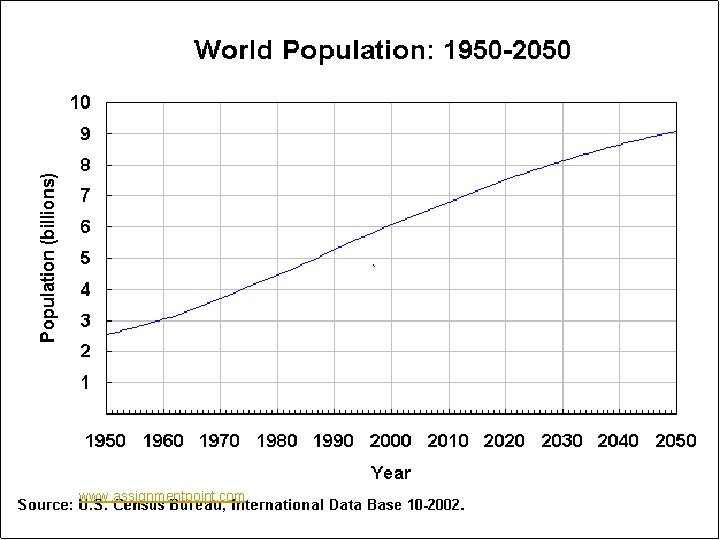
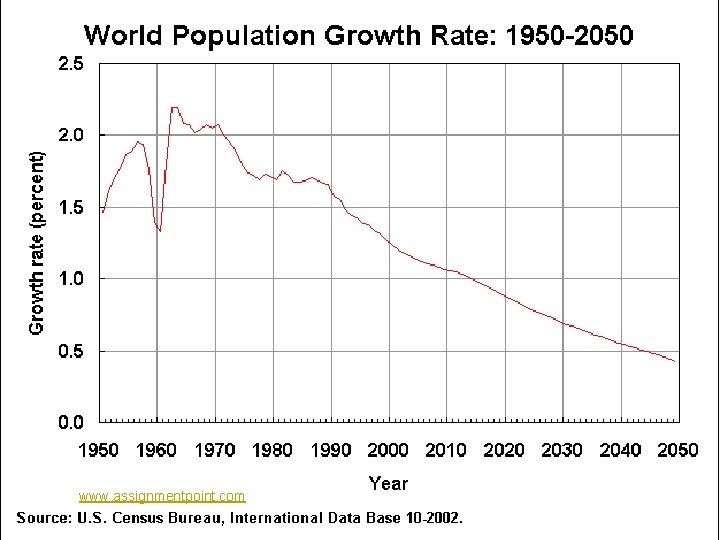
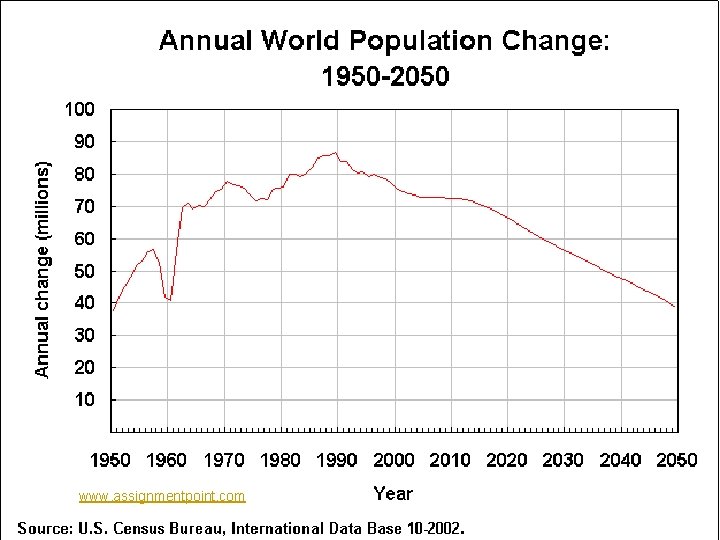
WORLD POPULATION OUTLOOK 1950 -2050 Total population 2003 is 6. 30 billion and for 2050 will reach 9. 08 billion In spite of higher population for the future, the growth rate of the population is expected to fall due to the decline in fertility rate and the toll taken by the HIV/AIDS pandemic in some countries. Also due to the ethnic cleaning and current treats of SARS. Fertility rate decline – family planning Conclusion – increase in population but decrease in average annual growth rate. e. g. 1. 16% in 2003 but 0. 43% in 2050 www. assignmentpoint. com
www. assignmentpoint. com
www. assignmentpoint. com
www. assignmentpoint. com
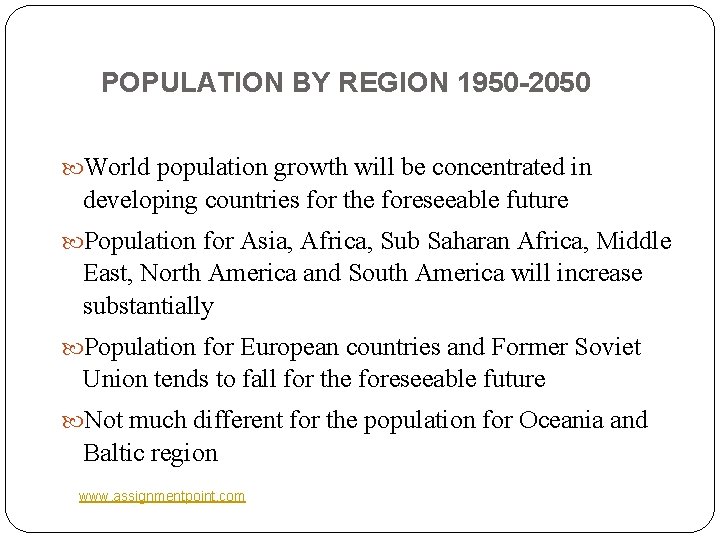
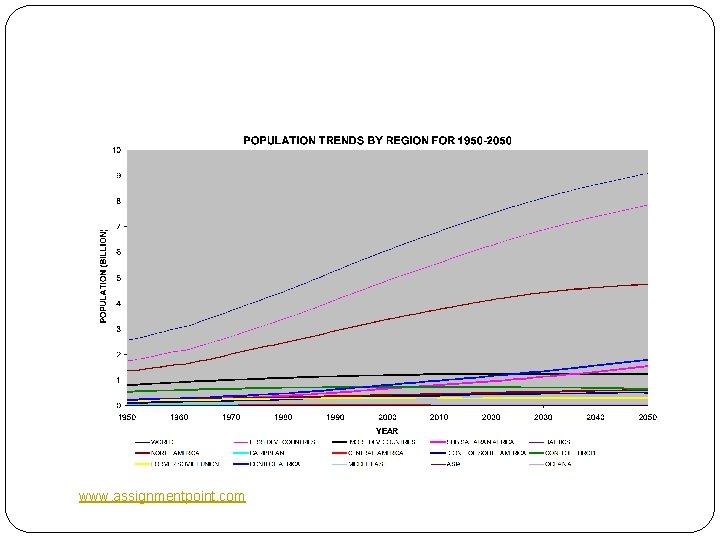
POPULATION BY REGION 1950 -2050 World population growth will be concentrated in developing countries for the foreseeable future Population for Asia, Africa, Sub Saharan Africa, Middle East, North America and South America will increase substantially Population for European countries and Former Soviet Union tends to fall for the foreseeable future Not much different for the population for Oceania and Baltic region www. assignmentpoint. com
www. assignmentpoint. com
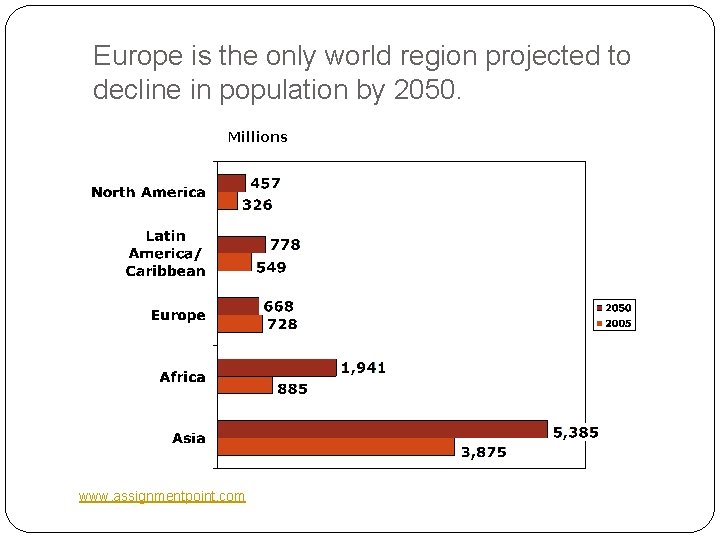
Europe is the only world region projected to decline in population by 2050. Millions www. assignmentpoint. com
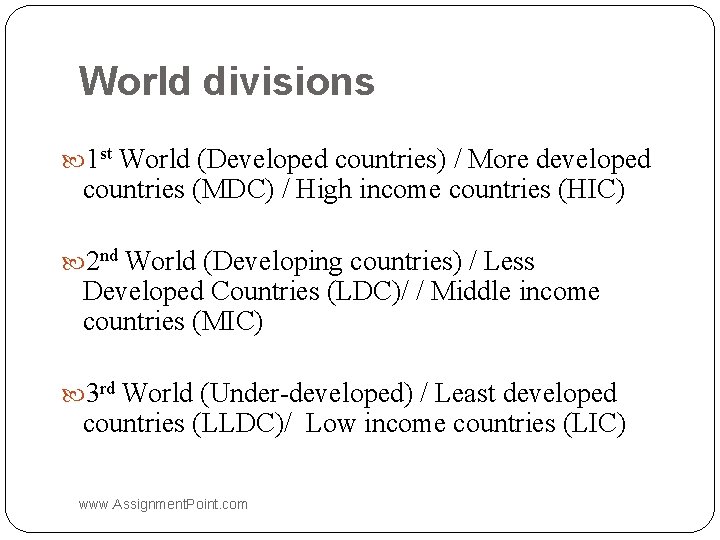
World divisions 1 st World (Developed countries) / More developed countries (MDC) / High income countries (HIC) 2 nd World (Developing countries) / Less Developed Countries (LDC)/ / Middle income countries (MIC) 3 rd World (Under-developed) / Least developed countries (LLDC)/ Low income countries (LIC) www. Assignment. Point. com
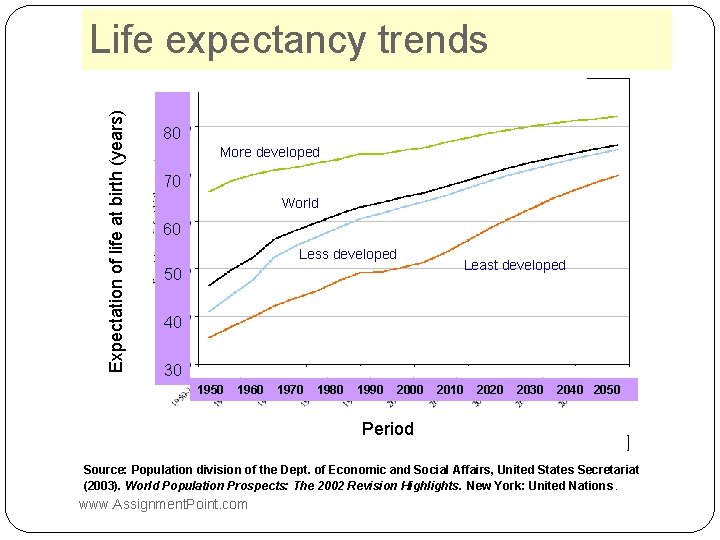
Life expectancy trends Expectation of life at birth (years) 90 80 More developed 70 World 60 Less developed 50 Least developed 40 30 1950 1960 1970 1980 1990 2000 2010 2020 2030 2040 2050 Period Source: Population division of the Dept. of Economic and Social Affairs, United States Secretariat (2003). World Population Prospects: The 2002 Revision Highlights. New York: United Nations. www. Assignment. Point. com
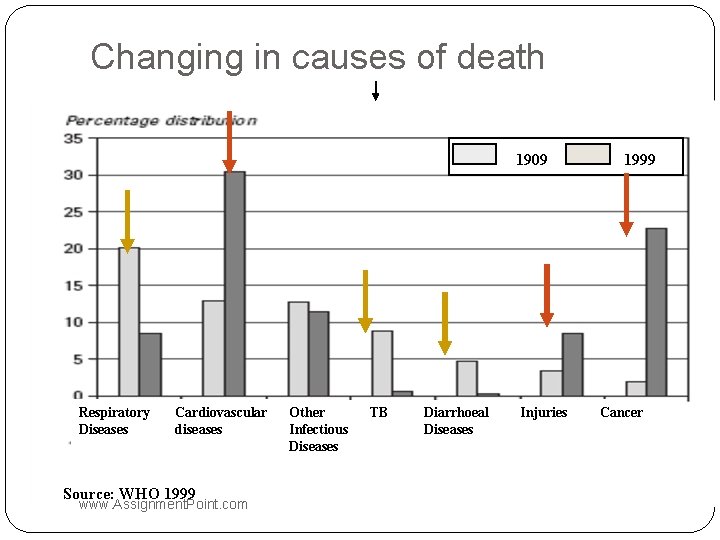
Changing in causes of death 1909 Respiratory Diseases Cardiovascular diseases Source: WHO 1999 www. Assignment. Point. com Other Infectious Diseases TB Diarrhoeal Diseases Injuries 1999 Cancer
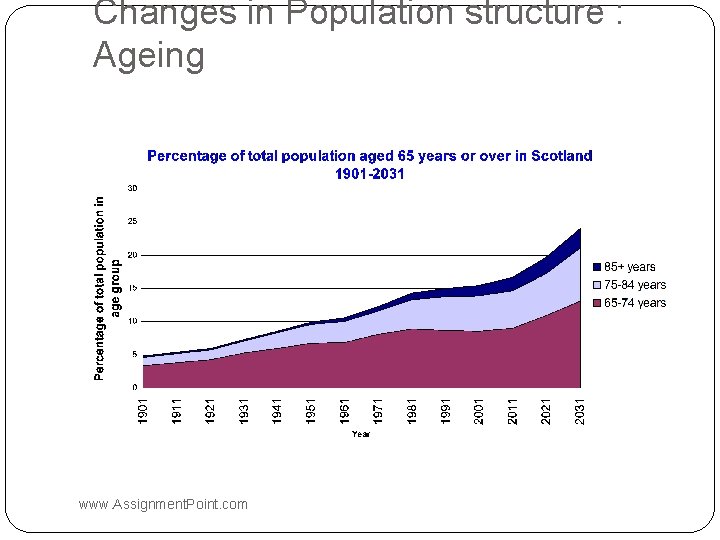
Changes in Population structure : Ageing www. Assignment. Point. com
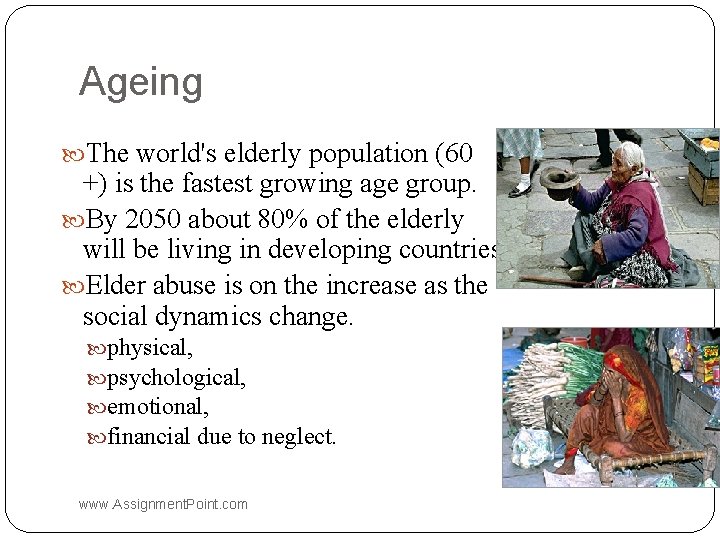
Ageing The world's elderly population (60 +) is the fastest growing age group. By 2050 about 80% of the elderly will be living in developing countries Elder abuse is on the increase as the social dynamics change. physical, psychological, emotional, financial due to neglect. www. Assignment. Point. com
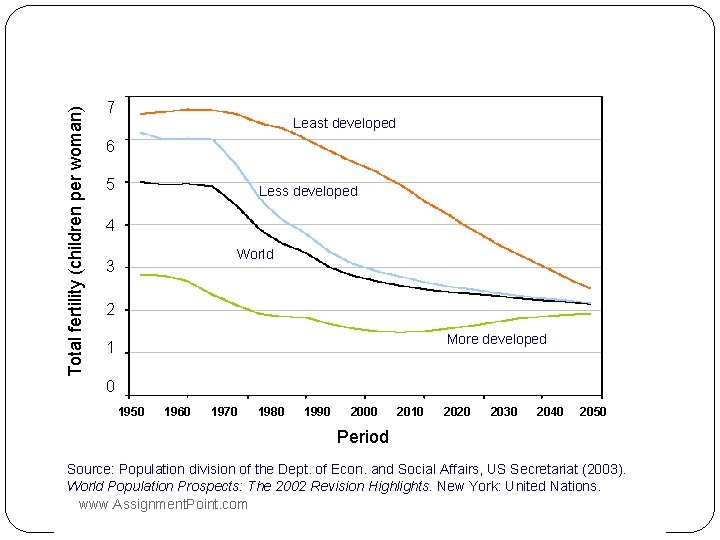
Total fertility (children per woman) Changing in fertility trends 7 Least developed 6 5 Less developed 4 3 World 2 More developed 1 0 1950 1960 1970 1980 1990 2000 2010 2020 2030 2040 2050 Period Source: Population division of the Dept. of Econ. and Social Affairs, US Secretariat (2003). World Population Prospects: The 2002 Revision Highlights. New York: United Nations. www. Assignment. Point. com
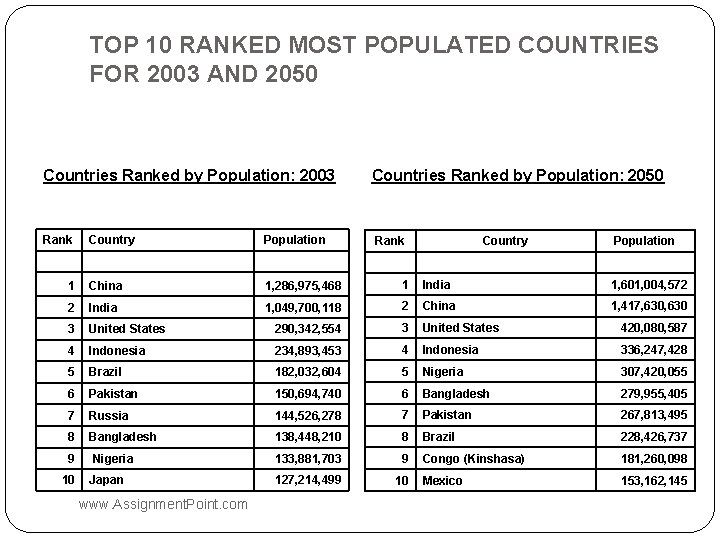
TOP 10 RANKED MOST POPULATED COUNTRIES FOR 2003 AND 2050 Countries Ranked by Population: 2003 Rank Country Population Countries Ranked by Population: 2050 Rank Country Population 1 China 1, 286, 975, 468 1 India 1, 601, 004, 572 2 India 1, 049, 700, 118 2 China 1, 417, 630 3 United States 290, 342, 554 3 United States 420, 080, 587 4 Indonesia 234, 893, 453 4 Indonesia 336, 247, 428 5 Brazil 182, 032, 604 5 Nigeria 307, 420, 055 6 Pakistan 150, 694, 740 6 Bangladesh 279, 955, 405 7 Russia 144, 526, 278 7 Pakistan 267, 813, 495 8 Bangladesh 138, 448, 210 8 Brazil 228, 426, 737 9 Nigeria 133, 881, 703 9 Congo (Kinshasa) 181, 260, 098 10 Japan 127, 214, 499 10 Mexico 153, 162, 145 www. Assignment. Point. com
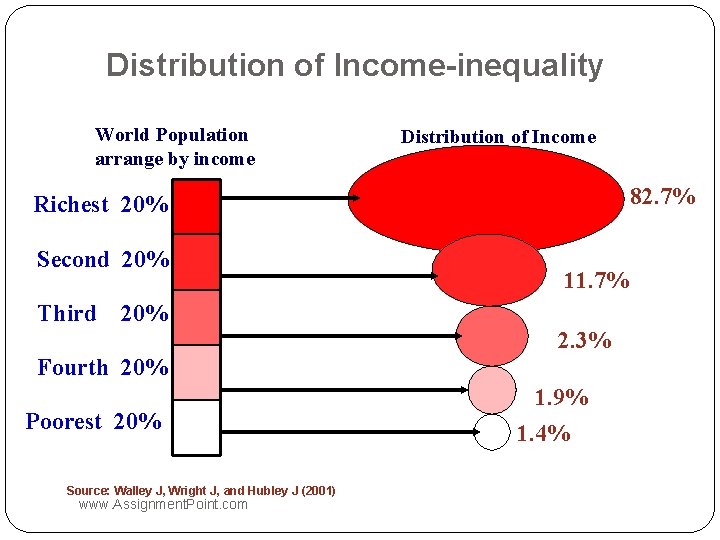
Distribution of Income-inequality World Population arrange by income Distribution of Income 82. 7% Richest 20% Second 20% Third 11. 7% 20% 2. 3% Fourth 20% Poorest 20% Source: Walley J, Wright J, and Hubley J (2001) www. Assignment. Point. com 1. 9% 1. 4%