Pond Routing n n n The purpose for


 The orifice has a 6 -inch diameter with centerline elevation 0.")
 pairs")

 Create a worksheet with the following columns.")
")


 Create a worksheet with the following columns.")


 h-orifice (ft) Orifice Q (cfs) h-weir")
 h-orifice (ft) Orifice Q (cfs) h-weir (ft) Weir Q")
 Create a worksheet with")
 pairs Dt = 30 – 20 = 10 minutes")
 h (ft) S (cu")
 S (cu ft) Q (cfs) 2 S/Dt + Q")


=0. 00 and I")


=0. 00 and I")
=2. 00 and I")

- Slides: 42
Pond Routing n n n The purpose for this presentation is to illustrate pond routing calculations. These calculations are fundamental to the analysis and design of stormwater ponds. Hint: Definitely be able to perform pond routing calculations for the second hourly exam and final exam.
Stormwater Ponds n n Stormwater ponds are implemented mostly to control one or more aspects of runoff from a disturbed site, typically an area undergoing urban development. For the purposes of this class, consider urban development to involve conversion of natural land use to residential, commercial, industrial, and transportation systems land use.
Stormwater Ponds n n n Stormwater ponds are classified as detention, retention, and detention-retention ponds. There are variations to these classifications, as well as additional classifications. In this class, we will consider the three types named above.
Stormwater Ponds n n Detention ponds provide temporary storage and are designed and implemented to control the peak runoff rate from the site in question. Retention ponds provide long-term storage and are implemented to control runoff volume.
Stormwater Ponds n n Retention-Detention ponds are implemented to control a designated portion of the runoff volume, e. g. , the first inch of runoff, regulate peak outflow rates, and often to capture sediment and other forms of nonpoint source pollution, i. e. stormwater quality. In fact, most sediment retention ponds are stormwater retention-detention ponds.
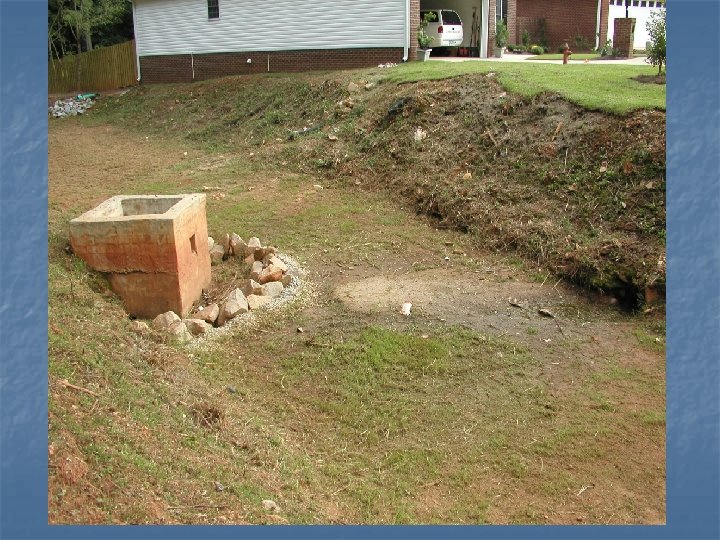
Consider a local pond n n n This pond was constructed and operated as a sediment retention and stormwater retention-detention pond during constuction phase. The pond bottom was 3 -feet lower than in this picture. After construction phase was completed, the pond was converted to a stormwater detention pond by raising the pond bottom to the lowest orifice elevation.
Consider the Outflow Structure Third n n Water discharges from the pond through a three. Second stage riser. The first stage is a set of orifices at the bottom of pond elevation. The second stage is the set of orifices above the mid-point of the riser. The third stage is the rectangular weir at the top of the riser. First
Routing: Purpose and Applications n n n Pond routing is performed when designing a new pond or evaluating the performance of an existing pond. Pond design involves determining pond dimensions (for the chosen geometry), sizing the various elements of the outflow structure, and assigning their elevations. Evaluating pond performance involves using known pond and outflow structure information to simulate the outflow hydrograph and pond storage for a designated rainfall event.
Routing: Purpose and Applications n n Pond routing by the most common methods uses a finite difference solution to the hydrologic form of continuity. This equation involves two unknowns: pond storage and flowrate at the end of the finite difference computational time step, Dt.
Information about pond storage and outflow is included with stage-storage and stageoutflow rating relationships.
Routing: Purpose and Applications n n n Pond routing draws on three functional relationships: continuity equation, stage-storage rating relationship (equation, table or graph), and stage-outflow rating. The stage-storage and stage-outflow curves are combined into a single functional relationship between 2 S/Dt + Q and Q. As such, there are two equations—albeit nonlinear—in two unknowns.
Solve the following example problem to illustrate pond routing and calculations.
Problem Statement Route the given stormwater hydrograph through a trial pond with the following properties: Geometry is an inverted quadrilateral frustum; base length is 70 feet; base width is 45 feet; side slopes are 3: 1 (h: v); maximum depth is 5 feet; outflow device is a riser with a first stage orifice and second stage rectangular weir.
Inverted Quadrilateral Frustum
Problem Statement (cont’d) The orifice has a 6 -inch diameter with centerline elevation 0. 25 feet above the pond bottom, i. e. , the orifice is located at the base of the riser. The weir has base length (or width as some people describe it) of 0. 4 feet, a weir coefficient of 3. 3, and its crest elevation is 3 feet above the bottom of the pond.
Inflow Hydrograph (T, Q) pairs
Note About Runoff Hydrograph This runoff hydrograph was simulated by convoluting the excess rainfall for a design storm with the watershed unit hydrograph. Convolution is a series of computations you absolutely must learn in this class and is the technique used by many professional-grade stormwater programs to simulate runoff hydrographs.
Step 1: Develop Stage-Storage Rating Relationship (Table) Create a worksheet with the following columns. Enter the depth at user specified intervals up to the maximum depth. Enter the base length and width. h, feet L, feet W, feet 0 1 70 45 2 3 4 5 A, sq ft DS, cu ft S , cu ft
Formulas These formulas apply to an inverted quadrilateral frustum. At any depth h: L(h) = Lo + 2*zh Lo= L(h=0. 0) W(h) = Wo +2 zh Wo= W(h=0. 0) A(h) = L(h) * W(h) DS(h) = 0. 5*(A(h)+A(h-Dh))*Dh S(h) = S(h-Dh)+DS(h)
Apply the equations and complete this table. Dh h, feet L, feet 0 70 W, feet x L(h) = Lo + 2*zh 1 76 45 A, sq ft 3, 150 = W(h) = Wo + 2*zh 51 3, 876 DS, cu IV ft S , cu ft 0 + 3, 513 = 3, 513 2 A(h)=L(h)*W(h) 3 4 5 0 DS(h) = 0. 5*(A(h)+A(h-Dh))*Dh
Check Your Values h, feet L, feet W, feet A, sq ft DS, cu ft S , cu ft 0 70 45 3, 150 0 0 1 76 51 3, 876 3, 513 2 82 57 4, 674 4, 275 7, 788 3 88 63 5, 544 5, 109 12, 897 4 94 69 6, 486 6, 015 18, 912 5 100 75 7, 500 6, 993 25, 905
Step 2: Develop Stage-Discharge Rating Relationship (Table) Create a worksheet with the following columns. Enter the depth at user specified intervals up to the maximum depth. Enter zeros for the orifice and weir heads and flows at h=0. 0. h (ft) h-orifice (ft) Orifice Q (cfs) h-weir (ft) Weir Q (cfs) Outflow (cfs) 0 0 0. 00 1 2 3 4 5
Formulas
Formulas
Apply Equations and Complete This Table h (ft) h-orifice (ft) Orifice Q (cfs) h-weir (ft) Weir Q (cfs) Outflow (cfs) 0 0 0. 00 1 h-orifice=h - Do/2=h - 0. 5/2 2 Outflow = Orifice Q + Weir Q h-weir=h - crest elev=h-3 Orifice Equation Weir Equation 3 2. 75 1. 57 0. 00 1. 57 4 3. 75 1. 83 1. 00 1. 32 3. 15 5 Do it for h = 4
Check Your Values h (ft) h-orifice (ft) Orifice Q (cfs) h-weir (ft) Weir Q (cfs) Outflow (cfs) 0 0 0. 00 1 0. 75 0. 82 0. 00 0. 82 2 1. 75 1. 25 0. 00 1. 25 3 2. 75 1. 57 0. 00 1. 57 4 3. 75 1. 83 1. 00 1. 32 3. 15 5 4. 75 2. 06 2. 00 3. 73 5. 79
Step 3: Develop 2 S/Dt + Q Rating Relationship (Table) Create a worksheet with the following columns. Enter the depth at user specified intervals up to the maximum depth. Transfer storage and outflow values from the Stage-Storage and Stage-Outflow rating tables. h (ft) S (cu ft) Q (cfs) 2 S/Dt + Q (cfs) 0 1 2 3 4 5 0 3, 513 7, 788 12, 897 18, 912 25, 905 0. 00 0. 82 1. 25 1. 57 3. 15 5. 79 0. 00 Select Dt equal to the hydrograph time increment.
Inflow Hydrograph (T, Q) pairs Dt = 30 – 20 = 10 minutes
Step 3: Develop 2 S/Dt + Q Rating Relationship (Table) h (ft) S (cu ft) Q (cfs) 2 S/Dt + Q (cfs) 0 0 0. 00 1 3, 513 0. 82 2 7, 788 1. 25 3 12, 897 1. 57 4 18, 912 3. 15 5 25, 905 5. 79 12. 53
Check Your Values h (ft) S (cu ft) Q (cfs) 2 S/Dt + Q (cfs) 0 0 0. 00 1 3, 513 0. 82 12. 53 2 7, 788 1. 25 27. 21 3 12, 897 1. 57 44. 56 4 18, 912 3. 15 66. 19 5 25, 905 5. 79 92. 14
Step 4: Develop Modified Puls Routing Table Since the initial condition is a dry pond and the first inflow value is zero, enter zeroes in all columns at time = 0. 00. Enter time at 10 minute intervals and the corresponding inflow hydrograph values. For this example, we are considering only the first 50 minutes. Don’t forget to allow sufficient time for the stormwater hydrograph to flow into the pond and fully drain from the pond. Time Inflow I 1+I 2 0 0. 00 10 2. 0 20 6. 7 30 11. 4 40 12. 9 50 11. 1 2 S 1/Dt-Q 1 2 S 2/Dt+Q 2 0. 00 Y 2 Q 2 0. 00
Note three terms of the routing equation are in columns 3, 4, and 5. Use the value of 2 S 2/Dt + Q 2 to interpolate on the 2 S/Dt + Q table for Y 2 and Q 2. 1 Time Inflow I 1+I 2 0 0. 00 10 2. 0 20 6. 7 30 11. 4 40 12. 9 50 11. 1 2 3 + 2 S 1/Dt-Q 1= 2 S 2/Dt+Q 2 0. 00 Y 2 Q 2 0. 00
Solve for the outflow, Q 2, at time=10 minutes. I 1=I(t=0)=0. 00 and I 2=I(t=10)=2. 00. I 1+I 2=0. 00+2. 00=2. 00. The value of 2 S 1/Dt - Q 1 at 10 minutes equals the value of 2 S 2/Dt + Q 2 at 0 minutes minus twice (2 times) the value of Q 2 at 0 minutes, which for this time step equals 0. 00. Per the routing equation: 2 S 2/Dt + Q 2 equals the sum of I 1 + I 2 and 2 S 1/Dt - Q 1, which is 2. 00 + 0. 00 = 2. 00. Time Inflow I 1+I 2 2 S 1/Dt-Q 1 2 S 2/Dt+Q 2 0 0. 00 10 2. 00 0. 00 2. 00 Y 2 Q 2 0. 00
Linear Interpolation Formula Find y for a given x. The unknown y lies proportionately between the two known points, y 0 and y 1, as x does between x 0 and x 1. Consider similar triangles. y minus y 0 is to x minus x 0 as y 1 minus y 0 is to x 1 minus x 0. Stated mathematically,
Interpolate for Y 2 and Q 2. 2 S 2/Dt+Q 2 Y 2 Q 2 0. 00 2. 00 Consider the last three columns of the routing table. The unknowns y 2 and Q 2 are y in the interpolation equation. It should be obvious that Y 2 lies between h=0 and h=1. h (ft) S (cu ft) Q (cfs) 2 S/Dt + Q (cfs) 0 0 0. 00 1 3, 513 0. 82 12. 53
Where Is Y 2 ? 2 S 2/Dt+Q 2 Y 2 Q 2 0. 00 2. 00 h (ft) Between 0 and 1 0 1 Y 2 From the previous slide: “It should be obvious that Y 2 lies between h=0 and h=1. ” Why? Because of where the value of 2 S 2/Dt+Q 2 occurs in the 2 S/Dt+Q column. So, where is Y 2? S (cu ft) Q (cfs) 2 S/Dt + Q (cfs) 0 0. 00 3, 513 0. 82 12. 53 Between 0. 00 and 12. 53
Interpolate for Y 2. 2 S 2/Dt+Q 2 Y 2 Q 2 0. 00 2. 00 0. 16 h (ft) S (cu ft) Q (cfs) 2 S/Dt + Q (cfs) 0 0 0. 00 1 3, 513 0. 82 12. 53
Interpolate for Q 2. 2 S 2/Dt+Q 2 Y 2 Q 2 0. 00 2. 00 0. 13 h (ft) S (cu ft) Q (cfs) 2 S/Dt + Q (cfs) 0 0 0. 00 1 3, 513 0. 82 12. 53
For the first time interval: 0 to 10 minutes I 1=I(t=0)=0. 00 and I 2=I(t=10)=2. 00. I 1+I 2=0. 00+2. 00=2. 00. For the second time interval: 10 to 20 minutes I 1=I(t=10)=2. 00 and I 2=I(t=20)=6. 70. I 1+I 2=2. 00+6. 70=8. 70. First Dt Time Second Dt Inflow I 1+I 2 2 S 1/Dt-Q 1 2 S 2/Dt+Q 2 Y 2 Q 2 0 I 1= 0. 00 10 I 2= 2. 00 =I 1 2. 00 0. 00 2. 00 0. 16 0. 13 20 6. 70 =I 2 8. 70
Solve for the outflow, Q 2, at time=20 minutes. I 1=I(t=10)=2. 00 and I 2=I(t=20)=6. 70. I 1+I 2=2. 00+6. 70=8. 70. The value of 2 S 1/Dt - Q 1 at 20 minutes equals the value of 2 S 2/Dt + Q 2 at 10 minutes minus twice (2 times) the value of Q 2 at 10 minutes. 2 S 1/Dt - Q 1 =2. 00 – 2*0. 13 =1. 74 Per the routing equation: 2 S 2/Dt + Q 2 equals the sum of I 1 + I 2 and 2 S 1/Dt - Q 1, which is 8. 70 + 1. 74 = 10. 44. Time Inflow I 1+I 2 2 S 1/Dt-Q 1 2 S 2/Dt+Q 2 Y 2 Q 2 0 0. 00 10 2. 00 0. 00 2. 00 0. 16 0. 13 20 6. 70 8. 70 1. 74 10. 44
Check Your Values Time, min Inflow, cfs I 1+I 2 2 S 1/Dt-Q 1 2 S 2/Dt+Q 2 Y 2 Q 2 0 0. 00 10 2. 00 0. 00 2. 00 0. 16 0. 13 20 6. 7 8. 70 1. 74 10. 44 0. 83 0. 68 30 11. 4 18. 10 9. 07 27. 17 2. 00 1. 25 40 12. 9 24. 30 24. 68 48. 98 3. 20 1. 89 50 11. 1 23. 98 45. 19 69. 17 4. 11 3. 45