Polticas Pblicas em Alcohol Prof Dr Ronaldo Laranjeira

Políticas Públicas em Alcohol Prof. Dr. Ronaldo Laranjeira Universidade Federal de São Paulo

Chosing effective strategies • Need for a systematic procedure to evaluate the evidence, compare alternativa interventions and assess the fbenefits to society of different approaches

Proportion of alcohol consumers in WHO subregions

Drinking Pattern Values for Selected WHO Regions

12 leading selected risk factors as causes of disease burden measured in DALYs Developing countries High Mortality Low Mortality Developed countries 1 Underweight Alcohol (6. 2%) Tobacco (12. 2%) 2 Unsafe sex Blood pressure 3 Unsafe water Tobacco (4. 0%) Alcohol (9. 2%) 4 Indoor smoke Underweight Cholesterol 5 Zinc deficiency Body mass index 6 Iron deficiency Cholesterol Low fruit & veg intake 7 Vitamin A deficiency Low fruit & veg intake Physical inactivity 8 Blood pressure Indoor smoke - solid fuels Illicit drugs (1. 8%) 9 Tobacco (2. 0%) Iron deficiency Unsafe sex 10 Cholesterol Unsafe water Iron

World Deaths in 2000 attributable to selected leading risk factors Number of deaths (000 s)
 in 2000 attributable to selected leading risk factors Number of")
World Disease burden (DALYs) in 2000 attributable to selected leading risk factors Number of Disability-Adjusted Life Years (000 s)
 in 2000 attributable to Addictive Substances related Risks Number of")
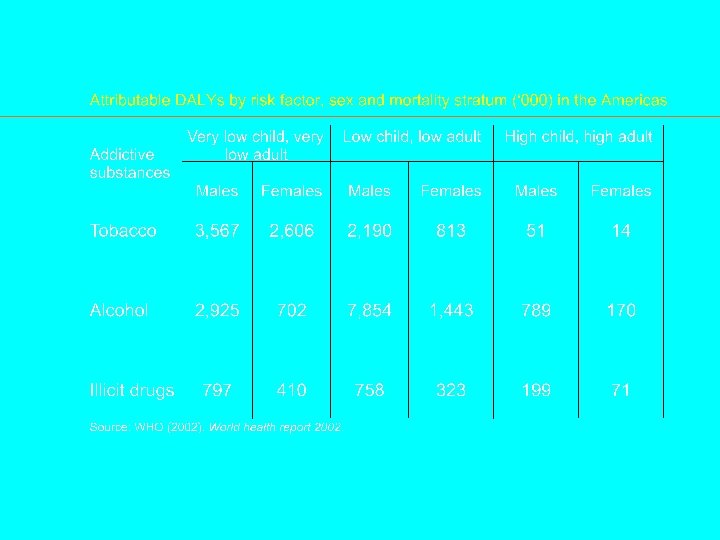
World Disease burden (DALYs) in 2000 attributable to Addictive Substances related Risks Number of Disability-Adjusted Life Years (000 s)

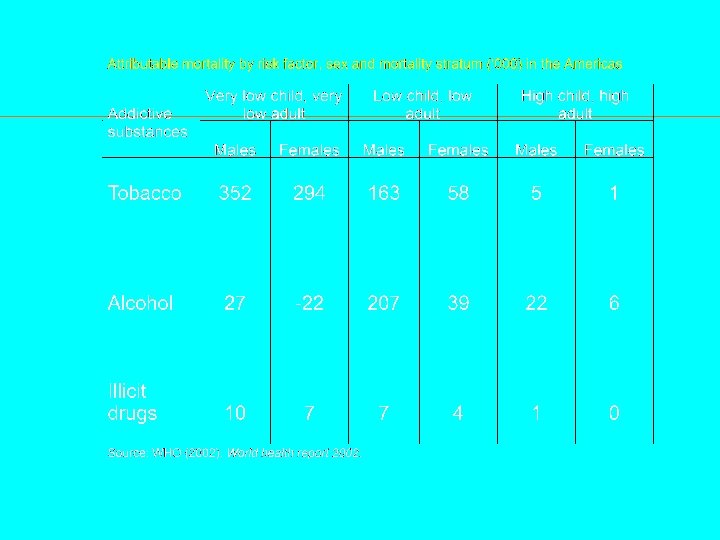
World Deaths in 2000 attributable to Addictive Substances related Risks Number of deaths (000 s)

World Deaths in 2000 attributable to Addictive Substances related Risks Number of deaths (000 s)
 Deaths in 2000 attributable to selected leading")
WHO Regions Number of deaths (000 s) Deaths in 2000 attributable to selected leading risk factors
 Disease burden (DALYs) in 2000")
WHO Regions Number of Disability-Adjusted Life Years (000 s) Disease burden (DALYs) in 2000 attributable to selected leading risk factors

Burden of disease attributable to addictive substances related risks: ALCOHOL (% DALYs in each subregion) Proportion of DALYs attributable to selected risk factor <0. 5 % 0. 5 -0. 9% 1 -1. 9% 2 -3. 9% 4 -7. 9% 8 -15. 9%

Burden of disease attributable to addictive substances related risks: TOBACCO (% DALYs in each subregion) Proportion of DALYs attributable to selected risk factor <0. 5 % 0. 5 -0. 9% 1 -1. 9% 2 -3. 9% 4 -7. 9% 8 -15. 9%

Burden of disease attributable to addictive substances related risks: ILLICIT DRUGS (% DALYs in each subregion) Proportion of DALYs attributable to selected risk factor <0. 5 % 0. 50. 9% 1 -1. 9% 2 -3. 9%

Conclusions • The burden of licit and illicit drug problems is increasingly evident. • From a public health perspective tobacco and alcohol use carry much higher burdens that illicit drug use. • Alcohol and drug polices need to address the relative harms of these substances. • In the management of psychoactive substance problems (prevention and treatment) more attention should be paid to epidemiologic evidence and developments in neuroscience.

WHO’s Comparative Risk Assessment Collaborating Group • 27 groups: – Core, metholodology, etc. Group – 26 risk factor groups • Alcohol group: – J Rehm, R Room, M Monteiro, G Gmel, K Graham, N Rehn, C T Sempos, U Frick, D Jernigan

Patterns of drinking • Countries assigned hazardous drinking scores, a numeric indicator of hazard per litre of alcohol consumed • Information drawn from research literature supplemented by key informant questionnaires • Applied to two areas: injuries and CHD.

Dimensions of patterns of drinking • High usual quantity of alcohol per occasion • Festive drinking common – at fiestas or community celebrations • Proportion of drinking occasions when drinkers get drunk • Low proportion of drinkers who drink daily or nearly daily • Less common to drink with meals • Common to drink in public places
 Patterns of drinking 1. 00 to 2.")
Pattern of drinking 2000 (based on CRA) Patterns of drinking 1. 00 to 2. 50 to 3. 00 to 4. 00
 for different conditions Volume")
Aspects of alcohol used in estimating alcohol attributable fraction (AAF) for different conditions Volume of drinking Alcoholattributable conditions* Physical diseases (except CHD) *AAF = 1 by definition Drinking pattern hazard score (predominance of intoxication) Coronary heart disease Injuries Prior alcohol dependence Depression

Alcohol-related disorders • Chronic disease: – Conditions arising during perinatal period*: low birth weight – Cancer*: lip & oropharyngeal cancer, esophageal cancer, liver cancer, laryngeal cancer, female breast cancer – Neuropsychiatric diseases: alcohol use disorders, unipolar major depression, epilepsy – Diabetes* – Cardiovascular diseases: hypertension, coronary heart disease, stroke – Gastrointestinal diseases*: liver cirrhosis • Injury: – Unintentional injury: motor vehicle accidents, drownings, falls, poisonings, other unintentional injuries – Intentional injury: self-inflicted injuries, homicide, other intentional injuries * AAF based on volume of drinking only

Estimating AAFs 1. 2. 3. 4. 5. Alcohol-specific categories Chronic health conditions CHD Depression Injuries

Alcohol-related global burden of disease Alcohol-attributable mortality 0. 35 to 1. 00 to 4. 00 to 6. 00 to 8. 00 to 20. 00
 in emerging and established economies (% total")
Leading risk factors for disease (WHR 2002) in emerging and established economies (% total DALYS) Developing countries High mortality Developed countries Low mortality Underweight 14. 9 % Alcohol 6. 2 % Tobacco 12. 2 % Unsafe sex 10. 2 % Blood pressure 5. 0 % Blood pressure 10. 9 % Unsafe water & sanitation 5. 5 % Tobacco 4. 0 % Alcohol 9. 2 % Indoor smoke (solid fuels) 3. 6 % Underweight 3. 1 % Cholesterol 7. 6 % Zinc deficiency 3. 2 % Body mass index 2. 7 % Body mass index 7. 4 % Iron deficiency 3. 1 % Cholesterol 2. 1 % Low fruit & vegetable 3. 9 % intake Vitamin A deficiency 3. 0 % Low fruit & vegetable intake 1. 9 % Physical inactivity 3. 3 % Blood pressure Indoor smoke from solid fuels 1. 9 % Illicit drugs 1. 8 % 2. 5 %
 attributable to alcohol by major disease categories")
Global mortality burden (deaths in 1000 s) attributable to alcohol by major disease categories - 2000 Males Female s Total % of all alcoholattributable deaths 2 1 3 0% Malignant neoplasm 269 86 355 20% Neuro-psychiatric conditions 91 19 111 6% Cardiovascular diseases Other non-communicable diseases (diabetes, liver cirrhosis) Unintentional injuries 392 -124 268 15% 193 49 242 13% 484 92 577 32% Intentional injuries 206 42 248 14% Alcohol-related mortality burden all causes 1, 638 166 1, 804 100. 0% All deaths 29, 232 26, 629 55, 861 % of all deaths which are alcohol-attributable 5. 6% 0. 6% 3. 2% In comparison: estimate for Disease conditions Conditions arising during the perinatal period 1990: 1. 5%
 attributable to alcohol by major disease")
Global burden of disease (DALYs in 1000 s) attributable to alcohol by major disease categories - 2000 Males Female s Total % of all alcoholattributable DALYs 68 55 123 0% Malignant neoplasm 3, 180 1, 021 4, 201 7% Neuro-psychiatric conditions 18, 090 3, 814 21, 904 38% Cardiovascular diseases Other non-communicable diseases (diabetes, liver cirrhosis) Unintentional injuries 4, 411 -428 3, 983 7% 3, 695 860 4, 555 8% 14, 008 2, 487 16, 495 28% Intentional injuries 5, 945 1, 117 7, 062 12% Alcohol-related disease burden all causes (DALYs) 49, 397 8, 926 58, 323 100% All DALYs 755, 176 689, 993 1, 445, 1 69 6. 5% 1. 3% 4. 0% Disease conditions Conditions arising during the perinatal period % of all DALYs which are alcohol-attributable In comparison: estimate for 1990: 3. 5%

Future Increase in alcohol-related burden for two reasons: – The disease categories related to alcohol are relatively increasing: chronic disease, accidents and injuries – Alcohol consumption is increasing in the most populous parts of the world – Patterns are stable if not getting worse If there are no interventions!!!

WORKING IN EUROPE FOR THE PREVENTION OF ALCOHOL RELATED HARM Global Alcohol Policy

WORKING IN EUROPE FOR THE PREVENTION OF ALCOHOL RELATED HARM Declarations of interest Ø Used to be Regional Advisor for both alcohol and tobacco policy, WHO Regional Office for Europe Ø Scientist and policy advisor for Eurocare

WORKING IN EUROPE FOR THE PREVENTION OF ALCOHOL RELATED HARM Structure of presentation 1. Eurocare 2. The problem of alcohol 3. Some solutions for alcohol policy 4. Expectations of the WHO 5. What NGOs can bring

Brief Description of Eurocare: F Eurocare was formed in 1990 as an alliance of non-governmental organisations concerned with the impact of the European Union on alcohol policy in Member States F Starting with 9 member organisations in 1990, it now has 46 members from 12 EU States, 5 non EU States and 3 International

Brief Description of Eurocare: F Eurocare promotes the implementation of evidence based alcohol policy and provides support to its member organizations F Key publications include: FAlcohol problems and the family, 1998 FThe beverage alcohol industry’s social aspects organizations: A

Brief Description of Eurocare: F Eurocare will be implementing a 3 year European Commission funded project (Alcohol Policy Network in the Context of a larger Europe: Bridging the Gap): F Creating an alcohol policy network in 27 European Member States and applicant countries, Norway and Switzerland F Preparing a report on alcohol in Europe F Preparing an advocacy training manual F Convening a European conference, Bridging the Gap, Warsaw, Poland, 16 -19 June 2004 F Convening two summer advocacy schools,

WORKING IN EUROPE FOR THE PREVENTION OF ALCOHOL RELATED HARM

WORKING IN EUROPE FOR THE PREVENTION OF ALCOHOL RELATED HARM These are net costs, accounting for heart disease They do not include social harms They do not include financial costs

WORKING IN EUROPE FOR THE PREVENTION OF ALCOHOL RELATED HARM

WORKING IN EUROPE FOR THE PREVENTION OF ALCOHOL RELATED HARM

WORKING IN EUROPE FOR THE PREVENTION OF ALCOHOL RELATED HARM

WORKING IN EUROPE FOR THE PREVENTION OF ALCOHOL RELATED HARM At the community level: Ø Drinking and driving Ø Intoxication

WORKING IN EUROPE FOR THE PREVENTION OF ALCOHOL RELATED HARM WHO Region % dependent on alcohol North and Central Africa 0. 7 Southern Africa 1. 6 North America 5. 1 Latin America 3. 5 South America 3. 2 Middle East 0. 0 Western Asia 0. 0 Western Europe 3. 4 Central Europe 0. 8 Caucasus and Central Asia 0. 2 Former Soviet Union 4. 8 South-East Asia 0. 4

WORKING IN EUROPE FOR THE PREVENTION OF ALCOHOL RELATED HARM Healthy Public Policy: ü Taxation ü Bans on advertising and marketing

WORKING IN EUROPE FOR THE PREVENTION OF ALCOHOL RELATED HARM Strengthening Community Action: ü Drink driving ü Educational and prevention programmes ü Manage availability

WORKING IN EUROPE FOR THE PREVENTION OF ALCOHOL RELATED HARM Helping individuals: ü Brief interventions in primary care ü Treatment for dependence

WORKING IN EUROPE FOR THE PREVENTION OF ALCOHOL RELATED HARM What can WHO (and its MS) do? Match resources to the size of the problem The purpose of alcohol policy is to reduce the harm done by alcohol. The greater the harm, the greater the need for policy. 4% of GBD; 5 th in list of risk factors

WORKING IN EUROPE FOR THE PREVENTION OF ALCOHOL RELATED HARM What can WHO (and its MS) do? There is a strong team But, it seems divided and unclear at present

WORKING IN EUROPE FOR THE PREVENTION OF ALCOHOL RELATED HARM What can WHO (and its MS) do? Strong Regional Offices Seems a posteriority rather than a priority

WORKING IN EUROPE FOR THE PREVENTION OF ALCOHOL RELATED HARM What can WHO (and its MS) do? Need a simple metric (like a billion deaths from smoking) Globally, every drinker loses on average 11 days of healthy life per year.

WORKING IN EUROPE FOR THE PREVENTION OF ALCOHOL RELATED HARM What can WHO (and its MS) do? Do we need a FCAC? Or some other mechanism to mobilize action?

WORKING IN EUROPE FOR THE PREVENTION OF ALCOHOL RELATED HARM What can WHO (and its MS) do? Make the science clear

WORKING IN EUROPE FOR THE PREVENTION OF ALCOHOL RELATED HARM What can WHO (and its MS) do? Calculate the economic burden

WORKING IN EUROPE FOR THE PREVENTION OF ALCOHOL RELATED HARM What can WHO (and its MS) do? Estimate the social burden

WORKING IN EUROPE FOR THE PREVENTION OF ALCOHOL RELATED HARM What can WHO (and its MS) do? Get some powerful partners (? World Bank)

WORKING IN EUROPE FOR THE PREVENTION OF ALCOHOL RELATED HARM What can WHO (and its MS) do? In dealing with the alcohol industry, ENSURE that WHO sticks to its guidelines

WORKING IN EUROPE FOR THE PREVENTION OF ALCOHOL RELATED HARM What can WHO (and its MS) do? Disseminate and implement these guidelines throughout: The organization The Regional Offices The Collaborating centres The country offices

WORKING IN EUROPE FOR THE PREVENTION OF ALCOHOL RELATED HARM What can WHO (and its MS) do? The industry argues that they have a place at the policy table. They don’t.

WORKING IN EUROPE FOR THE PREVENTION OF ALCOHOL RELATED HARM What can WHO (and its MS) do? The industry argues that they are a public health body. They are not.

WORKING IN EUROPE FOR THE PREVENTION OF ALCOHOL RELATED HARM What can WHO (and its MS) do? Don’t be duped by the alcohol industry and their social aspects organizations.

Price and the availability of alcohol Effective policy Ineffective policy Opposed by Supported by social aspects organizations X X Taxation Negative elasticities between price of alcohol and cirrhosis, fatal and non-fatal traffic accidents and intentional injuries (as price goes up, harm goes down)1 Takes the view that taxation has no impact on alcohol-related harm; takes the view that the solution to the problem of misuse does not lie in restrictions which penalize everyone for the mistakes of a minority 3 Legal drinking age Increased drinking ages reduce traffic fatalities; reduced drinking ages lead to increases in assaults 2 Suggests that there is no consensus as to whether or not minimal drinking ages are desirable 4 ; opposed to increasing legal drinking ages believing that it does not address those who abuse the product 3

Creating safer drinking environments Effective policy Ineffective policy Physical environment Changing the physical environment of drinking places reduces alcohol related violence 1 Social environment Decreasing the permissiveness of the environment (better staff control; less discount drinks) reduces alcohol-related violence 1 Server training with legal sanctions Responsible server programs Opposed by Supported by social aspects organizations X X Takes the position that the vast majority of drinking episodes do not involve violence, and most violence does not involve drinking, but recognizes that in some individuals and groups, a pattern of behaviour may include both abusive drinking and violence; offers no concrete proposals 2 Opposed to legal sanctions; accepts that server training leads to a .

Prevention and education programmes Effective policy Opposed by Supported by social aspects organizations X Ineffective policy Community action based on both environmental and educational approaches Comprehensive locally based community prevention programs have led to 10% reductions in alcohol involved car crashes, 25% reductions in fatal crashes and 43% reductions in alcohol related violence 1 Locally based community prevention programs based only on educational approaches Have limited or no effect 1 X Opposed to environmental approaches, believing that they do not address those who abuse the product. Describes school based alcohol education, and drink driving education programmes as community based programmes 6

Drink driving programmes Effective policy Opposed by Supported by social aspects organizations X Ineffective policy X X Legal drinking age Increased drinking age in US reduced traffic accidents by 5%-28%1 Suggests that there is no consensus as to whether or not minimal drinking ages are desirable 2; opposed to increasing legal drinking ages believing that it does not address those who abuse the product (i. e. drink driving) 3 Regulating the conditions of sale Extending trading hours increases traffic accidents; targeted programmes at high risk premises reduce accidents 1 Believes that programmes that restrict days and hours of sale are ineffective and do not go to the heart of the problem of alcohol-related accidents; opposed to restricting days and hours of sale believing that they do not X

WORKING IN EUROPE FOR THE PREVENTION OF ALCOHOL RELATED HARM What can WHO (and its MS) do? There cannot be common ground on drinking and driving

WORKING IN EUROPE FOR THE PREVENTION OF ALCOHOL RELATED HARM Eurocare recommendation: 6. Because of limited evidence for their effectiveness in reducing drinking and driving, public education efforts to persuade drinkers not to drive after drinking, programmes to encourage servers to prevent intoxicated individuals from driving, and organized efforts to make provisions for alternative transportation should not be the main cornerstones of drinking and driving policy.

WORKING IN EUROPE FOR THE PREVENTION OF ALCOHOL RELATED HARM What can WHO (and its MS) do? There should be no discussion on self -regulation

We should not waste any more time on self-regulation F It serves the needs of the industry F The reality is based on complaints rather than compliance F The advertisements still go ahead anyway F There is no enforcement F It is not independent, and reflects the ‘intentions’ of the advertisers F Does not reflect the marketing to young people

WORKING IN EUROPE FOR THE PREVENTION OF ALCOHOL RELATED HARM What can WHO (and its MS) do? The Smirnoff day off speaks much louder to politicians than all the research

WORKING IN EUROPE FOR THE PREVENTION OF ALCOHOL RELATED HARM What can WHO (and its MS) do? Encourage litigation

WORKING IN EUROPE FOR THE PREVENTION OF ALCOHOL RELATED HARM What can WHO (and its MS) do? Policy Action Plans: ü Globally ü Regionally ü Country wide ü Regional ü Local

WORKING IN EUROPE FOR THE PREVENTION OF ALCOHOL RELATED HARM What can WHO (and its MS) do? Community Action Database of community programmes

WORKING IN EUROPE FOR THE PREVENTION OF ALCOHOL RELATED HARM What can WHO (and its MS) do? Health sector Be clear and consistent on nomenclature (ICD 10) Promote brief interventions Reorient health care

WORKING IN EUROPE FOR THE PREVENTION OF ALCOHOL RELATED HARM What can the NGO sector do? We are your friends; But also your watchdog

WORKING IN EUROPE FOR THE PREVENTION OF ALCOHOL RELATED HARM What can the NGO sector do? Support you in any or all of the above Promote and disseminate the science that empowers alcohol policy Develop advocacy and promote advocacy skills Monitor the alcohol industry

WORKING IN EUROPE FOR THE PREVENTION OF ALCOHOL RELATED HARM What can the NGO sector do? And do we write formally to the WHO after this consultation, or what?

WORKING IN EUROPE FOR THE PREVENTION OF ALCOHOL RELATED HARM Thank you for your attention

Alcohol in Development and in Health and Social Policy David Jernigan Ph. D Center on Alcohol Marketing and Youth Georgetown University Washington, D. C. dhj@georgetown. edu Robin Room Ph. D Center for Social Research on Alcohol and Drugs University of Stockholm, Sweden Jürgen T. Rehm Ph. D Addiction Research Institute Zurich, Switzerland

Presentation Overview • To what extent is alcohol harmful or beneficial to health and social well-being? • • • Alcohol’s role in the global burden of disease Alcohol and social harms Relationship between alcohol production, consumption, benefits and problems Monitoring alcohol problems Preventing and reducing alcohol problems

WHO’s Comparative Risk Assessment Collaborating Group • 27 groups: – Core, metholodology, etc. group – 26 risk factor groups • Alcohol group: – J Rehm, R Room, M Monteiro, G Gmel, K Graham, N Rehn, C T Sempos, U Frick, D Jernigan
 • • Childhood and maternal undernutrition: underweight, iron deficiency,")
WHO’s Comparative Risk Assessment (CRA) • • Childhood and maternal undernutrition: underweight, iron deficiency, vitamin A deficiency, zinc deficiency; Other diet-related risks and physical inactivity: blood pressure, cholesterol, overweight, low fruit and vegetable intake, physical inactivity; Sexual and reproductive health risks: unsafe sex, lack of contraception; Addictive substance use: tobacco, alcohol, illicit drugs; Environmental risks: unsafe water, sanitation and hygiene, urban air pollution, indoor smoke from solid fuels, lead exposure, climate change; Occupational risks: risk factors for injury, carcinogens, airborne particulates, ergonomic stressors, noise; Other selected risks to health: unsafe health care injections, childhood sexual abuse.

The epidemiological model Attributable fractions Defined as: With a given outcome exposure factor, and population, the attributable fraction is the proportion by which the incidence rate of the outcome would be reduced if the distribution of exposure would change to an alternative distribution: “When an exposure is believed to be a cause of a given disease, the attributable fraction is the proportion of the disease in the specific population that would be eliminated in the absence of the exposure. ” = f(prevalence, pattern weight, relative risk) Four drinking categories (old English et al. terminology: abstainer, moderate, hazardous, harmful) are distinguished. Prevalence for all four categories are taken from surveys Steps to derive at pattern weight: 1. Determine pattern value from survey of key informants, and/or survey data where available. 2. Conduct hierarchical linear analyses on mortality using per capita consumption gross -national product, year (level 1 variables) and pattern values (level 2 variable) as determining factors (separate by age and sex). 3. Construct pattern weight based on intercept and regression weight for patterns. Relative Risk estimates for each drinking category are either taken directly from metaanalyses (chronic diseases) or indirectly from meta-analyses of attributable fractions (injuries)

Prevalence data • Adult per capita consumption estimates for countries totaling 90% of world’s population • Survey data from 69 countries, covering 80% of world’s population • Survey and adult per capita consumption data for more than 50% of countries
")
Adult per capita consumption in litre pure alcohol 2000 (based on CRA)

Patterns of drinking • Countries assigned hazardous drinking scores, a numeric indicator of hazard per litre of alcohol consumed • Information drawn from research literature supplemented by key informant questionnaires • Applied to two areas: injuries and CHD.

Dimensions of patterns of drinking • High usual quantity of alcohol per occasion • Festive drinking common – at fiestas or community celebrations • Proportion of drinking occasions when drinkers get drunk • Low proportion of drinkers who drink daily or nearly daily • Less common to drink with meals • Common to drink in public places
 Patterns of drinking 1. 00 to 2.")
Pattern of drinking 2000 (based on CRA) Patterns of drinking 1. 00 to 2. 50 to 3. 00 to 4. 00
 for different conditions Volume")
Aspects of alcohol used in estimating alcohol attributable fraction (AAF) for different conditions Volume of drinking Alcoholattributable conditions* Physical diseases (except CHD) *AAF = 1 by definition Drinking pattern hazard score (predominance of intoxication) Coronary heart disease Injuries Prior alcohol dependence Depression

Estimating AAFs 1. 2. 3. 4. 5. Alcohol-specific categories Chronic health conditions CHD Depression Injuries

Alcohol-related disorders • Chronic disease: – Conditions arising during perinatal period*: low birth weight – Cancer*: lip & oropharyngeal cancer, esophageal cancer, liver cancer, laryngeal cancer, female breast cancer – Neuropsychiatric diseases: alcohol use disorders, unipolar major depression, epilepsy – Diabetes* – Cardiovascular diseases: hypertension, coronary heart disease, stroke – Gastrointestinal diseases*: liver cirrhosis • Injury: – Unintentional injury: motor vehicle accidents, drownings, falls, poisonings, other unintentional injuries – Intentional injury: self-inflicted injuries, homicide, other intentional injuries * AAF based on volume of drinking only

Estimating AAFs: 5. Alcohol-attributable depression • • • Started with estimated rates of alcohol dependence in each region (derived from pooled psychiatric epidemiological studies) Used some of same studies to derive proportion of cases with both depression and alcohol problems where alcohol onset was prior to onset of depression Regressed these proportions on rates of alcohol dependence to establish upper-limit estimates To eliminate effect of co-occurrences due to chance, rate of alcohol use disorders then subtracted from these estimates Finally, halved AAFs to account for lack of control of confounders

Alcohol-related global burden of disease Alcohol-attributable mortality 0. 35 to 1. 00 to 4. 00 to 6. 00 to 8. 00 to 20. 00
 attributable to alcohol by major disease categories")
Global mortality burden (deaths in 1000 s) attributable to alcohol by major disease categories - 2000 Males Female s Total % of all alcoholattributable deaths 2 1 3 0% Malignant neoplasm 269 86 355 20% Neuro-psychiatric conditions 91 19 111 6% Cardiovascular diseases Other non-communicable diseases (diabetes, liver cirrhosis) Unintentional injuries 392 -124 268 15% 193 49 242 13% 484 92 577 32% Intentional injuries 206 42 248 14% Alcohol-related mortality burden all causes 1, 638 166 1, 804 100. 0% All deaths 29, 232 26, 629 55, 861 % of all deaths which are alcohol-attributable 5. 6% 0. 6% 3. 2% In comparison: estimate for Disease conditions Conditions arising during the perinatal period 1990: 1. 5%
 attributable to alcohol by major disease")
Global burden of disease (DALYs in 1000 s) attributable to alcohol by major disease categories - 2000 Males Female s Total % of all alcoholattributable DALYs 68 55 123 0% Malignant neoplasm 3, 180 1, 021 4, 201 7% Neuro-psychiatric conditions 18, 090 3, 814 21, 904 38% Cardiovascular diseases Other non-communicable diseases (diabetes, liver cirrhosis) Unintentional injuries 4, 411 -428 3, 983 7% 3, 695 860 4, 555 8% 14, 008 2, 487 16, 495 28% Intentional injuries 5, 945 1, 117 7, 062 12% Alcohol-related disease burden all causes (DALYs) 49, 397 8, 926 58, 323 100% All DALYs 755, 176 689, 993 1, 445, 1 69 6. 5% 1. 3% 4. 0% Disease conditions Conditions arising during the perinatal period % of all DALYs which are alcohol-attributable In comparison: estimate for 1990: 3. 5%
 attributable to ten leading risk factors, 2000 World DALYs (millions)")
Disability-Adjusted life Years (DALYs) attributable to ten leading risk factors, 2000 World DALYs (millions) High mortality developing countries Low mortality developing countries Developed countries % total Males Females Underweight 138 9. 5 14. 9 15 3 3. 3 0. 4 Unsafe sex 92 6. 3 9. 4 11 1. 2 1. 6 0. 5 1. 1 Blood pressure 64 4. 4 2. 6 2. 4 4. 9 5. 1 11. 2 10. 6 Tobacco 59 4. 1 3. 4 0. 6 6. 2 1. 3 17. 1 6. 2 Alcohol 58 4 2. 6 0. 5 9. 8 2 14 3. 3 Unsafe water, sanitation, hygiene 54 3. 7 5. 5 5. 6 1. 7 1. 8 0. 4 Cholesterol 40 2. 8 1. 9 2. 2 2 8 7 Indoor smoke from solid fuels 39 2. 6 3. 7 3. 6 1. 5 2. 3 0. 2 0. 3 Iron deficiency 35 2. 4 2. 8 3. 5 1. 5 2. 2 0. 5 1 Overweight 33 2. 3 0. 6 1 2. 3 3. 2 6. 9 8. 1
 in emerging and established economies (% total")
Leading risk factors for disease (WHR 2002) in emerging and established economies (% total DALYS) Developing countries High mortality Developed countries Low mortality Underweight 14. 9 % Alcohol 6. 2 % Tobacco 12. 2 % Unsafe sex 10. 2 % Blood pressure 5. 0 % Blood pressure 10. 9 % Unsafe water & sanitation 5. 5 % Tobacco 4. 0 % Alcohol 9. 2 % Indoor smoke (solid fuels) 3. 6 % Underweight 3. 1 % Cholesterol 7. 6 % Zinc deficiency 3. 2 % Body mass index 2. 7 % Body mass index 7. 4 % Iron deficiency 3. 1 % Cholesterol 2. 1 % Low fruit & vegetable 3. 9 % intake Vitamin A deficiency 3. 0 % Low fruit & vegetable intake 1. 9 % Physical inactivity 3. 3 % Blood pressure Indoor smoke from solid fuels 1. 9 % Illicit drugs 1. 8 % 2. 5 %

Alcohol-related social harms • Child abuse – 8. 6%-63% • Domestic violence – 26%-76% • Family budget – 1%-11% overall – Greater for families with frequent drinkers • E. g. Delhi – 24% of budgets of families with frequent drinkers • Problems for youth: – Criminal behavior – Failure to achieve educational qualifications

Measuring social harms 1. Cost of illness studies • E. g. Scotland: » » » 2. Service system utilization by “problem drinkers” • California urban/suburban/rural county » » » 3. Health care costs $139 million Social work costs $125 million Criminal justice and fire costs $390 million 41% in criminal justice system 8% in social welfare system 42% in general health care system 3% in public mental health system 6% in public alcohol or drug treatment system Survey research • Canada – harms from someone else’s drinking » » » 7. 2% pushed, hit or assaulted 6. 2% friendships harmed 7. 7% family or marriage difficulties

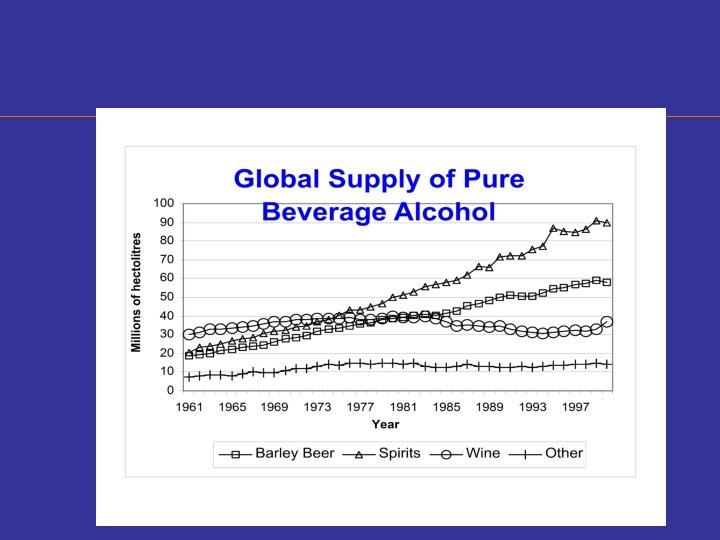
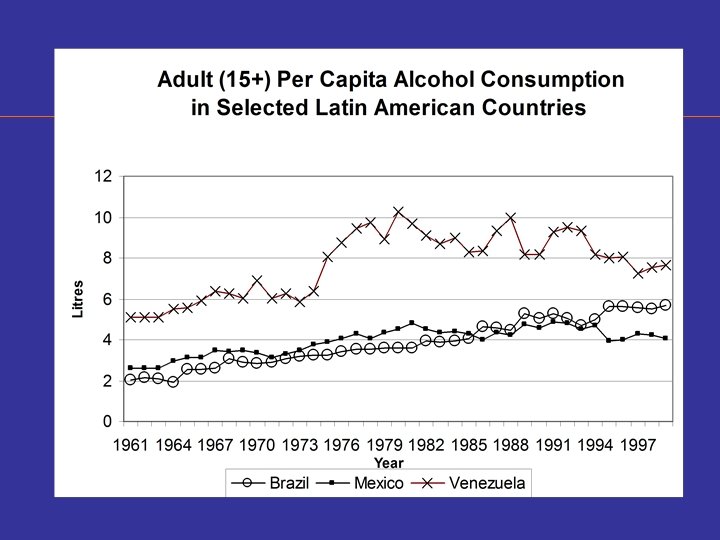
Trends in alcohol consumption

Relationship between alcohol production and consumption • Alcohol production and consumption – Most alcohol consumed near point of production • 8% of recorded alcohol production enters into international trade – Consumption tends to be concentrated in minority of population, e. g. • USA: 10% drinks 61% of the alcohol • New Zealand: 5% drinks 1/3 of the alcohol

Relationship between alcohol consumption and alcohol problems • Alcohol problems arise from: – Intoxication occasions – Repeated episodes of intoxication – Steady heavy drinking • Protective effect from consistent moderate drinking – This pattern rare in developed countries, even less common in developing societies • Bottom line: level of alcohol problems in a society will tend to rise with level of alcohol consumption

Social and health benefits of drinking • Social benefits of drinking largely unquantifiable – Alcohol’s role as integrative, bonding or socially lubricative substance • Health benefits of alcohol – Protective effect for CHD evident at individual level at as low as one drink every other day – Protection not found at the aggregate level • Could be some drinkers shift to more heart-healthy pattern, as others change to more dangerous patterns – Leads to conclusion that there are no net benefits at the population level from any policy that seeks to increase alcohol consumption

Alcohol and development • Alcohol consumption tends to rise with economic development, absent mitigating factors (e. g. religion) • Four modes of production of alcohol: – – Traditional/indigenous Industrialized traditional/indigenous Industrialized cosmopolitan Globalized cosmopolitan • Trend is towards the latter, particularly in distilled spirits and beer

Alcohol and development: benefits? • Employment and income generation – Direct employment declines with industrialization – Indirect employment may increase in wholesaling and distribution, but less likely in retail sector • Government revenue – justifiable for: – Economic efficiency – correct for negative externalities – Public health – reduce consumption – Revenue raising – as high as 24% of some state revenues

Alcohol and development: benefits? • Quality improvement – Industrialization leads to greater uniformity and reliability of product • Sourcing of inputs and balance of payment issues – Import substitution constrained by size of domestic market – also may require import of inputs as opposed to finished product – Alcohol unlikely to make much contribution to exports

Alcohol and development: benefits? • MNCs and technology transfer – “Turnkey” technologies increasing – Design, R&D and engineering expertise remains in headquarters countries • Encouragement of packaging and distribution networks • Early form of foreign direct investment – If increased alcohol supply will not worsen public health and safety situation regarding alcohol

Preventive interventions: individual-based • Education and persuasion – Little evidence of effectiveness of schoolbased programs beyond the short-term – Media campaigns unlikely to change behavior, but may increase support for more effective policies • Deterrence – Effective in reducing drinking-driving – Speed and certainty of punishment crucial to effectiveness

Preventive interventions: individual-based • Encouraging alternatives – Little evidence of effectiveness of lasting effects – Too many alternatives go well with alcohol, e. g. soft drinks – Do contribute to improving quality of life for disadvantaged populations • Treatment and mutual help – Part of a humane societal response – Brief interventions, self-help effective and result in net savings in social and health costs – Treatment alone is not a cost-effective means of reducing alcohol-related problems

Preventive interventions: environmentally-based • Insulating use from harm – Server and manager training can reduce drinking-driving, violence – Provision of public transport, relocation of drinking places away from residences can also be effective – General protections, e. g. airbags, sidewalks, are effective – “Designated driver” programs lack evidence of effectiveness

Preventive interventions: environmentally-based • Regulating availability, conditions of use – Prohibitions • Difficult to enforce – Minimum-age drinking laws (partial prohibition) • Effective if enforced – Taxation and other price increases • Demand for alcohol generally inelastic • Can be effective if market is under control

Preventive interventions: environmentally-based • Regulating availability, conditions of use – Limiting sales outlets, hours and conditions of sale • Research literature shows effectiveness of measures making alcohol purchase less convenient – Monopolies on production or sale • Retail monopolies have greater public health effects • Production monopolies assist in control of market – Production restrictions • Can be effective but difficult to enforce – Limits on advertising and promotion • Some evidence bans are effective • “Unmeasured” activities increasing, and difficult to regulate

Other policy concerns • Social and religious movements, civil society and NGOs can be key • Alcohol policy needs to be societal, integrated and consistent • International trade agreements need to make exception for alcohol as “no ordinary commodity”
 • Number of abstainers:")
Monitoring alcohol consumption • Per capita alcohol consumption (age 15+) • Number of abstainers: • Pattern of drinking: – frequency of getting drunk or drinking >60 grams of ethanol (5+ drinks), – usual quantity per drinking session, – fiesta drinking, – drinking in public places, – not drinking with meals, and not drinking daily – frequencies and percentages of all alcohol drunk on >40 g. days for men and >20 g. days for women • Youth use

Monitoring alcohol problems • alcohol-involved traffic crashes/injuries • alcohol-involved crimes • hospitalizations and deaths from strongly alcoholinvolved causes: – liver disease (if rates of hepatitis B and C are low), – alcohol-specific causes such as alcoholic liver disease, alcohol dependence, and alcoholic psychosis • other alcohol-related problems: – problems with family, friendships, work, police, financial, health, alcohol dependence • problems from others’ drinking: – family, friendships, work, injury, property loss, public nuisance

The Future Increase in alcohol-related burden for two reasons: – The disease categories related to alcohol are relatively increasing: chronic disease, accidents and injuries – Alcohol consumption is increasing in the most populous parts of the world – Patterns are stable if not getting worse If there are no interventions!!!
 • Of the 32 interventions and strategies evaluated, 16 are")
Target groups (cont. ) • Of the 32 interventions and strategies evaluated, 16 are targeted at the GP, 12 at HR, and 4 at HD. • Interventions directed at the general population have higher effectiveness ratings thatn those targeted at other groups. • Interventions directed at the general population and high-risk groups tend to be less costly to implement and maintain than interventions with harmful drinkers

Table 16. 1. Ratings of policy-relevant stategies and interventions Strategy Effectiveness Breadth of research support Cross-cultural testing Cost to implement Target group Total ban on sales +++ ++ High GP Alcohol taxes +++ +++ Low GP Training bar staff against aggression + ++ Moderate HR Alcohol education in schools 0 +++ ++ High HR Random breath tests +++ ++ + Moderate GP Mandatory treatment of drinking-drivers + ++ + Moderate HD

Ratings of policy-relevant stategies and interventions – PHYSICAL AVAILABILITY Strategy Effectiveness Breadth of research support Cross-cultural testing Cost to implement Target group Total ban on sales +++ ++ High GP Minimum legal purchase age +++ ++ Low HR Government Monopoly +++ ++ Low GP Hours and days of sale restrictions ++ ++ ++ Low GP Restrictions on density of outlets ++ ++ Low GP Server Liability +++ + + Low TG

Ratings of policy-relevant stategies and interventions – ALTERING DRINKING CONTEXT Strategy Effectiveness Breadth of research support Cross-cultural testing Cost to implement Target group Outlet policy to not serve intoxicated patrons + ++ Moderate HR Training bar staff + + + Moderate HR Voluntary codes of bar practice 0 + + Low HR Enforcement of onpremise regulations and legal requirements ++ + ++ High HR 0 ++ + High GP ++ ++ + High GP Promoting alcohol free activities and events Community mobilization

Ratings of policy-relevant stategies and interventions – DRINKING-DRIVING Strategy Effectiveness Breadth of research support Cross-cultural testing Cost to implement Target group Sobriety check points ++ +++ Moderate GP Random breath test +++ ++ + Moderate GP Lowered BAC level +++ ++ Low GP License Suspension ++ ++ ++ Moderate HR Low BAC for young +++ ++ + Low HR Designated drivers and ride services 0 + + Moderate HR

Ratings of policy-relevant stategies and interventions – TREATMENT AND EARLY INTERVENTION Strategy Effectiv e-ness Breadth of research support Crosscultural testing Cost to implem ent Target group Brief intervention ++ +++ Moderat e HR Alcohol Problems Treatment + +++ High HD Self-help + + ++ Low HD Mandatory treatment of repeat drinking drivers + ++ + Moderat e HD

Ratings of policy-relevant stategies and interventions – EDUCATION AND PERSUATION Strategy Effectiv e-ness Breadth of research support Crosscultural testing Cost to implem ent Target group Alcohol education in schools 0 +++ ++ High HR College student education 0 + + High HR Public service messages 0 +++ ++ Moderat e GP Warning labels 0 + ++ Low GP

Ratings of policy-relevant stategies and interventions – REGULATING ALCOHOL PROMOTION Strategy Advertising Bans Advertising content controls Effecti Breadth Crossveof cultural ness researc testing h support Cost to imple ment Target group + ++ ++ Low GP 0 0 0 Moder ate GP

Ratings of policy-relevant stategies and interventions – TAXATION AND PRICING Strategy Effecti Breadth Crossveof cultural ness researc testing h support ALCOHOL +++ +++ TAXES Cost to imple ment Target group LOW GP

Integrated alcohol policies Our ratings suggest that a combination of pjysical availability limits at the general population level, certain drinking-driving countermeasures directed at all three target groups, and brief interventions directed at high-risk drinkers will offer the best value as the foundation for a comprehensive alcohol policy approach

The strong strategies • Availability restrictions • Taxation • Enforcement Good research support Applicable in most countries Relatively inexpensive to implement and sustain

Essential Elements of Effective Prevention of Alcohol Problems Policies and Laws Enforcement Prevention Public Support

Implementing Alcohol Control Strategies in Brazil A. Strengthen alcohol surveillance systems 1. Epidemiologic surveys: household, school, roadside, emergency room, special events, alcohol sales and service practices, industry marketing, etc. 2. Increase expertise in behavioral health research methods and analysis. 3. Create and staff a Brazilian alcohol research center and develop an integrative and multidisciplinary research strategy.

Alcohol is a drug which is: 1. Mind altering 2. Tolerance producing 3. Addictive These basic facts are not changed by alcohol industry advertising.

Drug “Capture” Rate Percent of Users Who Become Clinically Dependent Tobacco Heroin Cocaine Alcohol Stimulants Marijuana Source: National Comorbidity Survey Anthony, Warner, and Kessler 31. 9% 23. 1% 16. 7% 15. 4% 11. 2% 9. 1%
 Attribution Tobacco Worldwide Alcohol Illicit Drugs 4.")
Global Burden of Disease (Disability-Adjusted Life Years) Attribution Tobacco Worldwide Alcohol Illicit Drugs 4. 1% 4. 0% 0. 8% North America 8 - 15. 9% 4 - 7. 9% 2 - 3. 9% South America 2 - 3. 9% 8 - 15. 9% 1 - 1. 9% Source: World Health Report 2002 World Health Organization

Global Market – Alcohol Spirits Sales Exceed 2 Billion Cases Annually Country Case Volume China Russia India Brazil Japan United States Korea Thailand Germany France 725 million cases 350 249 195 176 135 79 76 60 37 Source: Mark Brown, President Sazerac Company, Inc. March 4, 2003

Product Categories – Alcohol Spirits Product Category Baijiu Vodka Whisky Cachaca Rum Brandy Shochu Soju Liqueurs Source: Case Volume 725 million cases 400 205 200 115 82 70 70 51 Mark Brown, President Sazerac Company, Inc. March 4, 2003

U. S. Economic Costs of ATOD Use, 1995 Total Costs = $415 Billion Sources: Harwood, Fountain, & Livermore, NIDA & NIAAA, 1998 Rice (unpublished) Institute for Health and Aging, UCSF, 1995

Most U. S. adults do not drink or drink infrequently. Frequency of Drinking Among U. S. Adults 21 and Older, 2002 (past 30 days) Number of Drinking Days Source: NSDUH, 2002

Most U. S. adults do not drink at a hazardous level. Drinking Patterns among U. S. Adults 21 and Older, 2002 (past 30 days) Source: NSDUH, 2002

Binge drinkers are 23% of the population, but consume 76% of the alcohol. U. S. Binge Drinkers, 2002 Source: NSDUH, 2002
 15")
Most young people do not drink. Drinking Among Youth, 2002 (past 30 days) 15 - to 17 -year-olds 10% Drinking occasions 18% 0 1 to 4 5 or more 72% Among the 28% of 15 -17 year olds who drink, 65% drank heavily at least once in the past month. Source: NSDUH, 2002

Strategy Options: 1. Personal change strategies – change people 2. Alcohol control strategies – control alcohol availability

Personal Change Strategies The U. S. has spent a fortune trying to “change people” through programs for adults, youth and children to: 1. Provide alcohol education 2. Change attitudes about drinking 3. Provide early intervention and treatment services for individuals with alcohol problems, and for their families

Research Evidence of Effectiveness: Personal Change Strategies 1. With few exceptions, these programs have not been effective in preventing societal alcohol problems. 2. As for the exceptions, these programs are too expensive to be implemented across society. 3. Despite this evidence, programs implementing personal change strategies are the most popular, most prevalent, and best funded prevention efforts in the U. S.

Alcohol Control Strategies: Essential Components • changes in social norms • policy interventions • deterrence and enforcement

Alcohol Control Strategies: The Role of Public Health Education in Changing Social Norms 1. Raise societal awareness and concern about alcohol problems. 2. Educate the society that these problems can be prevented. 3. Inform the society about specific policy controls and deterrence strategies that are effective. 4. Publicize successes.

Alcohol Control Strategies: Effective Public Health Education Strategies for Changing Social Norms 1. Rely on research epidemiology. 2. Develop a strategic plan to educate society incrementally and sequentially. 3. Stay on message. 4. Utilize mass media.

Sequence of U. S. Public Awareness of Alcohol Problems Pre 1960 -1970 -1980 -1990 -2000 - Duh – what problems? Addiction, public drunkenness, social disorder Youth drinking Drinking and driving, fetal alcohol effects Alcohol industry behavior Violence and crime?

Alcohol Control Strategies Policy Interventions • To prevent alcohol problems, policy interventions must focus on the Availability of alcohol. • Effective policies address the – Price – Place – Product – Promotion… …of alcohol products
 favoring alcohol policies designed to")
Percent of U. S. Population (18+ years of age) favoring alcohol policies designed to reduce alcohol problems among youth Proposed Policy Favor Strongly Favor Somewhat Oppose Strongly Increase alcohol tax by 5 cents to fund prevention programs 65. 0 16. 8 5. 7 12. 6 Restrict alcohol ads to make drinking less appealing to youth 52. 6 26. 0 10. 5 10. 8 Conduct compliance checks to reduce illegal sales to minors 46. 5 19. 0 9. 5 25. 0 Require registration of beer kegs 39. 9 21. 3 15. 3 23. 5 Source: Harwood, et al, 1998
 favoring restrictions on drinking in")
Percent of U. S. Population (18+ years of age) favoring restrictions on drinking in public locations Public location Ban drinking By permit only No restrictions Parks 63. 0 27. 3 9. 8 Concerts 51. 2 34. 1 14. 6 Beaches 53. 1 28. 7 18. 2 Stadiums/arenas 47. 8 29. 6 22. 6 Source: Harwood, et al, 1998

Impact of enforcement on alcohol-related traffic fatalities Percentage traffic fatalities related to alcohol (1977 -1999)

Essential Elements of Effective Prevention of Alcohol Problems Policies and Laws Enforcement Prevention Public Support

Implementing Alcohol Control Strategies in Brazil A. Strengthen alcohol surveillance systems 1. Epidemiologic surveys: household, school, roadside, emergency room, special events, alcohol sales and service practices, industry marketing, etc. 2. Increase expertise in behavioral health research methods and analysis. 3. Create and staff a Brazilian alcohol research center and develop an integrative and multidisciplinary research strategy.

Every Ounce of Alcohol Sold in the United States Generates $2. 25 in Public Sector Costs Alcohol Problem Alcohol – Related Violence Drinking Driving Problems Other Costs Cost per Ounce $1. 00. 85. 40 $2. 25 Total Societal Costs, including Public Sector Costs: $6. 00/ounce Source: Ted Miller, Ph. D. PIRE

Societal Costs – Alcohol Sales Unit Public Sector Costs Total Societal Costs Beer – Six Pack $7. 30 $19. 45 Wine – Fifth Bottle $7. 50 $20. 00 Spirits – Fifth Bottle $23. 00 $61. 45 Source: Ted Miller, Ph. D. PIRE

Challenges Confronting the Community Prevention Coordinator A. Provide “translation” services between: 1. 2. 3. 4. 5. 6. Researchers Public health professionals Community organizers Policy makers Alcohol industry Alcohol law enforcement B. Provide “honest broker” services for each of the above groups. C. Keep a low profile!

Implementing Alcohol Control Strategies B. Establish a Brazilian technical assistance center for implementation of alcohol control strategies 1. Organize services by problems, not by control policies (violence, youth drinking, traffic safety, noise and neighborhood disruption, etc. ). 2. Local communities are the first priority for services. 3. Develop and implement a public health education strategy to change social norms. 4. Respond quickly to “unscheduled opportunities”.

Implementing Alcohol Control Strategies C. Increase enforcement of existing alcohol control policies. 1. Public health and law enforcement are not traditional allies – build relationships! 2. Support creation of law enforcement units which specialize in enforcement of alcohol laws. 3. Document, and then acknowledge publicly, the results of alcohol law enforcement.

Community Prevention Case Studies 1. Paulinia: alcohol price controls § Price/Enforcement 2. Salinas: alcohol control at special events § Place/Social Norms 3. Salinas: reducing alcohol outlet density § Place 4. Diadema: limiting alcohol sales § Place, Social Norms, Enforcement

Case Studies: Alcohol Prevention Research in Brazil Presentation Outline 1. What was your research interest? 2. What were your fears and concerns beginning your research? 3. What was the major difficulty you faced in conducting your research? 4. What was the biggest assistance you received in conducting your research? 5. What was the biggest unexpected “surprise” you encountered? 6. What is your advice to those who come along next in conducting research in your area?

Alcohol Prevention Research in Brazil • • • Research Topic Bar surveys and underage buyer surveys Municipal school surveys Collaboration with municipal officials Utilizing municipal records for evaluation, and roadside driver surveys Local and national household surveys, and emergency room surveys Alcohol industry structure and marketing practices Researcher • Marcos Romano • Denise Vieira • Nino Meloni • Sergio Duailibi • Ronaldo Laranjeira • Illana Pinsky

Science more accessible to policy-makers • Policy changes should be made with caution and with a sense of experimentation to determine whether they have their intended effects • Interdisciplinary research is capable of playing a critical role in the progress of public health by applying the methodologies of the medical, behavioural, social and population sciences

The precautionary principle A general public health concept • “To take preventive action even in the face of uncertainty” • To shift the burden of proof to the proponents of a potentially harmful actitivy • To offer alternatives to harmful actions • To increase public involvement in decisionmaking • Decision-making must be guided by the likelihood of risk, rather than the potential for profit

Extraordinary oportunities • Multiple • Changes can be made rationally • Combine rationally selected strategies into an integrated overall policy • The research base is strong • Policies can be implemented at multiple levels • Public awareness and support can be strengthened • International collaboration can be enhanced
- Slides: 167