POLLUTION FROM SI ENGINES THEIR CONTROL Pollution from


 when the")
 Gasoline vapours can escape when the vehicle is being refueled")


 System (for crankcase emissions) 2. Charcoal")


")


, with")

- Slides: 50
POLLUTION FROM SI ENGINES & THEIR CONTROL
Pollution from S. I. Engine Products of Complete Combustion NOx SOx Lead Products of Incomplete Combustion CO HC Particulates Lead
I. C. Engine & Environment COx CO Poison HC CO 2 GHG CH 4 GHG NOx Others Carcinogens P C Smog N 2 O GHG OD NO Lead NO 2 P C Smog GHG Acid Rain Poison Visibility SOx Particulates SO 2 SO 3 Acid Rain Particles Aerosols Smoke Soot Visibility Irritation
S. I. ENGINE EMISSIONS EVAPORATIVE FUEL TANK UBHC CARB. FLOAT BOWL UBHC CRANKCASE EXHAUST CO, HC, NOX, PART. FOR THE S. I. ENGINE WITH CARBURETOR: EVAPORATIVE EMISSIONS ACCOUNT FOR APPROXIMATELY 20% CRANKCASE EMISSIONS ACCOUNT FOR APPROXIMATELY 20% EXHAUST EMISSIONS ACCOUNT FOR THE BALANCE 60%
Vehicular Emissions
The Internal Combustion Engine and Atmospheric Pollution Type of Pollution Principal Sources Relevance of the I. C. Engine Lead Anti-knock compounds A (for the SI Engine) Carcinogens Diesel exhaust A Acid Rain Sulfur dioxide Oxides of nitrogen Unburned hydrocarbons Carbon monoxide B (for the CI Engine) A A (for the SI Engine) Global warming CFCs Carbon dioxide Methane B (for car with A/c) (or else not involved) B (may be even A) B (may be A if CNG used) Photochemical smog Carbon monoxide Unburned hydrocarbons Sulfur dioxide Oxides of nitrogen A (for the SI Engine) B (for the CI Engine) A Ozone depletion CFCs B (for car with A/c) (or else not involved) A (for the SI Engine) A Unburned hydrocarbons Oxides of nitrogen A: Major contributor B: Secondary influence
EVAPORATIVE EMISSIONS
Major Sources: Dirunal Emissions Take place from fuel tanks and carburetor float bowls (in engines fitted with carburetors) of parked vehicles. It draws in air at night as it cools down Expels air and gasoline vapour as it heats up during the day. These could be up to 50 g per day on hot days.
Hot Soak Emissions This occurs after an engine is shut down. The residual thermal energy of the engine heats up the fuel system leading to release of fuel vapours.
Running Losses Gasoline vapours are expelled from the tank (or float bowl) when the car is driven and the fuel tank becomes hot. This can be high if the ambient temperature is high.
Filling Losses (Refueling Losses) Gasoline vapours can escape when the vehicle is being refueled in the service station.
“Evaporative emissions increase significantly if the fuel volatility increases”
• Evaporative emissions are tested in the “Sealed Housing Evaporative Determination – SHED” test procedure evolved in the US. • Vehicle is placed in the enclosure and emissions are measured as the temperature in the fuel tank is increased. • This gives diurnal emissions. • Running losses are determined by running the vehicle on a chassis dynamometer with absorbent charcoal canisters attached at various possible emission sources. • The latest procedure involves running the vehicle through 3 standard driving cycles in the SHED. • The hot soak test measures emissions for one hour immediately following the hot soak test. • Acceptable losses from the complete procedure are 2 g of fuel per test for US, Europe and India.
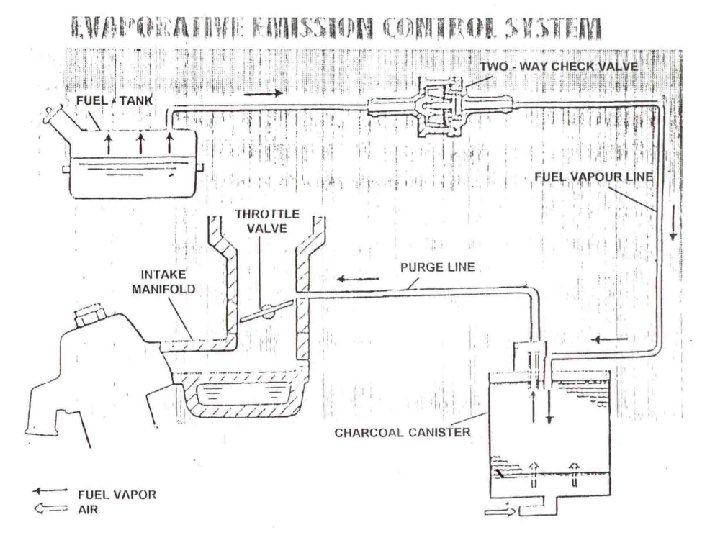
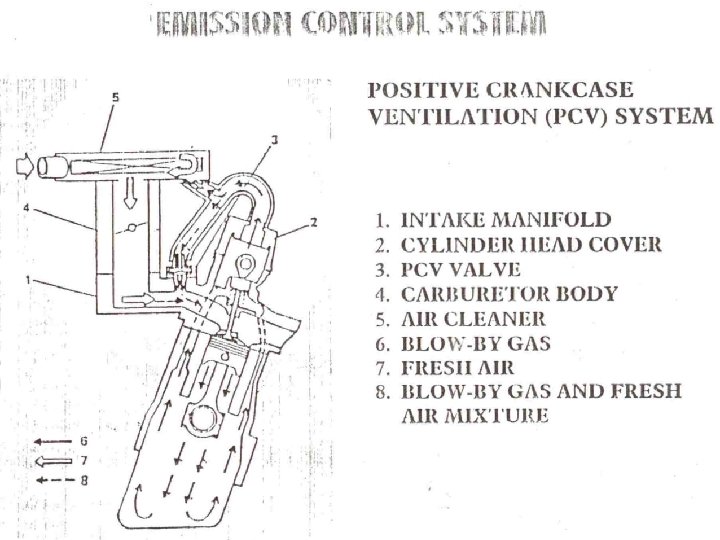
Evaporative Emission Control: 1. Positive Crankcase Ventilation (PCV) System (for crankcase emissions) 2. Charcoal Canister System (for Fuel tank and carburetor float bowl emissions)
Exhaust Emissions: 1. CO 1. NO 1. HC
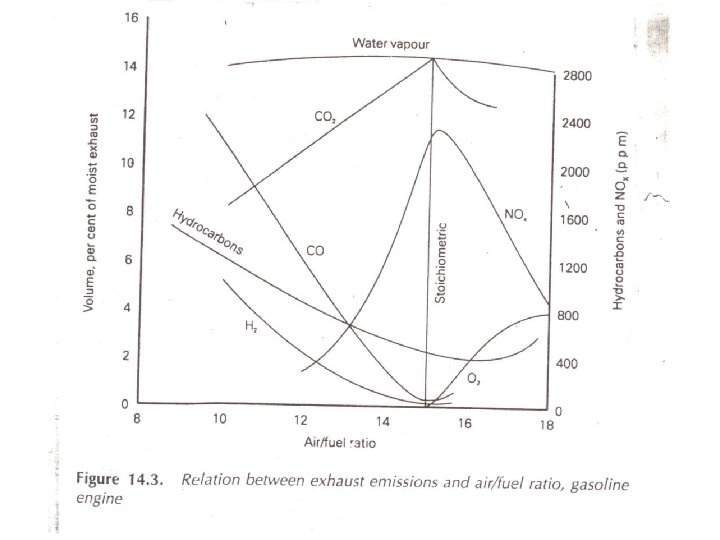
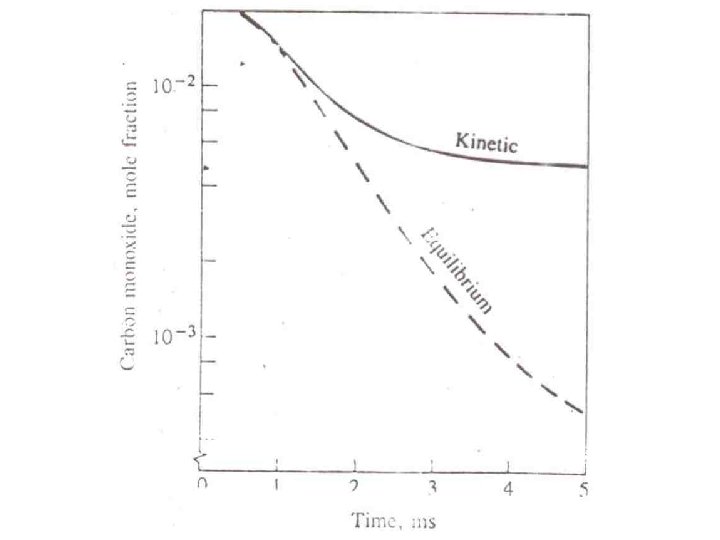
CO Formation • Primarily dependent on the equivalence ratio. • Levels of CO observed are lower than the maximum values measured within the combustion chamber • but are significantly higher than equilibrium values for the exhaust conditions • The processes which govern CO exhaust levels are kinetically controlled • The rate of re-conversion from CO to CO 2 is slower than the rate of cooling. • This explains why CO is formed even with stoichiometric and lean mixtures.
NO Formation: • There is a temperature distribution across the chamber due to passage of flame. • Mixture that burns early is compressed to higher temperatures after combustion, as the cylinder pressure continues to rise. • Mixture that burns later is compressed primarily as unburned mixture and ends up after combustion at a lower burned gas temperature. • Using the NO formation kinetic model based on the extended Zeldovich mechanism: O + N 2 NO + N N + O 2 NO + O N + OH NO + H
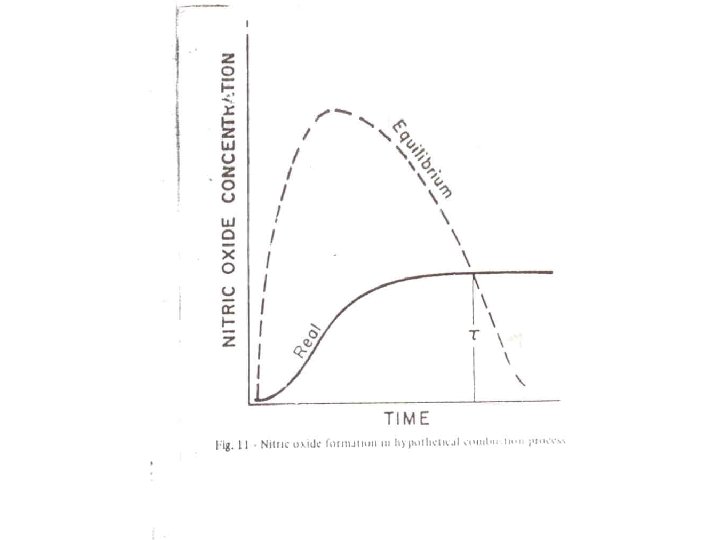
• Assuming equilibrium concentrations for O, O 2, N 2, OH and H corresponding to the equivalence ratio and burned gas fraction of the mixture we obtain the rate-limited concentration profile. The NO concentration corresponding to chemical equilibrium can also be obtained. • The rate-controlled concentrations arise from the residual gas NO concentration, lagging the equilibrium levels, then cross the equilibrium levels and “freeze” well above the equilibrium values corresponding to exhaust conditions. • Depending on details of engine operating conditions, the rate limited concentrations may or may not come close to equilibrium levels at peak cylinder pressure and gas temperature. • The amount of decomposition from peak NO levels, which occurs during expansion depends on engine conditions as well as whether the mixture element burned early or late. • The earlier burning fractions of the charge contribute much more to the exhausted NO than do later burning fractions of the charge.
• Frozen NO concentrations in these early-burning elements can be an order of magnitude higher than concentrations in late burning elements. • In the absence of vigorous bulk gas motion, the highest NO concentrations occur nearest the spark plug. • These descriptions of NO formation in the SI engine have been confirmed by experimental observations.
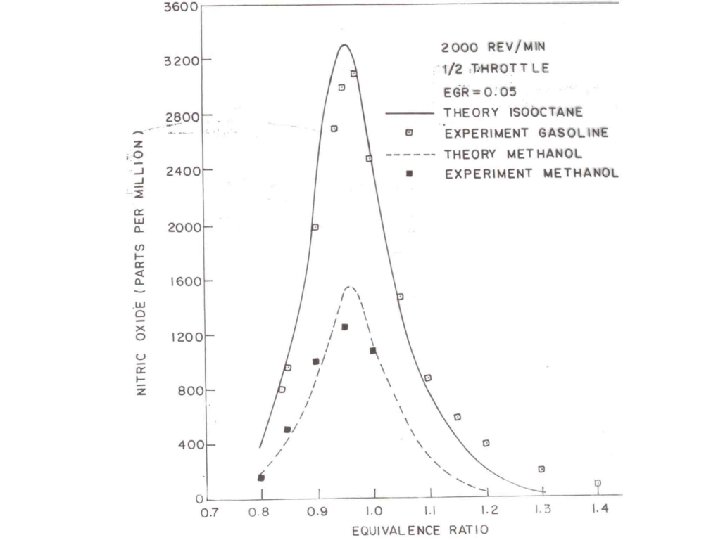
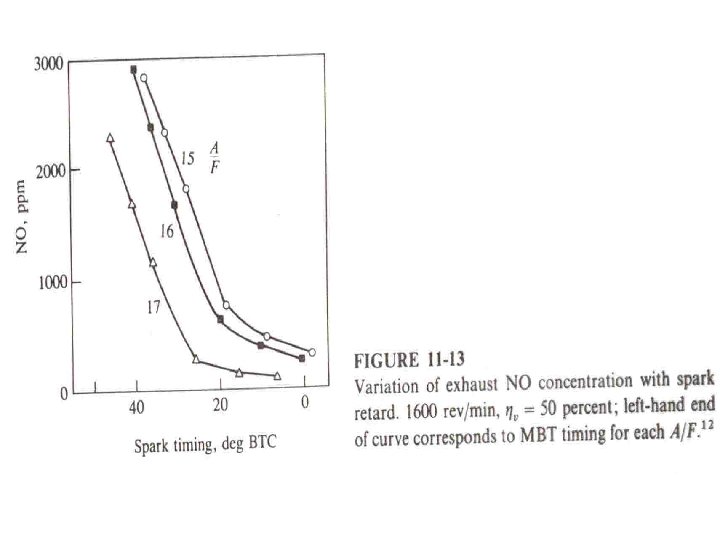
Among the major engine variables that affect NO emissions are 1. 2. 3. 4. Equivalence Ratio Burned gas fraction (Residual gas plus EGR if any) Excess air Spark Timing
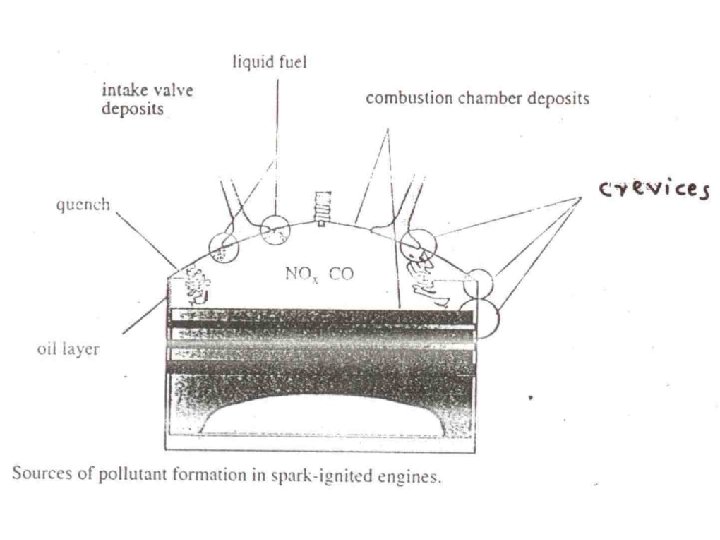
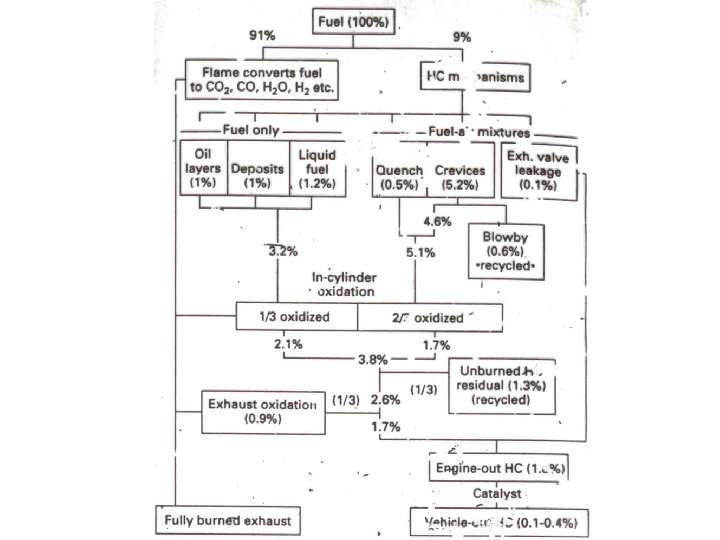
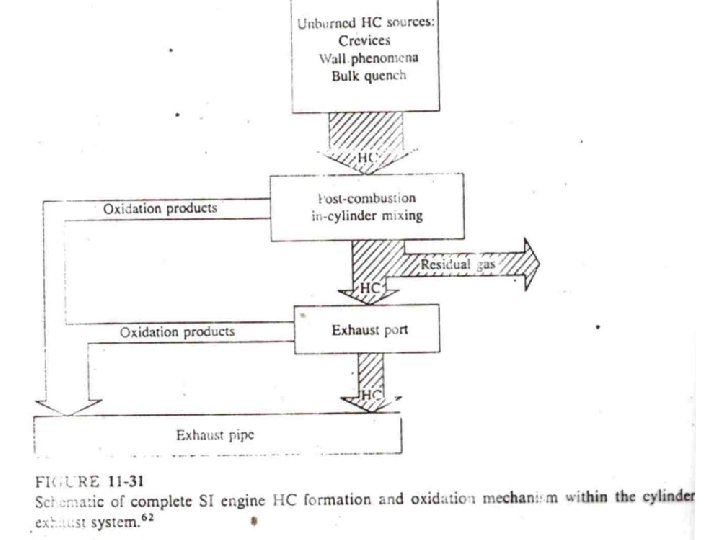
HC Formation: The sequence of processes involved in the engine out HC emissions is: 1. 2. 3. 4. Storage In-cylinder post-flame oxidation Residual gas retention Exhaust oxidation HC Sources 1. Quench Layers • Quenching contributes to only about 5 -10% of total HC. However, bulk quenching or misfire due to operation under dilute or lean conditions can lead to high HC. • Quench layer thickness has been measured and found to be in the range of 0. 05 to 0. 4 mm (thinnest at high load) when using propane as fuel. • Diffusion of HC from the quench layer into the burned gas and subsequent oxidation occurs, especially with smooth clean combustion chamber walls.
2. Crevices • These are narrow volumes present around the surface of the combustion chamber, having high surface-to-volume ratio into which flame will not propagate. • They are present between the piston crown and cylinder liner, along the gasket joints between cylinder head and block, along the seats of the intake and exhaust valves, space around the plug center electrode and between spark plug threads. • During compression and combustion, these crevice volumes are filled with unburned charge. During expansion, a part of the UBHC-air mixture leaves the crevices and is oxidized by the hot burned gas mixture. • The final contribution of each crevice to the overall HC emissions depends on its volume and location relative to the spark plug and exhaust valve.
3. Lubricant Oil Layer • The presence of lubricating oil in the fuel or on the walls of the combustion chamber is known to result in an increase in exhaust HC levels. • The exhaust HC was primarily unreacted fuel and not oil or oil-derived compounds. • It has been proposed that fuel vapor absorption into and desorption from oil layers on the walls of the combustion chamber could explain the presence of HC in the exhaust. 4. Deposits • Deposit buildup on the combustion chamber walls (which occurs in vehicles over several thousand kilometers) is known to increase UBHC emissions. • Deposit buildup rates depend on fuel and operating conditions. • Olefinic and aromatic compounds tend to have faster buildup than do paraffinic compounds.
5. • Liquid Fuel and Mixture Preparation – Cold Start The largest contribution (>90%) to HC emissions from the SI engine during a standard test occurs during the first minute of operation. This is due to the following reasons: • The catalytic converter is not yet warmed up • A substantially larger amount of fuel is injected than the stoichiometric proportion in order to guarantee prompt vaporization and starting 6. Poor Combustion Quality Flame extinction in the bulk gas before the flame front reaches the wall is a source of HC emissions under certain engine operating conditions.
Exhaust Emission Control: Four basic methods are used to control engine emissions: 1. Engineering of the combustion process 2. Optimizing the choice of the operating parameters and 3. Using after-treatment devices in the exhaust system. 4. Using reformulated fuels, for example, oxygenated gasoline in winter to reduce CO and low volatility gasoline in summer to reduce evaporative HC. This requires advances in, . 1. Fuel injector design 2. Oxygen sensors 3. on-board computers
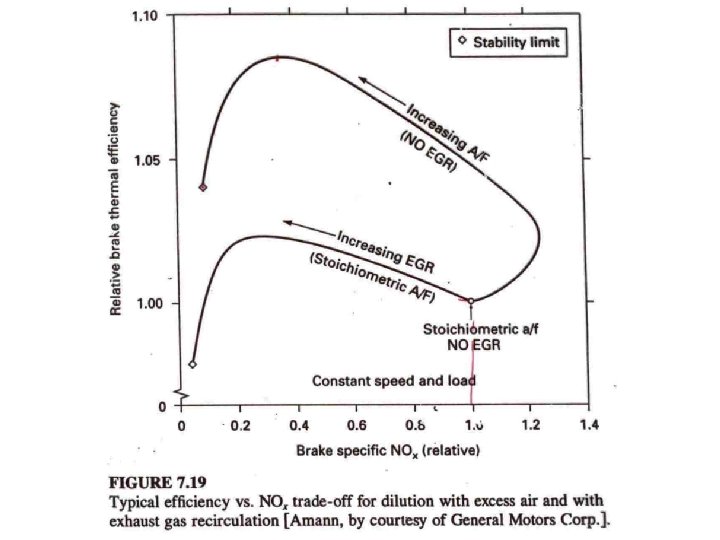
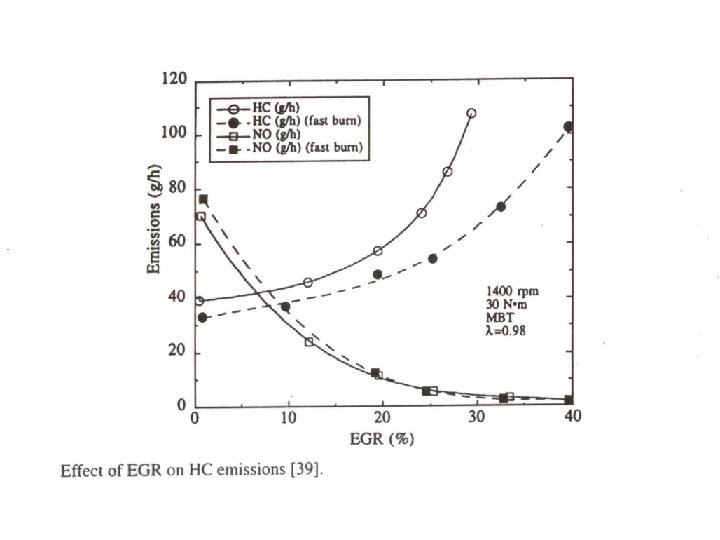
Two NOx control measures have been used since the 1970 s, namely, 1. Spark retard and 2. Exhaust gas recirculation (EGR). · Both methods reduce peak temperatures and hence NOx emissions. · If EGR is used, spark timing has to be advanced to maintain optimal thermal efficiency. · EGR fraction increases with engine load up to the lean limit – about 15 -20% of the fuel-air mixture. Currently, the most important after-treatment device is the Three-way catalyst (TWC), which was first installed in the US in 1975.
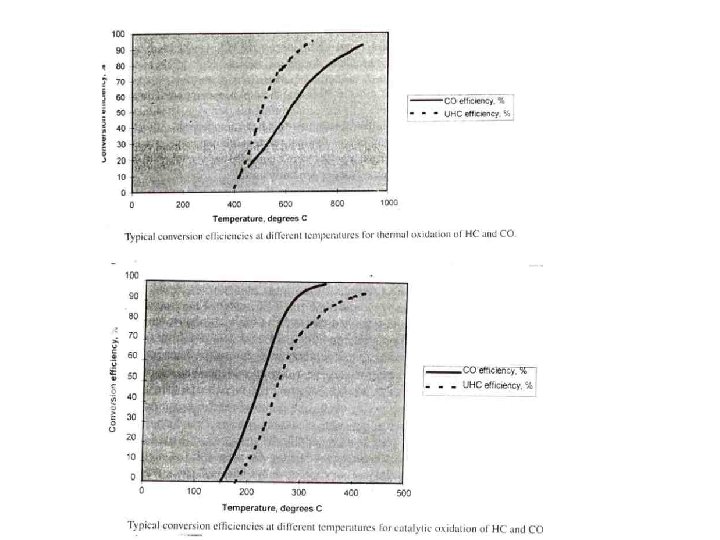
Three-way catalyst consists of: • Rhodium – the principal metal used to remove NO • Platinum – the principal metal used to remove HC and CO NO reacts with CO, HC and H 2 via reduction reactions on the surface of the catalyst. Remaining CO and HC are removed through an oxidation reaction forming CO 2 and H 2 O in the products. Light-off temperature: The temperature at which the catalytic converter becomes 50% efficient. It is approximately 270 o. C for oxidation of HC and about 220 o. C for oxidation of CO. Conversion efficiency at fully warmed up condition is 98 -99% for CO and 95% for HC, depending on the HC components.
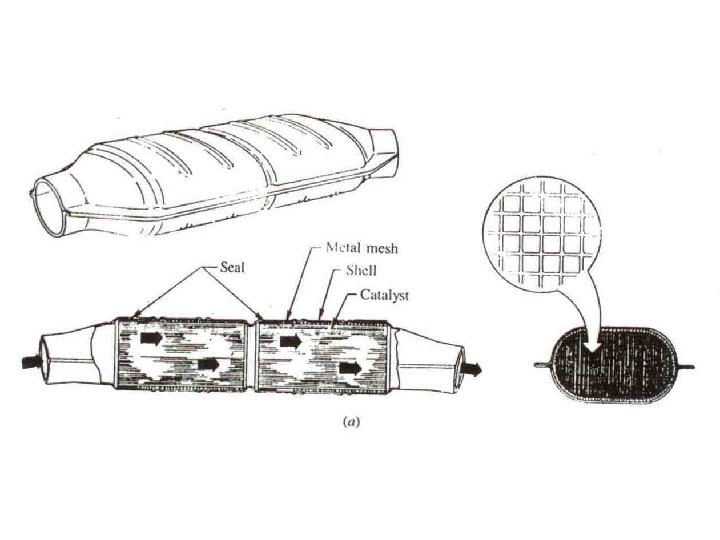
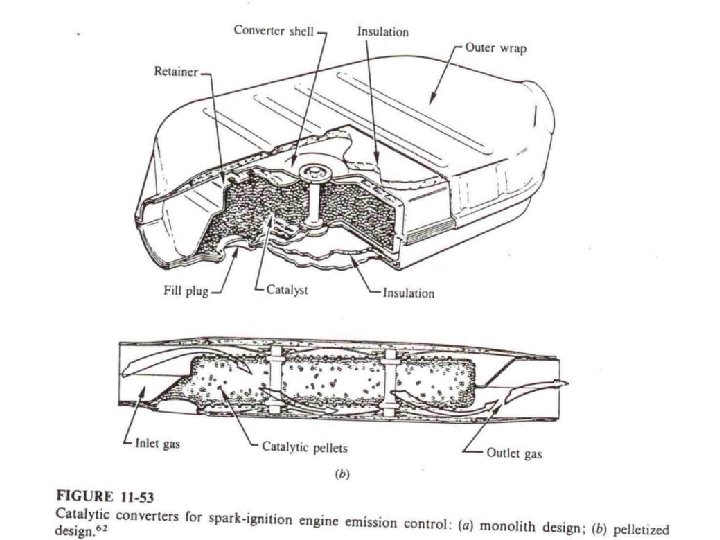
Catalytic Converter: • Consists of an active catalytic material in a specially designed metal casing, which directs the exhaust gas through the catalyst bed • Active material (noble metals like platinum, palladium and rhodium or base metals like copper and chromium) Two types of configurations are commonly used, • Ceramic honeycomb or matrix structure- also called monolith • A bed of spherical ceramic pellets
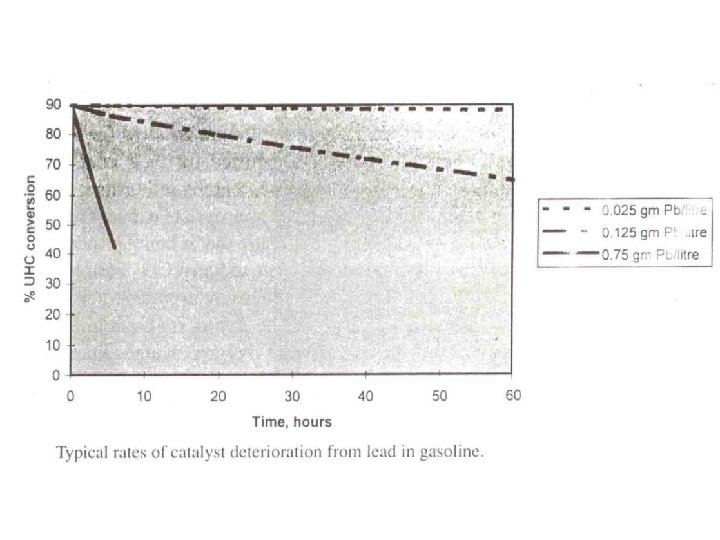
Catalyst poisoning/degradation may be due the following causes: 1. Overheating due to engine malfunction. About 20 s of ignition failure in one cylinder at 4000 rev/min or above may provide sufficient temperature to destroy the catalyst. 2. Presence of sulfur, phosphorus or lead in the fuel, especially lead, can poison the catalyst. With 0. 75 g Pb/liter, the efficiency drops to 40% in 10 h of operation. 3. Sintering is promoted by exposure of catalyst to high operating temperatures. Involves the migration and agglomeration of sites, thus determining their active surface area.
Oxidation Catalysts: The oxidation catalyst oxidizes CO and HC to CO 2 and H 2 O. Sufficient oxygen must be present to oxidize CO and HC. Because of their higher intrinsic (inherent) activity, noble metals are most suitable as catalytic material. A mixture of platinum (Pt) and palladium (Pd) is most commonly used. For oxidation of CO, olefins, and methane: specific activity of Pd is higher than that of Pt. For oxidation of aromatics: Pt and Pd have similar activity. For oxidation of paraffins (molecular weight greater than C 3): Pt is more active than Pd.
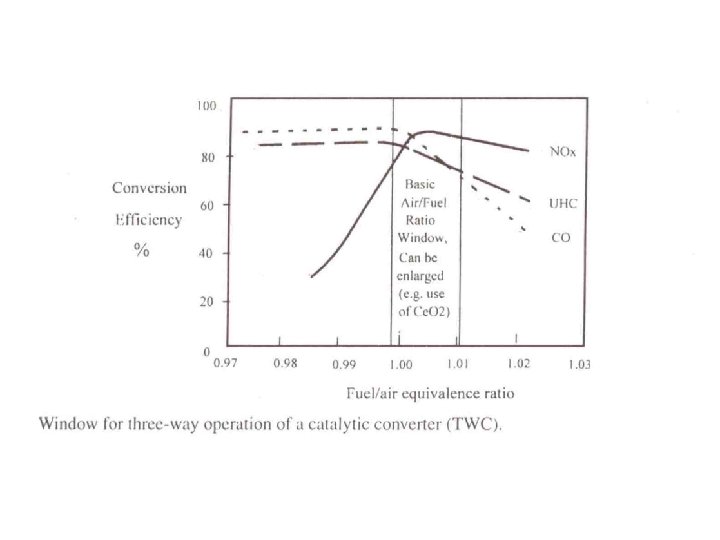
Three-way Catalysts • If the engine is operated at all times with an air-fuel ratio at or close to stoichiometric then both NO reduction and HC/CO oxidation can be done in a single catalyst bed. • The catalyst effectively brings the exhaust gas composition to a near-equilibrium state at their exhaust conditions, that is, a composition of CO 2, H 2 O and N 2. • Enough reducing gases will be present to reduce NO and enough oxygen to oxidize CO and HC. Such a catalyst is called a Three Way Catalyst (TWC). • It requires an electronic carburetor or a fuel injection system (FIS), through closed loop control of Φ. • An oxygen sensor in the exhaust is used to indicate whether the engine is operating rich or in the lean side of stoichiometric and provide a signal for adjusting the fuel system to achieve the desired A/F.
• Commercial TWC contain Pt & Rh (Pt/Rh = 2 to 17), with some alumina, Ni. O and Ce. O 2. Alumina is the preferred support material. • Catalyst must be quickly warmed up (20– 30 s) - current system takes 2 min. • Catalytic reactors must have low thermal inertia, that is, it must be constructed of material, which have low specific heat but high thermal conductivity. Hence warm up time to operating temperature will be less. • Methods for decreasing warm up time are: 1. Use of an after burner 2. Locating the converter or use of a start up converter closer to the exhaust valve/manifold. 3. Electric heating - Additional cost plus a major drain in the battery; required for starting the engine. Up to 1. 5 k. W for short period may be required. 4. Absorb the UBHC during cold start and release it after warming up.