Points Lines and Polygons Cartography Basics Week 5

Points, Lines, and Polygons: Cartography Basics Week 5, Day 2

Mapping is Data Visualization What is the advantage of visualizing our data?

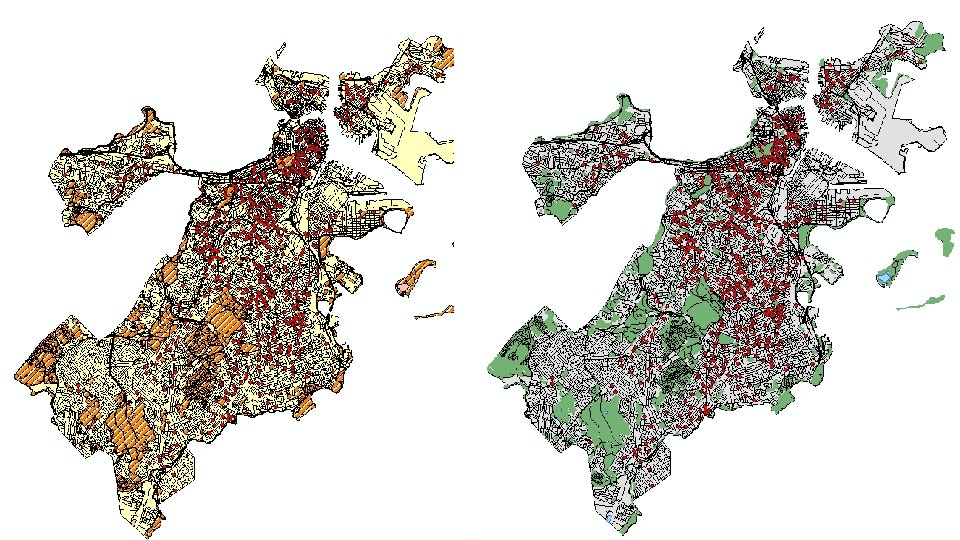
Visual Thinking and Communication Maps help with visual thinking by helping us make connections between different phenomena (e. g. land use and crime) or to see patterns in similar types of crime. Vertical Connections between different phenomena Horizontal Common factors across particular crime types

Visual Thinking and Communication Maps help with visual communication by allowing us to synthesize and present the results of our analysis because they allow our brains to process large amounts of complex data more easily than spreadsheets or reports. Vertical Connections between different phenomena Horizontal Common factors across particular crime types

Mapping is a Science and an Art! Maps show the results of science – data collection, analysis, and interpretation. There is science behind how we interpret visualizations, e. g. how we usually interpret hue, brightness, and saturation, or how clutter detracts from interpretation. But there is also art in creating beautiful and effective mapping products.

Map Features are represented by vector data. Vector shapes are represented using geometry made up of one or more interconnected vertices – a position in space described on the X, Y, and sometimes Z axis.

Map Features: Points When a feature’s geometry consists of only a single vertex, it is a point feature. A single X, Y location is a point. Points are good for marking the location of incidents or single things – e. g. a person, a fire hydrant.

Map Features: Lines When a feature’s geometry consists of two or more vertices and the first and last vertex are not equal (in the same place), a line is formed. Lines are good for representing roads and other transportation features. Sometimes they represent small waterways.

Map Features: Polygons When a feature’s geometry consists of three or more vertices and the first and last vertex ARE equal (in the same place), an enclosed polygon is formed. Polygons are used to represent areas – like city blocks, buildings, parks, census tracts, or entire states and countries.

Source: https: //docs. qgis. org/2. 8/en/docs/gentle_gis_introduction/vector_data. html

Choosing Colors When you add layers to your map, they will usually be drawn with random colors and symbols. This is usually REALLY ugly. You should change the colors and symbols so that your map is easy for people to interpret (and is also visually pleasing!).

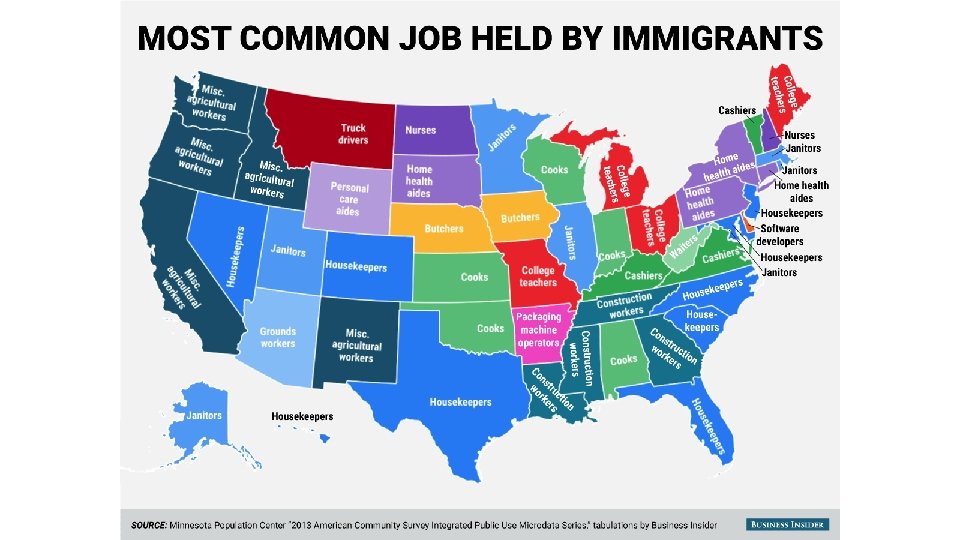
Different hues in the same lightness and saturation should be used for nominal data (unorderable categories).
")
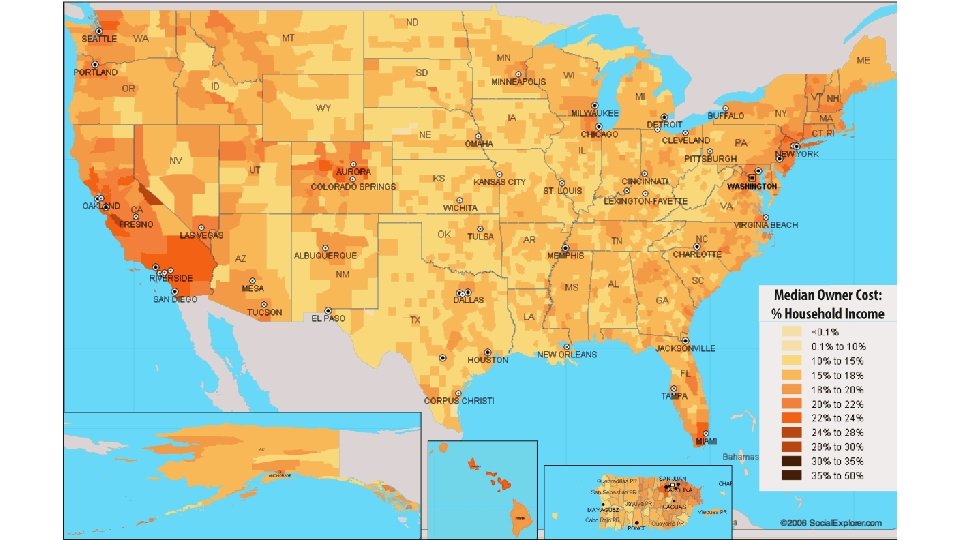
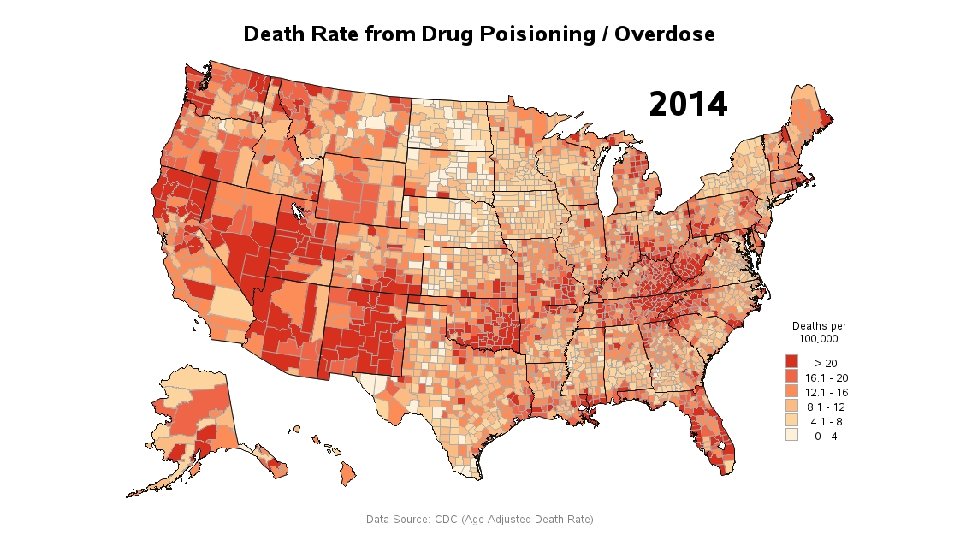
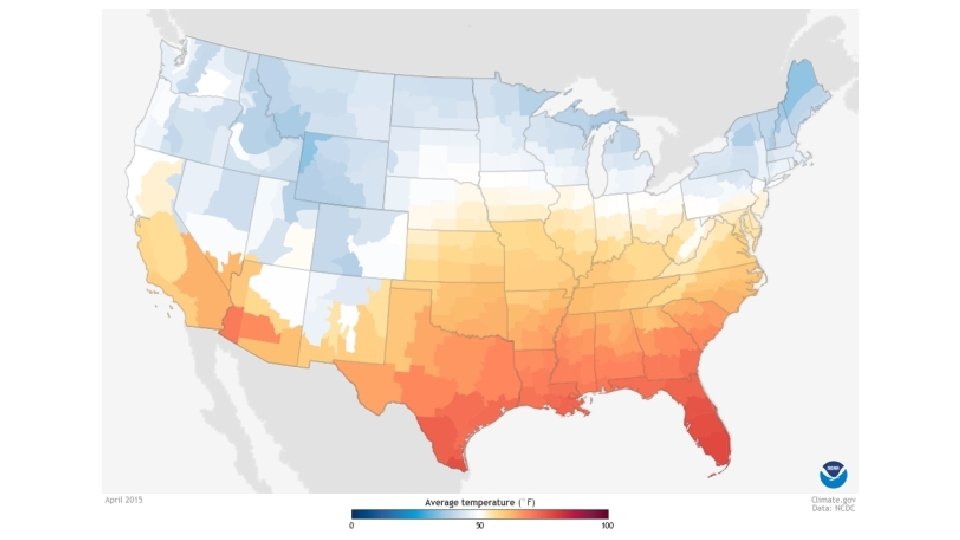
The same hue in increasing darkness or saturation can be used with orderable (rankable) categories or numerical data. Darker or more saturated means higher, greater, stronger.

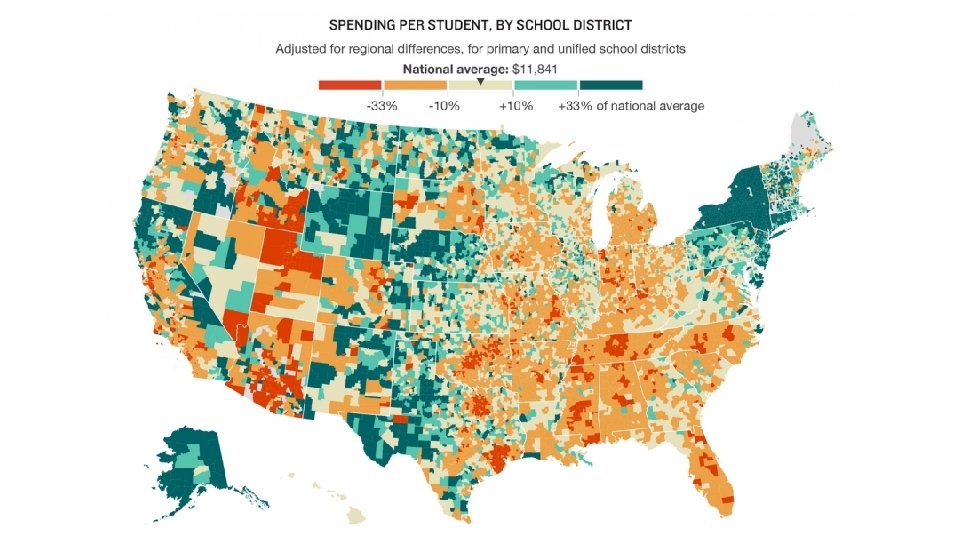
A diverging color scheme can be used with numerical data that can be divided meaningfully at a midpoint (e. g. average, zero). Darker or more saturated means larger, greater, stronger.
![Online tools can help you choose good color schemes. [click] to visit Color. Brewer](http://slidetodoc.com/presentation_image_h2/1decdc7e5a27dd238f4a8b52e459582f/image-21.jpg "Online tools can help you choose good color schemes. [click] to visit Color. Brewer")
Online tools can help you choose good color schemes. [click] to visit Color. Brewer 2. org

The Symbology Menu Right-click layer Properties Symbology Single Symbol: One way of symbolizing all features of this layer – e. g. all one color, all one icon.

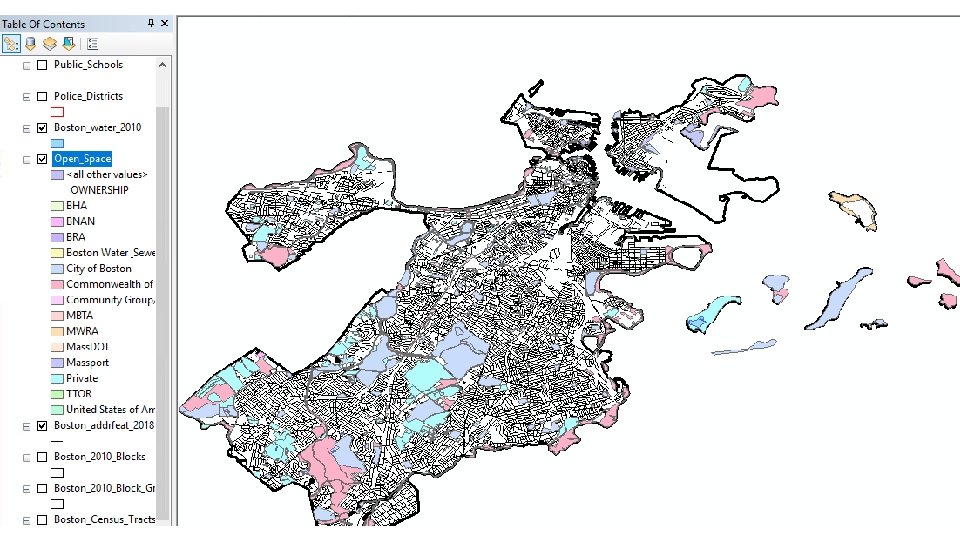
The Symbology Menu Categories: Symbolize the features in this layer in different ways according to the value of some category in the attribute table. e. g. for Open Space layer, different colors for different ownership.

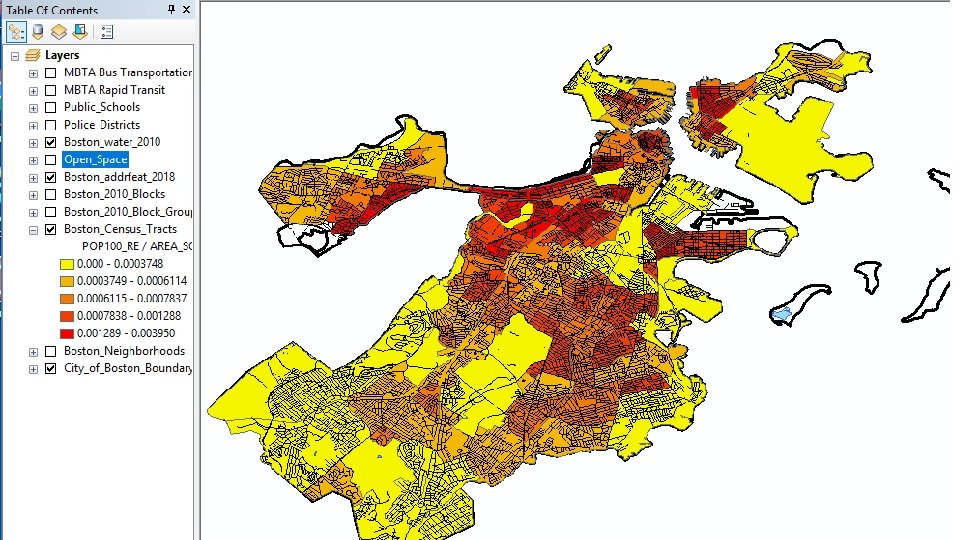
The Symbology Menu Quantities: Symbolize the features in this layer in different ways according to the value of some numerical variable in the attribute table. e. g. for Census Tracts layer, shading tracts by population. Remember to normalize if necessary.

Required Map Elements Titles Legends or Keys Scale North Arrow or Compass Data Source Author and Date Projection System

Required Map Elements Titles Legends or Keys Scale North Arrow or Compass Data Source Author and Date Projection System

Required Map Elements Titles Legends or Keys Scale North Arrow or Compass Data Source Author and Date Projection System

Required Map Elements Titles Legends or Keys Scale North Arrow or Compass Data Source Author and Date Projection System

Required Map Elements Titles Legends or Keys Scale North Arrow or Compass Data Source Author and Date Projection System
- Slides: 31