
Plugin and electric buses Edward Jobson City traffic
Plug-in and electric buses Edward Jobson
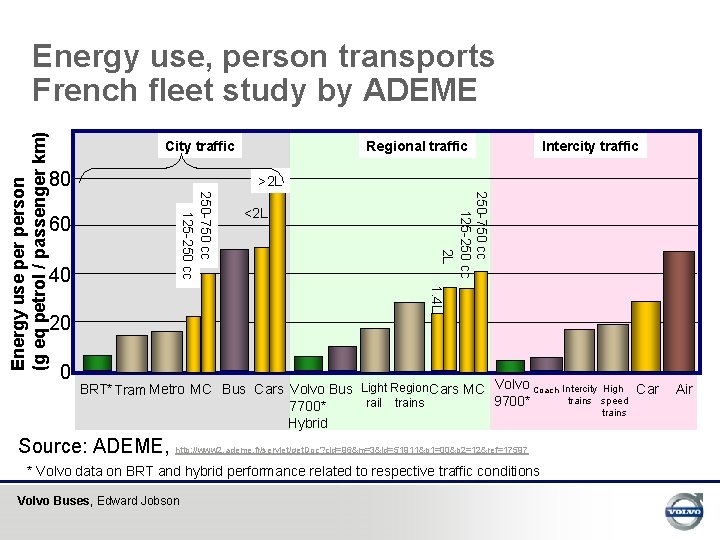
City traffic 80 Intercity traffic 1. 4 L 40 <2 L 250 -750 cc 125 -250 cc 2 L 60 20 0 Regional traffic >2 L 250 -750 cc 125 -250 cc Energy use person (g eq petrol / passenger km) Energy use, person transports French fleet study by ADEME BRT* Tram Metro MC Bus Cars Volvo Bus Light Region Cars MC Volvo Coach Intercity High Car trains speed 9700* rail trains 7700* trains Hybrid Source: ADEME, http: //www 2. ademe. fr/servlet/get. Doc? cid=96&m=3&id=51911&p 1=00&p 2=12&ref=17597 * Volvo data on BRT and hybrid performance related to respective traffic conditions Volvo Buses, Edward Jobson Air
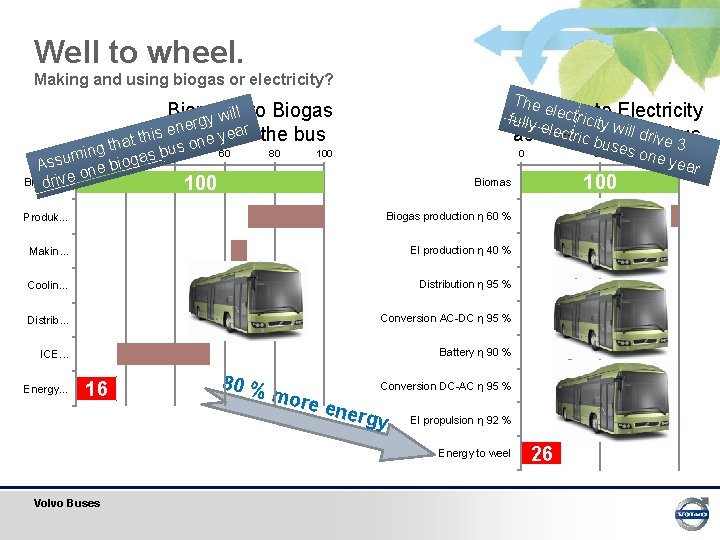
Well to wheel. Making and using biogas or electricity? The elec to Electricity fu. Biomass lly el tricity wi ectric forll the as energy buse drivebus 3 s one 100 0 50 year l to Biogas Biomass y wil g r e en fuelyefor ar the bus his as t e t n a o h t 0 ing 20 60 bu 40 s s m a u g s o s i A b one e v i Biomass r d 100 80 100 Produk. . . Biogas production η 60 % Makin. . . El production η 40 % Coolin. . . Distribution η 95 % Distrib. . . Conversion AC-DC η 95 % ICE. . . Battery η 90 % Energy. . . 16 Volvo Buses 80 % 100 Biomas more Conversion DC-AC η 95 % ener gy 28 El propulsion η 92 % 26 Energy to weel 26
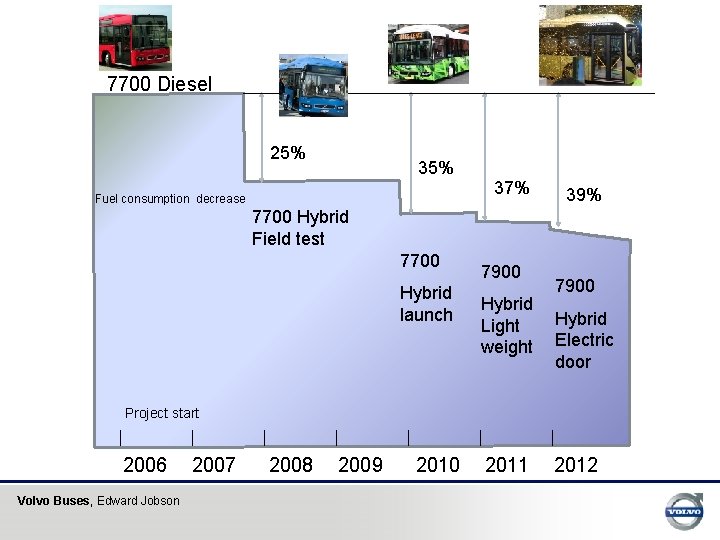
7700 Diesel 25% 35% Fuel consumption decrease 37% 39% 7700 Hybrid Field test 7700 Hybrid launch 7900 Hybrid Light weight 7900 Hybrid Electric door Project start 2006 Volvo Buses, Edward Jobson 2007 2008 2009 2010 2011 2012
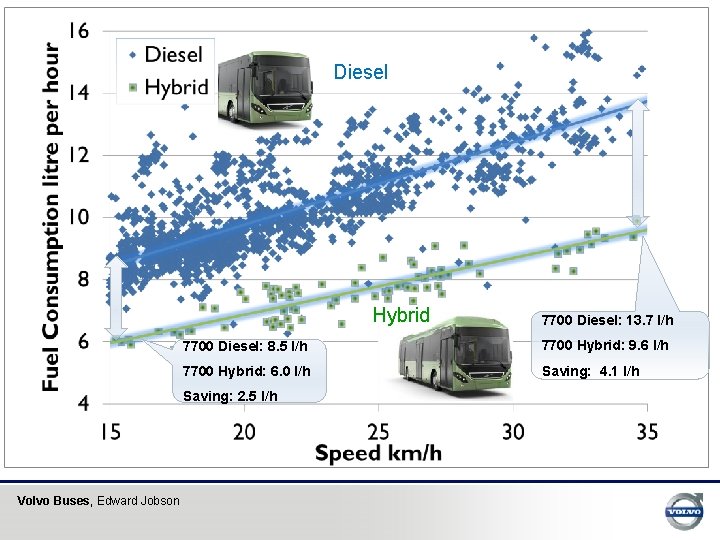
Diesel Hybrid 7700 Diesel: 8. 5 l/h 7700 Hybrid: 9. 6 l/h 7700 Hybrid: 6. 0 l/h Saving: 4. 1 l/h Saving: 2. 5 l/h Volvo Buses, Edward Jobson 7700 Diesel: 13. 7 l/h
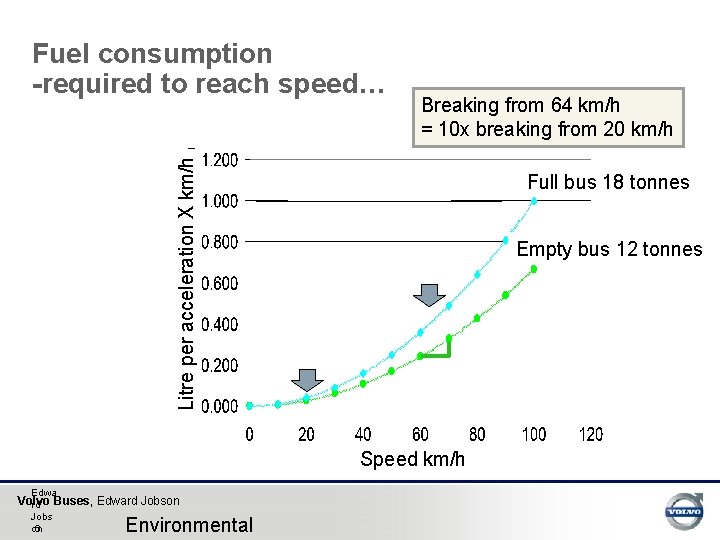
Breaking from 64 km/h = 10 x breaking from 20 km/h Litre per acceleration X km/h Fuel consumption -required to reach speed… Full bus 18 tonnes Empty bus 12 tonnes Speed km/h Edwa Volvo rd Buses, Edward Jobson Jobs on 6 Environmental

Volvo 7900 Plug-in Hybrid March 2013 Field test Beyond Euro VI Serial Production Data ing g r Cha p pl i c n ri es Tram Trolley 10 -20 km Electric range 5 -10 min Charging time Plug-in from all infrastructure Energy use 30 -40% of diesel Induction Slide-in Volvo Buses, Edward Jobson
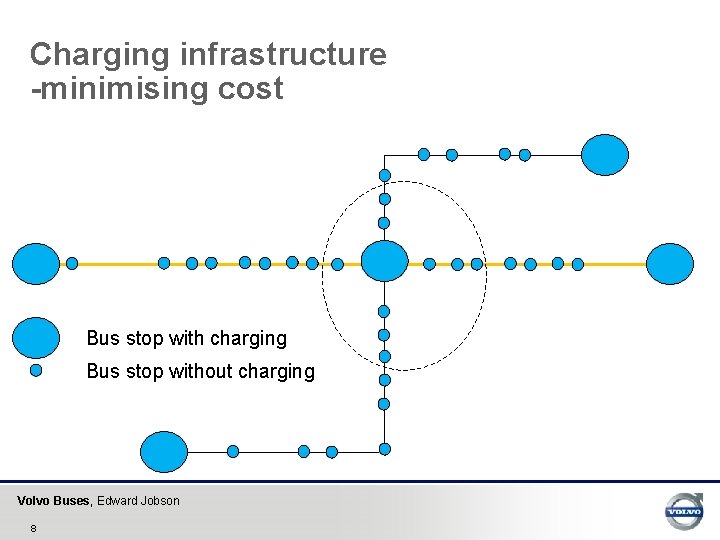
Charging infrastructure -minimising cost Bus stop with charging Bus stop without charging Volvo Buses, Edward Jobson 8
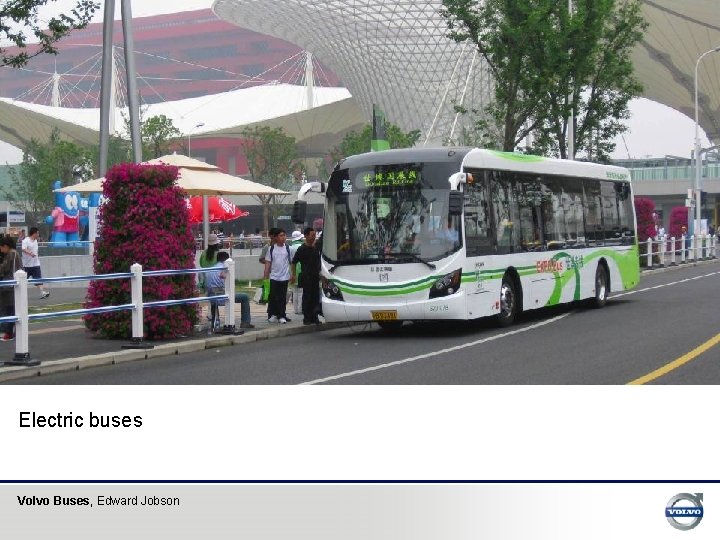
Electric buses Volvo Buses, Edward Jobson
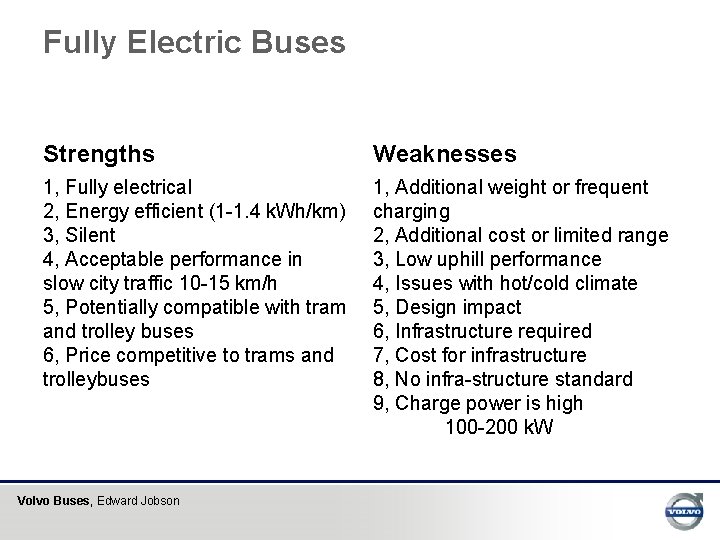
Fully Electric Buses Strengths Weaknesses 1, Fully electrical 2, Energy efficient (1 -1. 4 k. Wh/km) 3, Silent 4, Acceptable performance in slow city traffic 10 -15 km/h 5, Potentially compatible with tram and trolley buses 6, Price competitive to trams and trolleybuses 1, Additional weight or frequent charging 2, Additional cost or limited range 3, Low uphill performance 4, Issues with hot/cold climate 5, Design impact 6, Infrastructure required 7, Cost for infrastructure 8, No infra-structure standard 9, Charge power is high 100 -200 k. W Volvo Buses, Edward Jobson
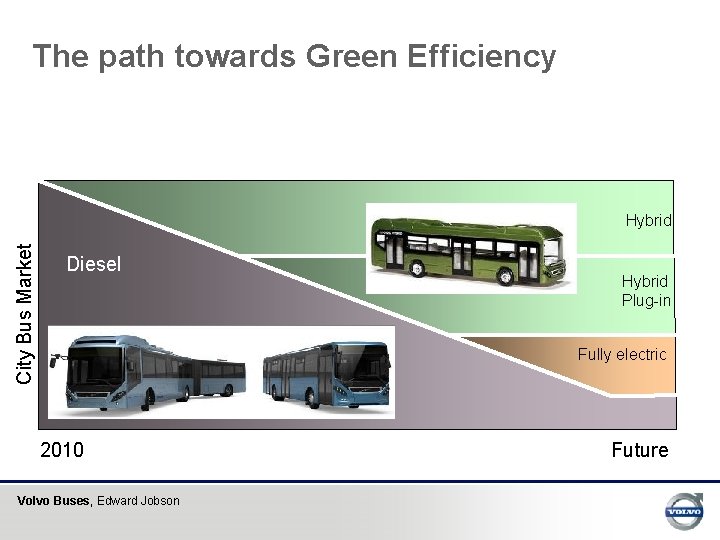
The path towards Green Efficiency City Bus Market Hybrid Diesel Hybrid Plug-in Fully electric 2010 Volvo Buses, Edward Jobson Future
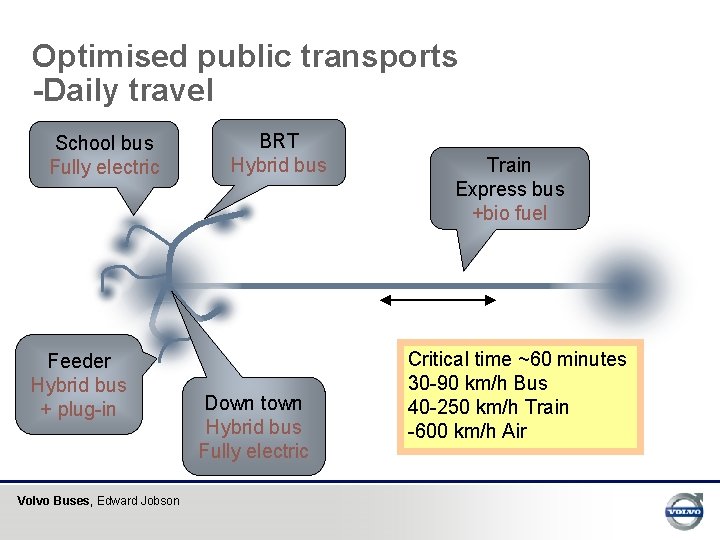
Optimised public transports -Daily travel School bus Fully electric Feeder Hybrid bus + plug-in Volvo Buses, Edward Jobson BRT Hybrid bus Down town Hybrid bus Fully electric Train Express bus +bio fuel Critical time ~60 minutes 30 -90 km/h Bus 40 -250 km/h Train -600 km/h Air
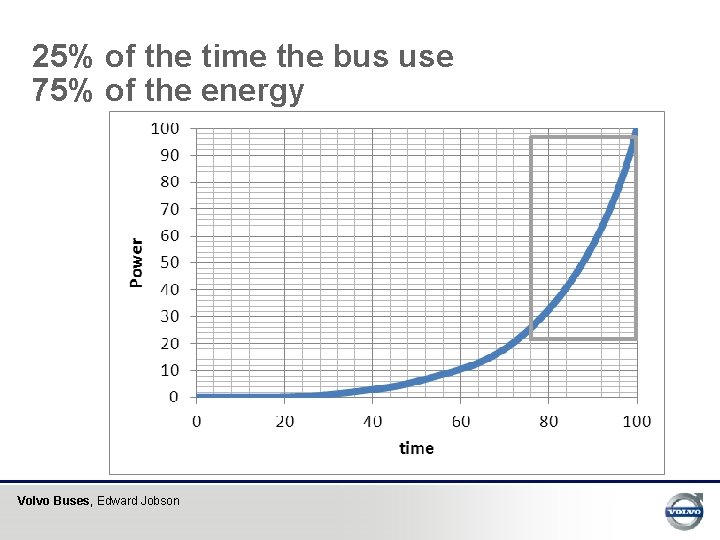
25% of the time the bus use 75% of the energy Volvo Buses, Edward Jobson
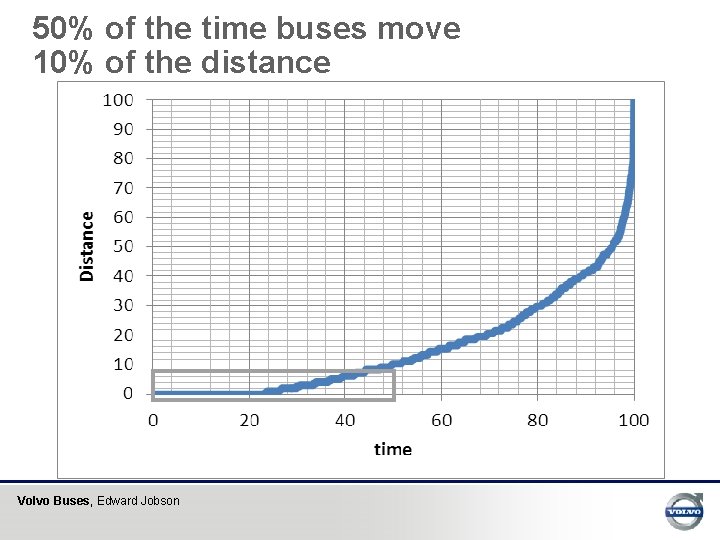
50% of the time buses move 10% of the distance Volvo Buses, Edward Jobson
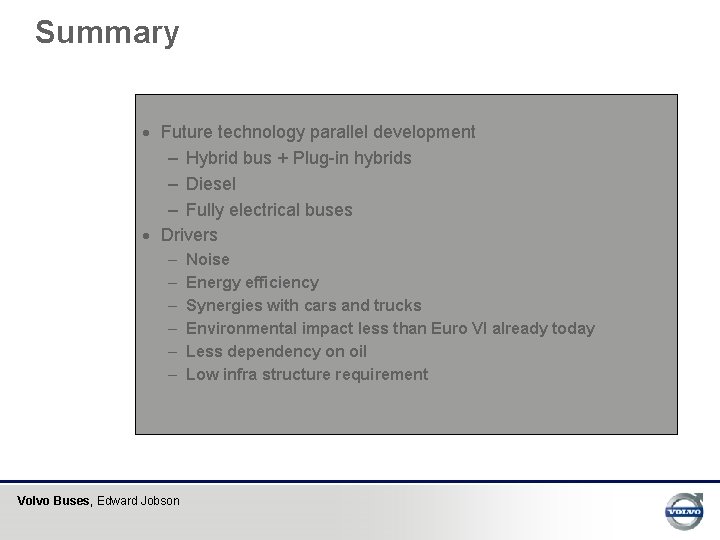
Summary · Future technology parallel development – Hybrid bus + Plug-in hybrids – Diesel – Fully electrical buses · Drivers – – – Volvo Buses, Edward Jobson Noise Energy efficiency Synergies with cars and trucks Environmental impact less than Euro VI already today Less dependency on oil Low infra structure requirement
Volvo Buses, Edward Jobson
Back-up slides for discussion Volvo Buses, Edward Jobson Department, Name, Document name, Security Class 17 2021 -06 -20 Date
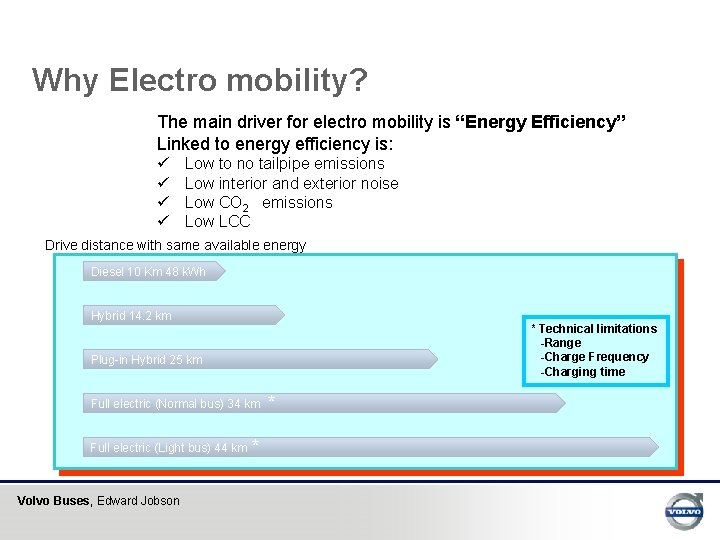
Why Electro mobility? The main driver for electro mobility is “Energy Efficiency” Linked to energy efficiency is: ü ü Low to no tailpipe emissions Low interior and exterior noise Low CO 2 emissions Low LCC Drive distance with same available energy Diesel 10 Km 48 k. Wh Hybrid 14. 2 km * Technical limitations -Range -Charge Frequency -Charging time Plug-in Hybrid 25 km Full electric (Normal bus) 34 km Full electric (Light bus) 44 km Volvo Buses, Edward Jobson * *
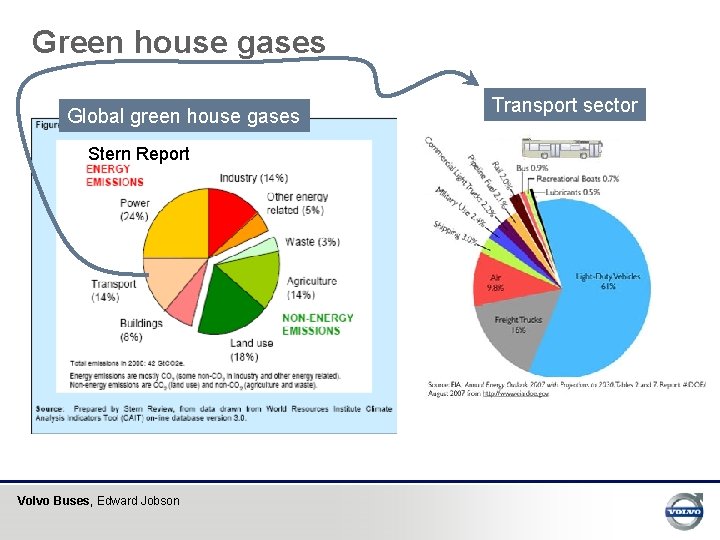
Green house gases Global green house gases Stern Report Volvo Buses, Edward Jobson Transport sector
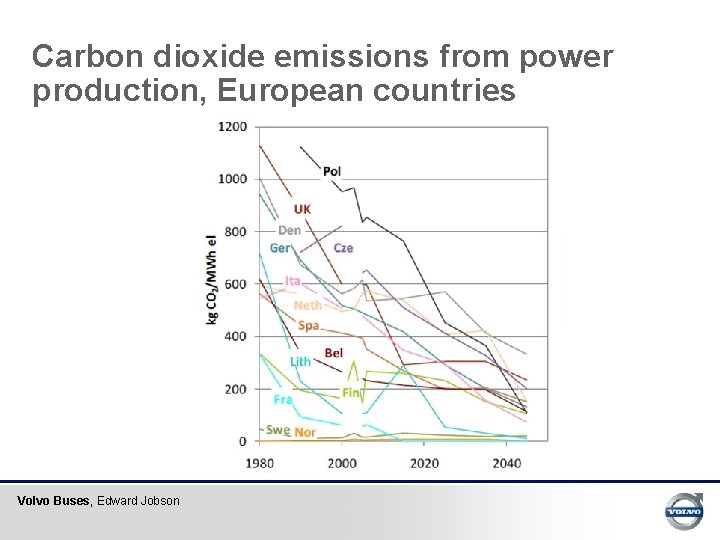
Carbon dioxide emissions from power production, European countries Volvo Buses, Edward Jobson
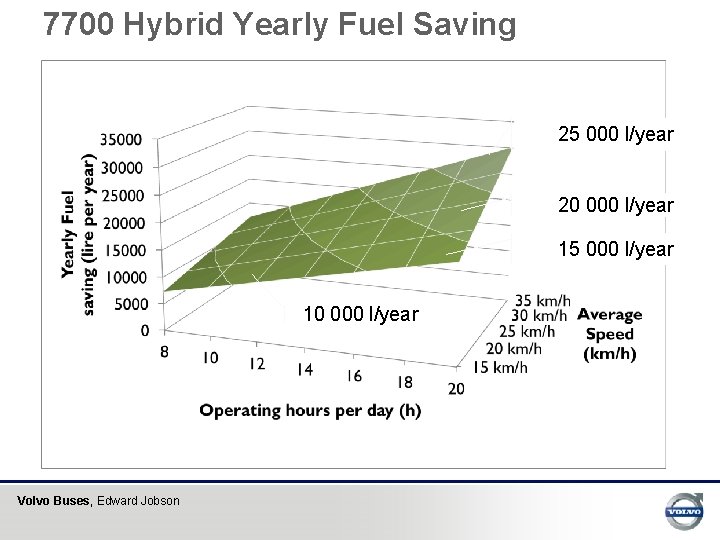
7700 Hybrid Yearly Fuel Saving 25 000 l/year 20 000 l/year 15 000 l/year 10 000 l/year Volvo Buses, Edward Jobson
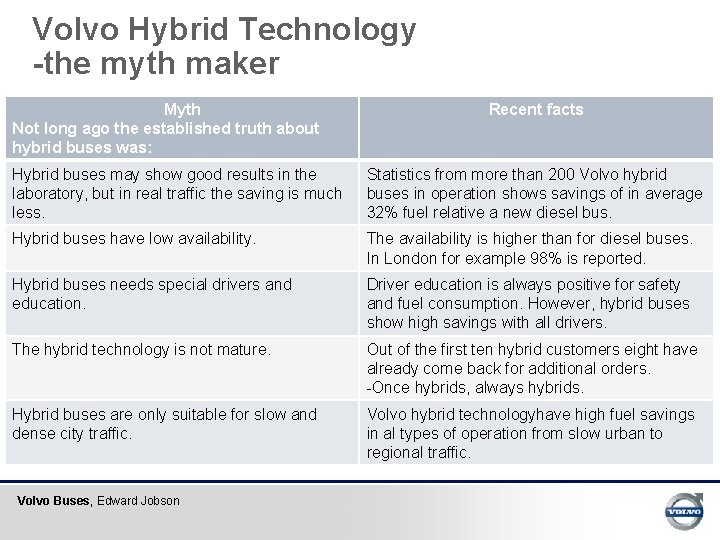
Volvo Hybrid Technology -the myth maker Myth Not long ago the established truth about hybrid buses was: Recent facts Hybrid buses may show good results in the laboratory, but in real traffic the saving is much less. Statistics from more than 200 Volvo hybrid buses in operation shows savings of in average 32% fuel relative a new diesel bus. Hybrid buses have low availability. The availability is higher than for diesel buses. In London for example 98% is reported. Hybrid buses needs special drivers and education. Driver education is always positive for safety and fuel consumption. However, hybrid buses show high savings with all drivers. The hybrid technology is not mature. Out of the first ten hybrid customers eight have already come back for additional orders. -Once hybrids, always hybrids. Hybrid buses are only suitable for slow and dense city traffic. Volvo hybrid technologyhave high fuel savings in al types of operation from slow urban to regional traffic. Volvo Buses, Edward Jobson
Volvo Buses, Edward Jobson
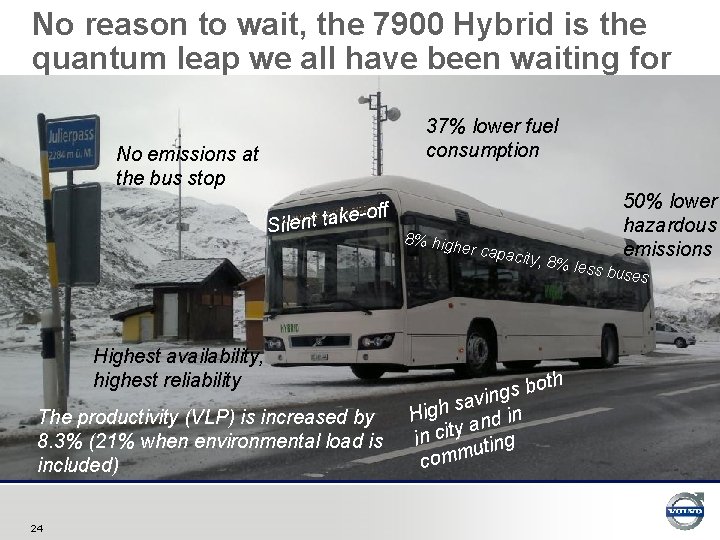
No reason to wait, the 7900 Hybrid is the quantum leap we all have been waiting for 37% lower fuel consumption No emissions at the bus stop S -off ilent take 8% high er capa Highest availability, highest reliability The productivity (VLP) is increased by 8. 3% (21% when environmental load is included) 24 city, 8% oth b s g vin a s h Hig d in n a y in cit ting u m m o c 50% lower hazardous emissions less bu ses
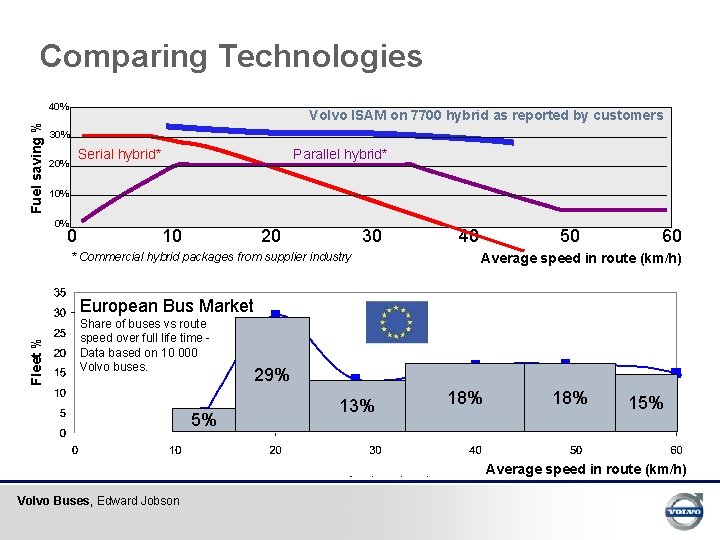
Comparing Technologies Fuel saving % 40% Volvo ISAM on 7700 hybrid as reported by customers 30% Serial hybrid* 20% Parallel hybrid* 10% 0% 0 10 20 30 * Commercial hybrid packages from supplier industry 50 40 60 Average speed in route (km/h) Fleet % European Bus Market Share of buses vs route speed over full life time Data based on 10 000 Volvo buses. 5% 29% 13% 18% 15% Average speed in route (km/h) Volvo Buses, Edward Jobson
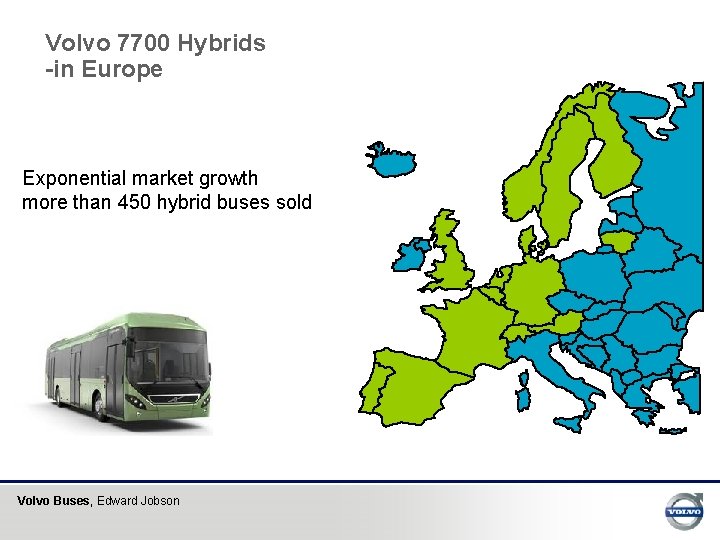
Volvo 7700 Hybrids -in Europe Exponential market growth more than 450 hybrid buses sold Volvo Buses, Edward Jobson
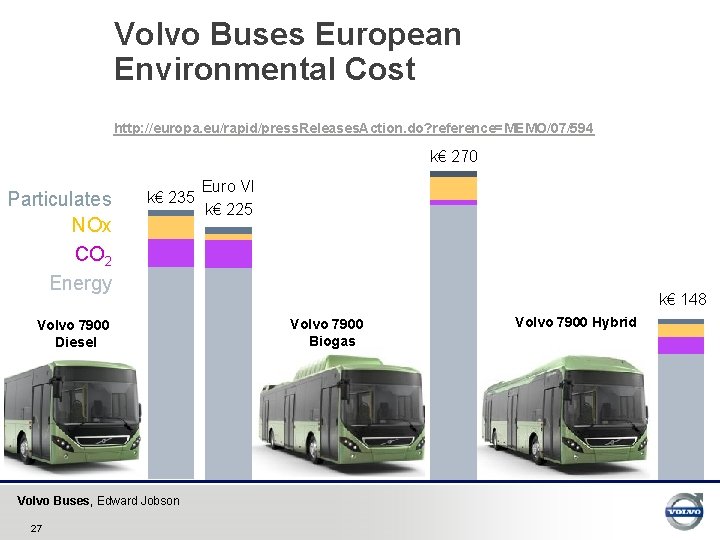
Volvo Buses European Environmental Cost http: //europa. eu/rapid/press. Releases. Action. do? reference=MEMO/07/594 k€ 270 Particulates NOx CO 2 Energy k€ 235 Volvo 7900 Diesel Volvo Buses, Edward Jobson 27 Euro VI k€ 225 k€ 148 Volvo 7900 Biogas Volvo 7900 Hybrid
- Slides: 27