Plotting Exponential Functions Worksheet A The worksheet is


- Slides: 9
Plotting Exponential Functions – Worksheet A The worksheet is in a 2 sizes.
Printing To print handouts from slides Select the slide from the left. Then click: File > Print > ‘Print Current Slide’ To print multiple slides Click on a section title to highlight all those slides, or press ‘Ctrl’ at the same time as selecting slides to highlight more than one. Then click: File > Print > ‘Print Selection’ To print double-sided handouts Highlight both slides before using ‘Print Selection’. Choose ‘Print on Both Sides’ and ‘Flip on Short Edge’.
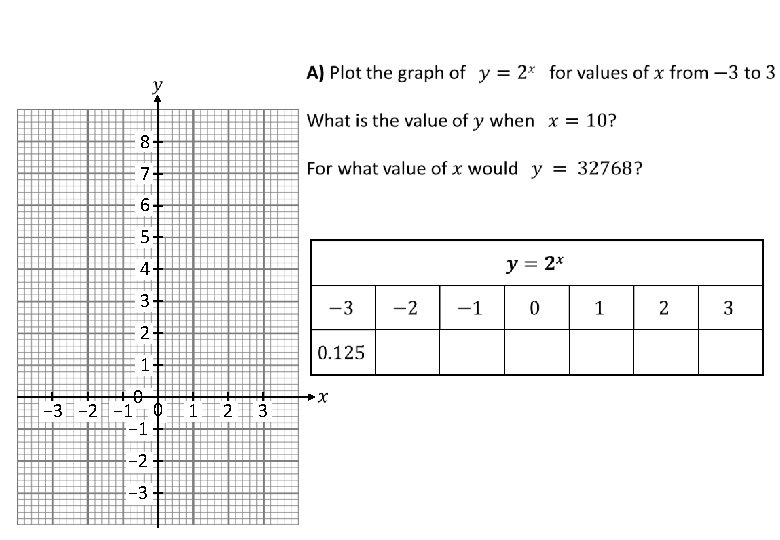
Plotting Exponential Graphs 8 1 7 0. 9 6 0. 8 5 0. 7 4 0. 6 3 2 0. 5 1 0. 4 0 − 3 − 2 − 1 0 − 1 1 2 0. 3 3 0. 2 − 2 0. 1 − 3 0 Why does the graph curve down? 0 1 2 3 4 5 7 6 5 4 D) 1. 1 represents an interest rate of _____% 3 If someone invested at this interest rate, approximately how long does it take for their money to triple? 2 1 0 0 2 4 6 8 10 12 14 16 18 20 If someone invested at a compound interest rate of 20%, how much more money would they have after 20 years? 6 7 8 9 10
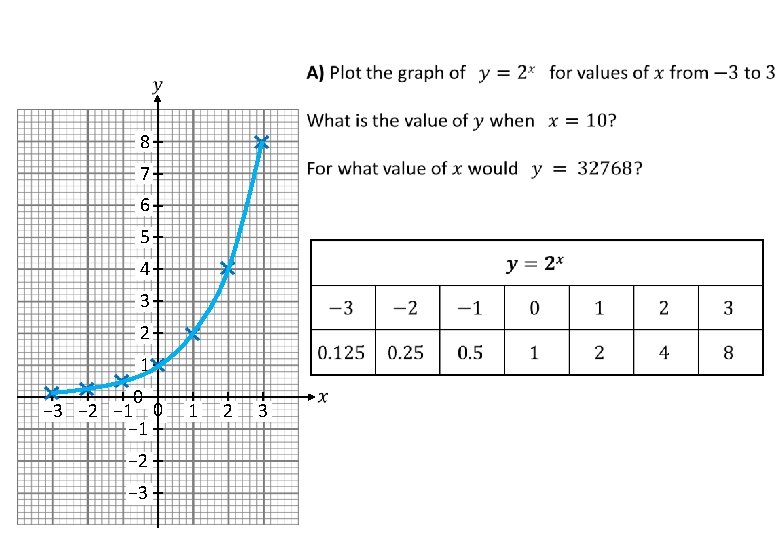
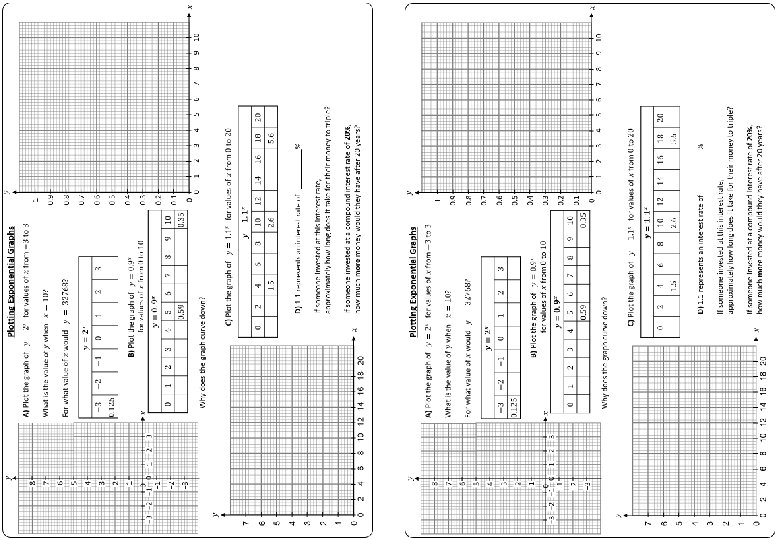
Plotting Exponential Graphs 8 1024 15 7 6 5 1 0. 9 0. 8 0. 7 4 0. 6 3 2 0. 5 1 0. 4 0 − 3 − 2 − 1 0 − 1 1 2 0. 3 3 0. 2 − 2 0. 1 − 3 Why does the graph curve down? 0. 9 < 1 0 0 1 2 3 4 5 6 7 8 9 10 7 6 5 4 3 10 Triple D) 1. 1 represents an interest rate of _____% 12 years If someone invested at this interest rate, approximately how long does it take for their money to triple? 2 1 0 0 2 4 6 8 10 12 14 16 18 20 If someone invested at a compound interest rate of 20%, how much more money would they have after 20 years? 1. 220= 38. 3 1. 120= 2. 6 ≈ 36 times more of the original amount
Plotting Exponential Graphs 8 1 7 0. 9 6 0. 8 5 0. 7 4 0. 6 3 2 0. 5 1 0. 4 0 − 3 − 2 − 1 0 − 1 1 2 0. 3 3 0. 2 − 2 0. 1 − 3 0 Why does the graph curve down? 0 1 2 3 4 5 7 6 5 4 D) 1. 1 represents an interest rate of _____% 3 If someone invested at this interest rate, approximately how long does it take for their money to triple? 2 1 0 0 2 4 6 8 10 12 14 16 18 20 If someone invested at a compound interest rate of 20%, how much more money would they have after 20 years? 6 7 8 9 10
Questions? Comments? Suggestions? …or have you found a mistake!? Any feedback would be appreciated . Please feel free to email: tom@goteachmaths. co. uk