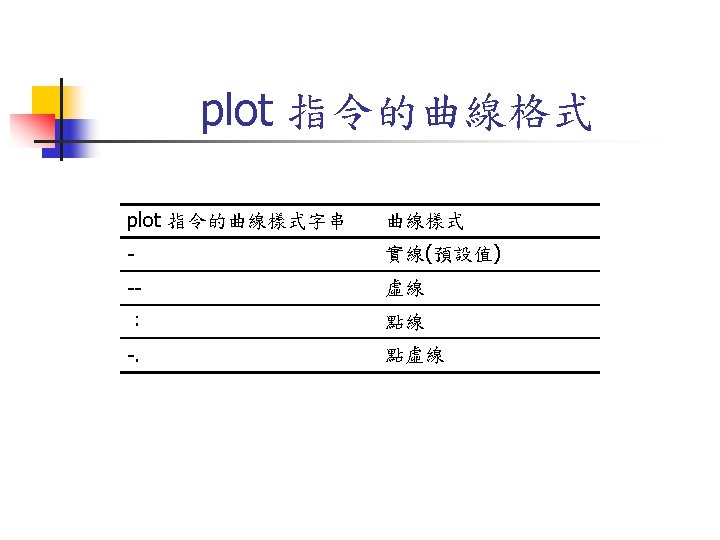
Plot5 II Hint Why plotx x x generates

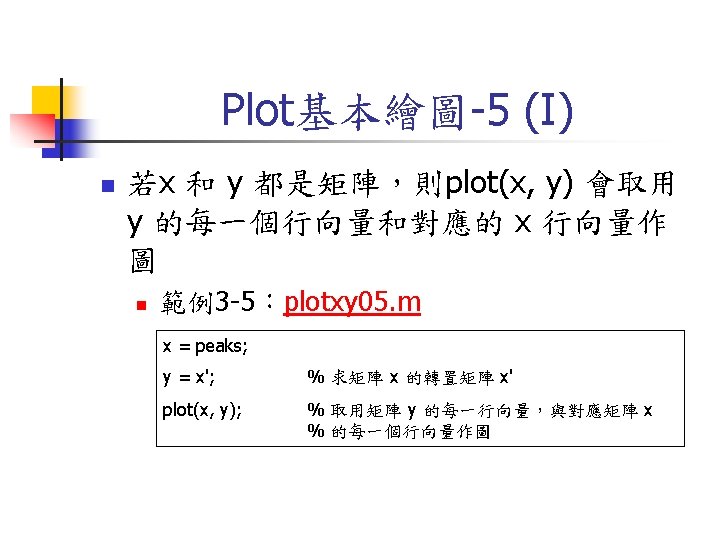
 Hint: Why plot(x, x’, x) generates a twisted mesh in the space?")
![Quiz n a=[1 2; 3 4] n n n plot(a) Plot(a, a’, a’, a)](https://slidetodoc.com/presentation_image_h/2ede2eaade5c6861f1c9cdc91957f8e1/image-13.jpg "Quiz n a=[1 2; 3 4] n n n plot(a) Plot(a, a’, a’, a)")
 y=sin(t) n n x=2*sin(t) y=cos(t)")

=cosq +j*sinq? Quiz!")


; plot(humps); subplot(222); plot(humps); set(gca, 'xgrid', 'on'); subplot(223); plot(humps); set(gca,")
 subplot(2, 2, 1) subplot(2, 2, 3) subplot(2, 2, 2) subplot(2, 2, 4)")
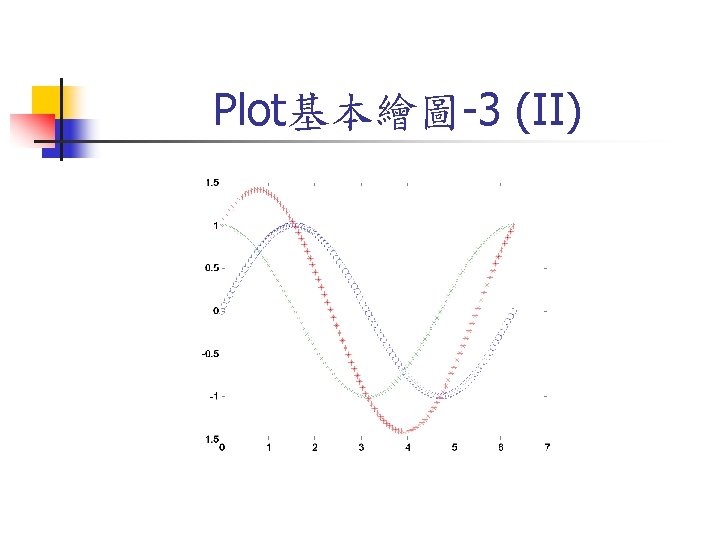
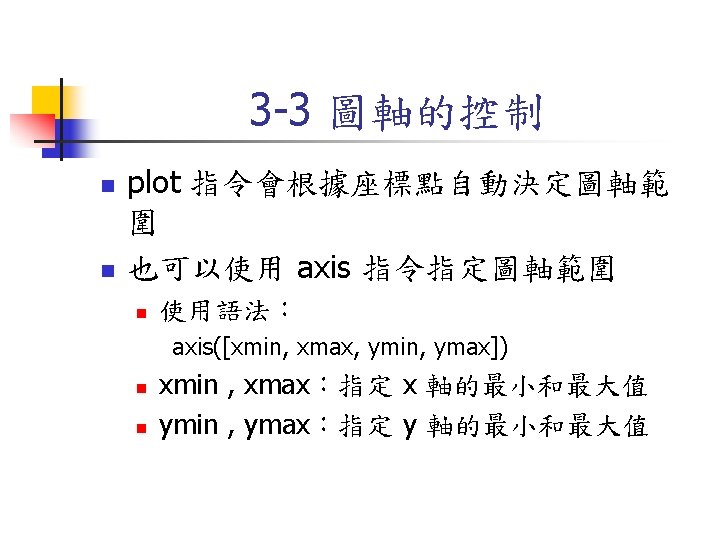
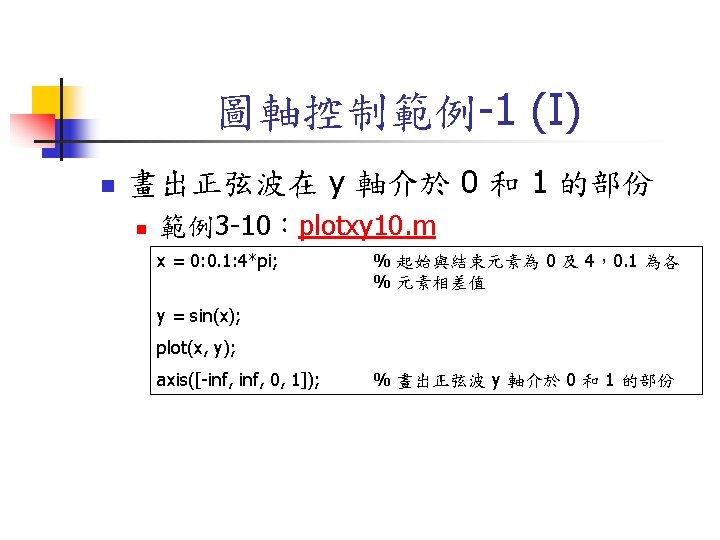
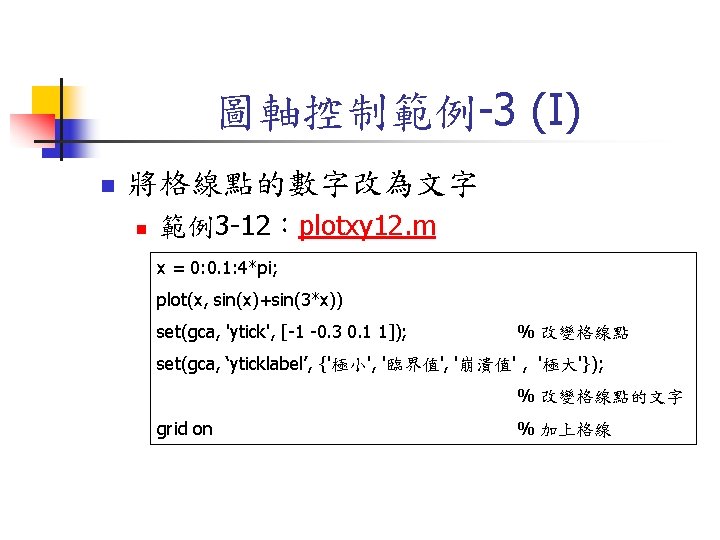
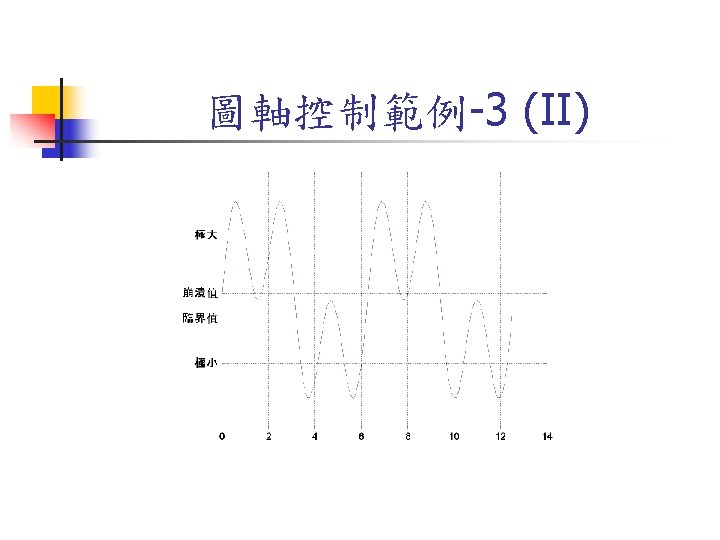
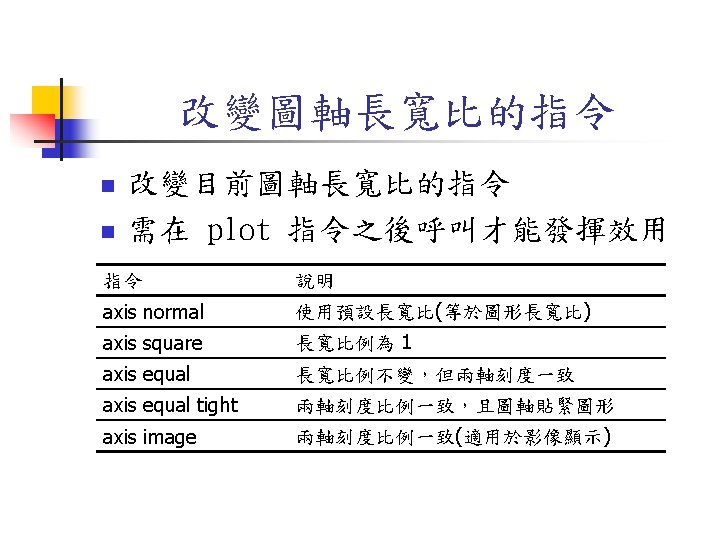
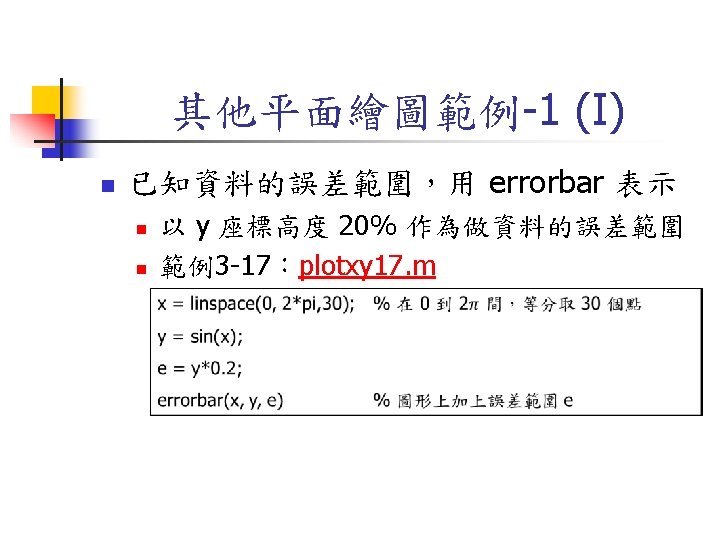
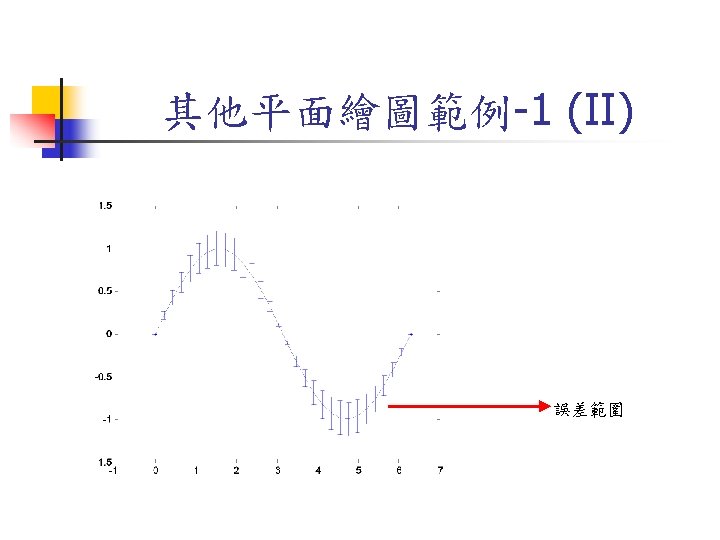
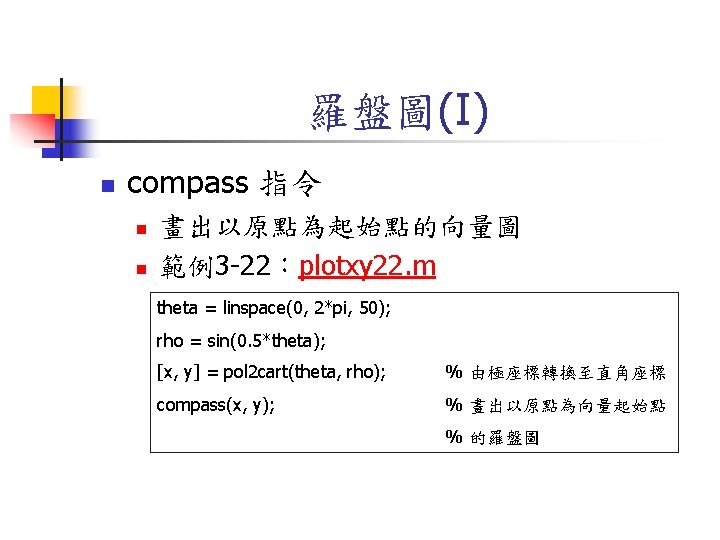
 n 長寬比(Aspect Ratio) n n n 一般圖軸長寬比是視窗的長寬比 可在 axis 指令後加不同的字串來修改 範例3 -14:plotxy")
 axis normal axis equal axis square axis equal tight")
 n 範例3 -15:plotxy 15. m subplot(1, 1, 1); x = 0: 0.")
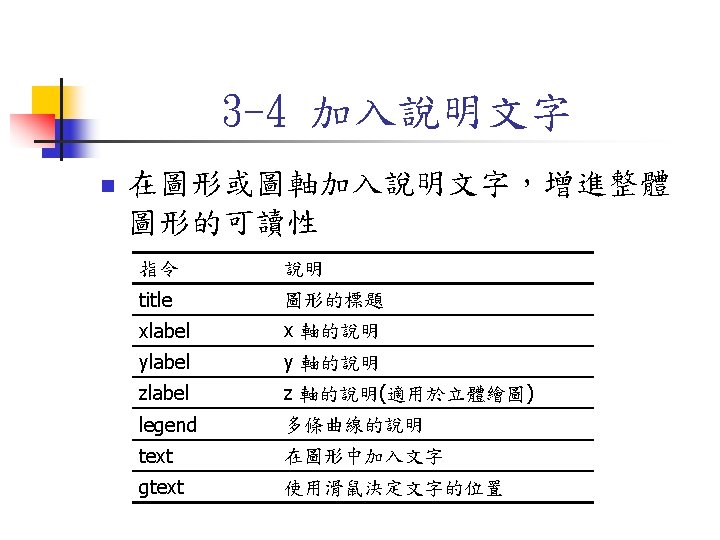
 n text指令 n n 使用語法: text(x, y, string) x、y :文字的起始座標位置 string :代表此文字")
;")

 n polar. Step 01. m n n Plots of r=cos(2 q) in")
: n n Wikipedia, Math. World polar. Rose 01. m")
: n n Wikipedia polar. Cardioid 01. m")
 n r=1+sin(q) n r=cos(2 q) n r=1+cos(q)")
: n n Wikipedia: English, Chinese lissajous 01. m")
=cos(2 t) & y(t)=sin(t)")
 y=sin(2*t) n n x=cos(2*t) y=sin(t)")
 n Spirograph n n Wikipedia: English, Chinese See exercise.")
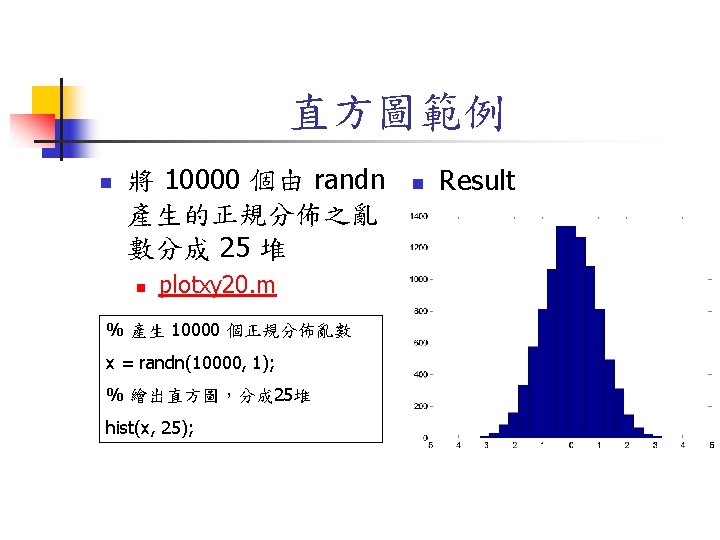
 n 直方圖逼近原資料的 機率密度函數,且資 料量越大時,逼近程 度越高 n=100000; bin=100; subplot(211); hist( rand(n, 1), bin);")
 n Comparison of histograms n n Result plotxy 202. m n=100000; subplot(231);")
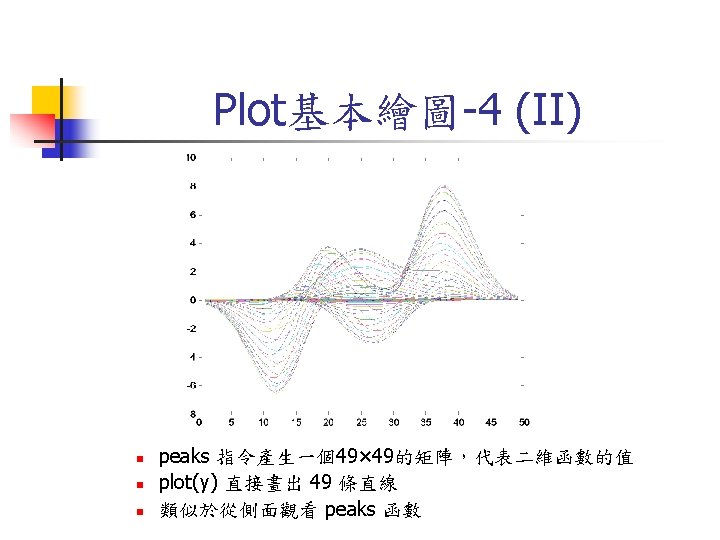
, k = 1~n ,其中 n 是")
- Slides: 78
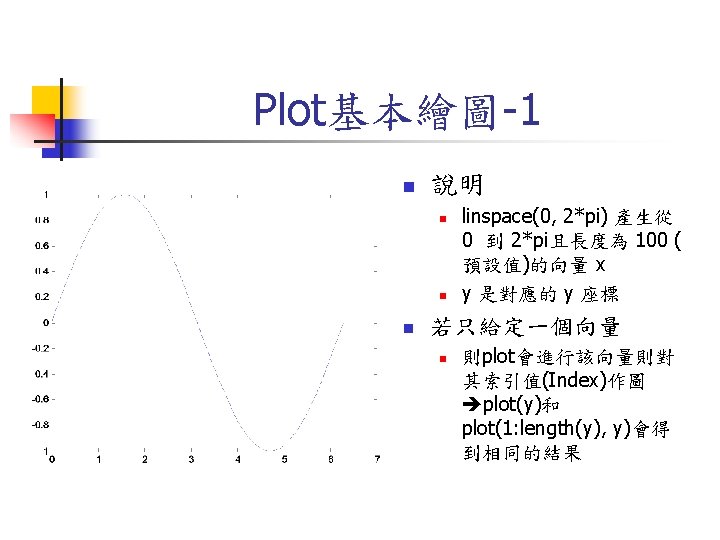
Plot基本繪圖-5 (II) Hint: Why plot(x, x’, x) generates a twisted mesh in the space? (Try it!)
Quiz n a=[1 2; 3 4] n n n plot(a) Plot(a, a’, a’, a)
Quiz n n x=cos(t) y=sin(t) n n x=2*sin(t) y=cos(t)
Coordinate Transformation Quiz! How to prove exp(jq)=cosq +j*sinq? Quiz!
Handle Graphics n n 事實上,我們可將畫出來的曲線看成一個物 件,並進而改變物件的性質。 新範例:plot. Via. Hg 01. m x=0: 0. 5: 4*pi; h=plot(x, sin(x)); % Plot a sin curve set(h, 'marker', 'o'); % Set marker to 'o' set(h, 'marker. Size', 15); % Set marker size to 15 set(h, 'line. Width', 5); % Set line width to 5 set(h, 'line. Style', ': '); % Set line style to dot set(h, 'marker. Edge. Color', 'g'); % Set marker edge color to green set(h, 'marker. Face. Color', 'y'); % Set marker face color to yellow
Handle Graphics n 結果如下:
Handle Graphics n n 我們也可以將所有性質一次塞進plot指令, 畢其功於一役。以下範例和前一個範例的效 果完全一樣: 新範例:plot. Via. Hg 02. m x=0: 0. 5: 4*pi; plot(x, sin(x), 'marker', 'o', 'marker. Size', 15, 'line. Width', 5, 'line. Style', ': ', 'marker. Edge. Color', 'g', 'marker. Face. Color', 'y');
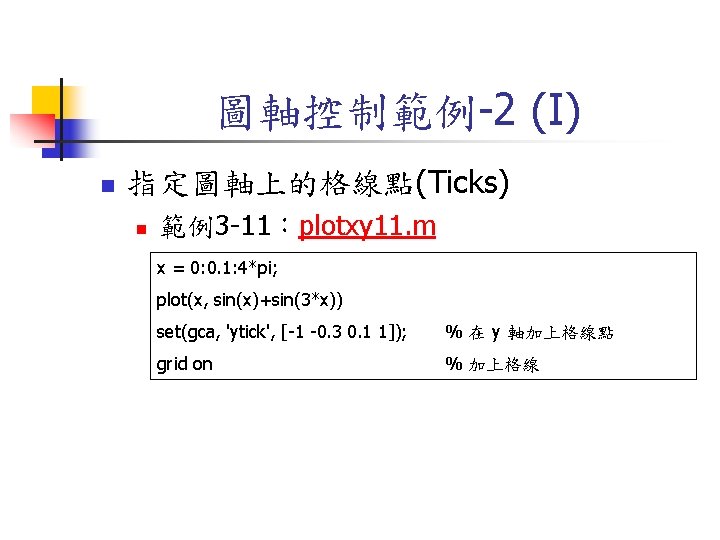
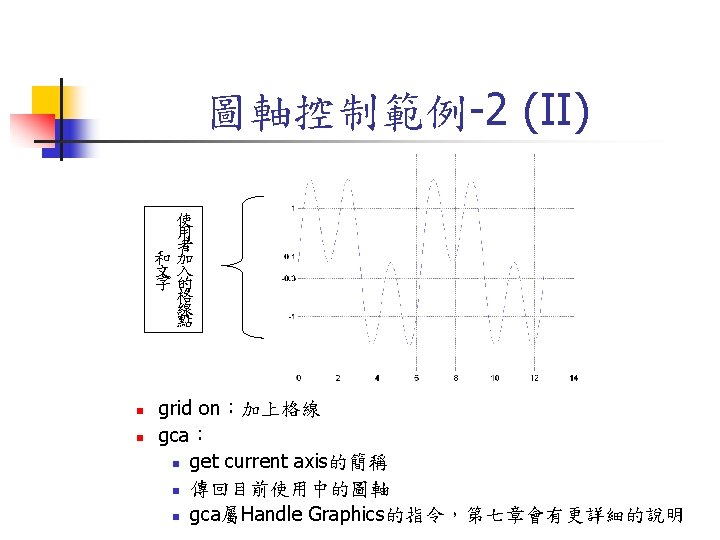
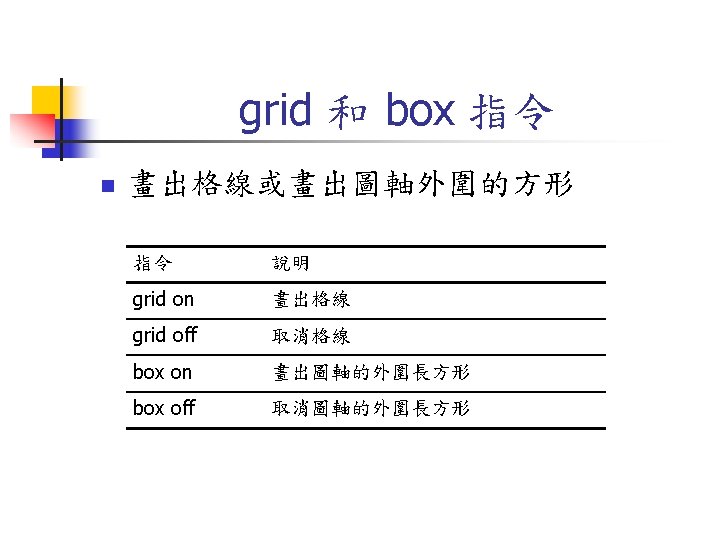
獨立顯示各軸的格線 n 我們可以獨立顯示雙 軸的格線 subplot(221); plot(humps); subplot(222); plot(humps); set(gca, 'xgrid', 'on'); subplot(223); plot(humps); set(gca, 'ygrid', 'on'); subplot(224); plot(humps); grid on; n Result
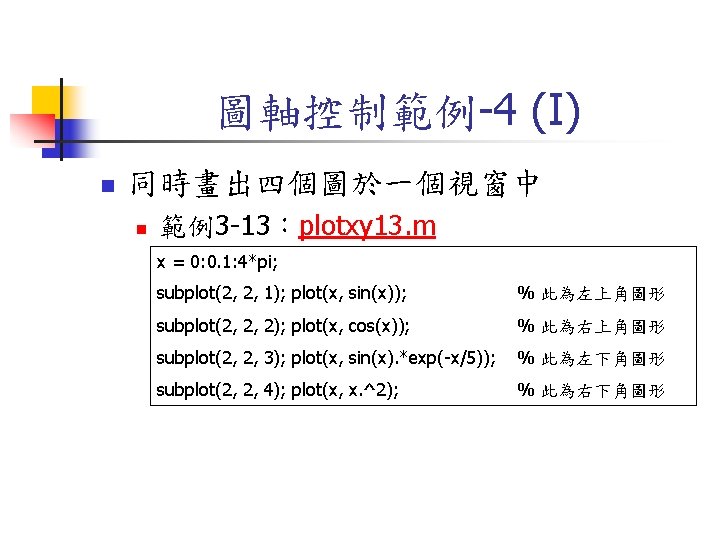
圖軸控制範例-4 (II) subplot(2, 2, 1) subplot(2, 2, 3) subplot(2, 2, 2) subplot(2, 2, 4)
圖軸控制範例-5 (I) n 長寬比(Aspect Ratio) n n n 一般圖軸長寬比是視窗的長寬比 可在 axis 指令後加不同的字串來修改 範例3 -14:plotxy 14. m t = 0: 0. 1: 2*pi; x = 3*cos(t); y = sin(t); subplot(2, 2, 1); plot(x, y); axis normal subplot(2, 2, 2); plot(x, y); axis square subplot(2, 2, 3); plot(x, y); axis equal subplot(2, 2, 4); plot(x, y); axis equal tight
圖軸控制範例-5 (II) axis normal axis equal axis square axis equal tight
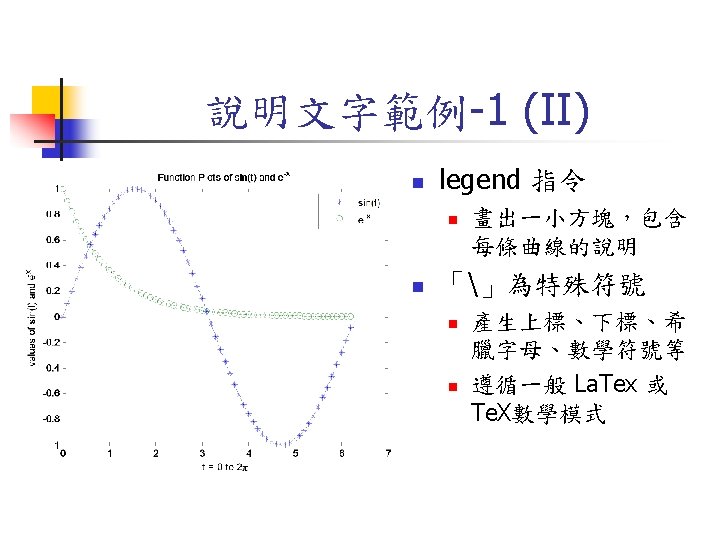
說明文字範例-1 (I) n 範例3 -15:plotxy 15. m subplot(1, 1, 1); x = 0: 0. 1: 2*pi; y 1 = sin(x); y 2 = exp(-x); plot(x, y 1, '--*', x, y 2, ': o'); xlabel('t = 0 to 2pi'); ylabel('values of sin(t) and e^{-x}') title('Function Plots of sin(t) and e^{-x}'); legend('sin(t)', 'e^{-x}');
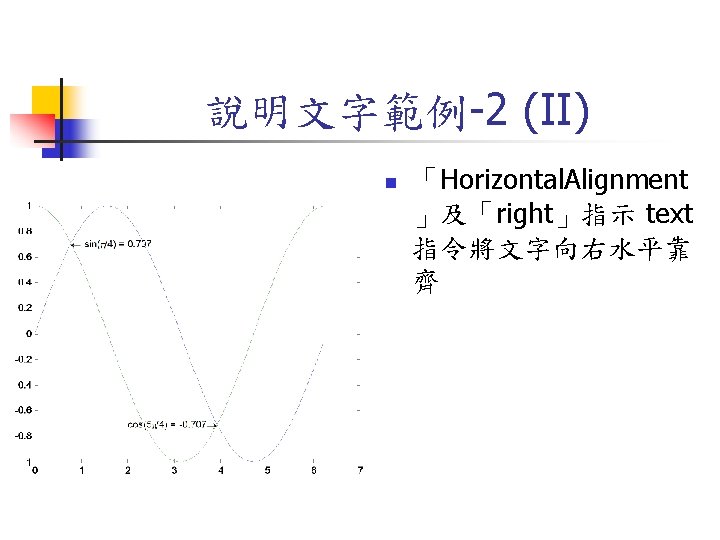
說明文字範例-2 (I) n text指令 n n 使用語法: text(x, y, string) x、y :文字的起始座標位置 string :代表此文字 範例3 -16:plotxy 16. m x = 0: 0. 1: 2*pi; plot(x, sin(x), x, cos(x)); text(pi/4, sin(pi/4), 'leftarrow sin(pi/4) = 0. 707'); text(5*pi/4, cos(5*pi/4), 'cos(5pi/4) = -0. 707rightarrow', 'Horizontal. Alignment', 'right');
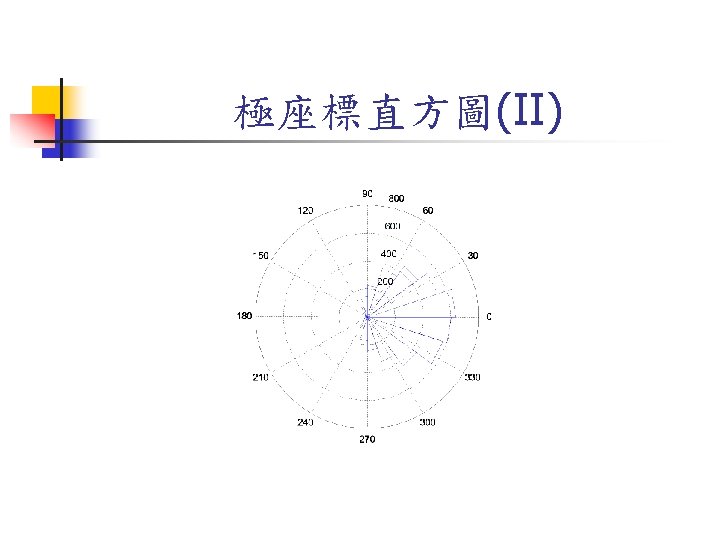
極座標圖形 n polar 指令 n n 產生極座標圖形 plotxy 19. m theta = linspace(0, 2*pi); r = cos(4*theta); % 進行極座標繪圖 polar(theta, r); n Result
如何顯示繪圖順序 n comet 指令 n n 產生動畫顯示 polar. Comet 01. m theta = linspace(0, 4*pi, 10001); r=cos(4*theta); x=r. *cos(theta); y=r. *sin(theta); comet(x, y); n Result
描點作圖以產生r=cos(2 q) n polar. Step 01. m n n Plots of r=cos(2 q) in Cartesian and polar coordinates Press enter to see how the plot is transformed from Cartesian to polar coordinates n Result
其他類似圖形:Rose n Rose (玫瑰線): n n Wikipedia, Math. World polar. Rose 01. m
其他類似圖形:Cardioid n Cardioid (心臟線): n n Wikipedia polar. Cardioid 01. m
Quiz n r=cos(q) n r=1+sin(q) n r=cos(2 q) n r=1+cos(q)
Lissajous Curve n Lissajous curve (利薩茹曲線): n n Wikipedia: English, Chinese lissajous 01. m
描點作圖以產生利薩茹曲線 n lissajous. Step 01. m n n Plots of x(t)=cos(2 t) & y(t)=sin(t) as the original and composite curves Press enter to see how the plot is combined from the original curves to the composite one n Result
Quiz n n x=cos(t) y=sin(2*t) n n x=cos(2*t) y=sin(t)
Spirograph (萬花尺) n Spirograph n n Wikipedia: English, Chinese See exercise.
直方圖比較 (1/2) n 直方圖逼近原資料的 機率密度函數,且資 料量越大時,逼近程 度越高 n=100000; bin=100; subplot(211); hist( rand(n, 1), bin); title('Uniform distribution'); subplot(212); hist(randn(n, 1), bin); title('Normal distribution'); n Result
直方圖比較 (2/2) n Comparison of histograms n n Result plotxy 202. m n=100000; subplot(231); x=rand(n, 1); hist(x, 100); subplot(232); x=rand(n, 1); hist(x. ^3, 100); subplot(233); x=rand(n, 1); hist(nthroot(x, 3), 100); subplot(234); x=randn(n, 1); hist(x, 100); subplot(235); x=randn(n, 1); hist(x. ^3, 100); subplot(236); x=randn(n, 1); hist(nthroot(x, 3), 100); Quiz!
羽毛圖 n feather指令 n n 向量起始點是 (k, 0), k = 1~n ,其中 n 是 向量個數 plotxy 24. m theta = linspace(0, 4*pi, 30); rho = 10; % 由極座標轉換至直角座標 [x, y] = pol 2 cart(theta, rho); % 繪製羽毛圖 feather(x, y); axis image n Result