Please log in to Ci 3 T org

 Models of Prevention to Meet")
 Models of Prevention • The Importance")
 represent a diverse and")

 Goal: Reduce Harm")
 ≈5% Tertiary Prevention")
 ≈5% Tertiary Prevention")
 ≈5% Tertiary Prevention")
 ≈5% Tertiary Prevention")


 What screening tools are available?")


 The SRSS is 7 -item mass screener used")
 2 0 1 0 0 11111 Lie, Cheat,")


 Lane, Oakes, Menzies, Major, Allegra, Powers and")


")


 Models of Support Low")


 Goal: Reduce Harm")
 Models of Support Low")


. Project support and include:")
. Project support and")
 Reading Intervention Students participate")
 Focus is on academic achievement, character")


 Models of Support Low")
 Goal: Reduce Harm")


")


- Slides: 94
Please log in to Ci 3 T. org … Presentations
Building and Installing Comprehensive, Integrated, Three-tiered (Ci 3 T) Models of Prevention to Meet Students’ Multiple Needs: An Overview Glendale, Arizona Kathleen Lynne Lane, Ph. D. , BCBA-D With thanks to Wendy P. Oakes, Holly M. Menzies, Jemma Robertson Kalberg, Robin Ennis, Emily Cantwell, David Royer, Eric Common, Abbie Jenkins, Meredith Cox, Liane Johl, Mallory Messenger, and other members of our Ci 3 T Research Team
Agenda • Comprehensive, Integrated, Three-tiered (Ci 3 T) Models of Prevention • The Importance of Systematic Screening • Using Screening Data. . . • implications for primary prevention efforts • implications for teachers • implications for student-based interventions at Tier 2 and Tier 3
Challenging Times • Students with emotional and behavioral disorders (EBD) represent a diverse and challenging group of students to teach (Forness, Freeman, Paparella, Kauffman, & Walker, 2011) • Historically as a field we have - viewed behavioral and social challenges to be within individual deficits (Landrum & Tankersley, 2013) - Relied on reactive approaches to address these challenges (Horner & Sugai, 2015) Internalizing Shift … Systems Level Perspective Externalizing ED … <6% EBD … 12%
Michael Yudin urged educators and educational system leaders to “pay as much attention to students’ social and behavioral needs as we do academics” … 2014 National PBIS Leadership Conference, Michael Yudin, Assistant Secretary for the Office of Special Education and Rehabilitation of the United States Department of Education
Comprehensive, Integrated, Three-Tiered Model of Prevention (Lane, Kalberg, & Menzies, 2009) Goal: Reduce Harm Specialized individual systems for students with high-risk Tertiary ≈5% Prevention (Tier 3) ≈15% Secondary Prevention (Tier 2) Goal: Prevent Harm School/classroom-wide systems for all students, staff, & settings Goal: Reverse Harm Specialized group systems for students at-risk PBIS Framework ≈80% Validated Curricula Primary Prevention (Tier 1) Academic Behavioral Social
Comprehensive, Integrated, Three-Tiered Model of Prevention (Lane, Kalberg, & Menzies, 2009) ≈5% Tertiary Prevention (Tier 3) ≈15% Rea d Secondary Prevention (Tier 2) ing Str eet Dis tr Hig ict & h Q Sta ual te S ity t Ins anda r tru ctio ds n ≈80% Primary Prevention (Tier 1) Academic Behavioral Social
Comprehensive, Integrated, Three-Tiered Model of Prevention (Lane, Kalberg, & Menzies, 2009) ≈5% Tertiary Prevention (Tier 3) ≈15% Secondary Prevention (Tier 2) Inte Posi rve tive ntio Be ns havi (PB and Su or IS) ppo rts ≈80% Primary Prevention (Tier 1) Academic Behavioral Social
Comprehensive, Integrated, Three-Tiered Model of Prevention (Lane, Kalberg, & Menzies, 2009) ≈5% Tertiary Prevention (Tier 3) ≈15% Secondary Prevention (Tier 2) n o i ct A e iv sit o P ≈80% Primary Prevention (Tier 1) Academic Behavioral Social
Comprehensive, Integrated, Three-Tiered Model of Prevention (Lane, Kalberg, & Menzies, 2009) ≈5% Tertiary Prevention (Tier 3) ≈15% Secondary Prevention (Tier 2) ≈80% Primary Prevention (Tier 1) Academic Behavioral Social
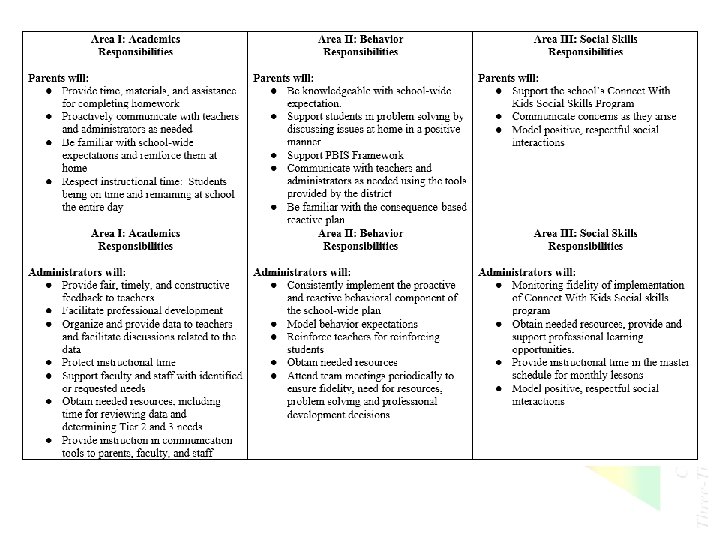
Primary Intervention Plan Statement Purpose Statement School-Wide Expectations 1. 2. 3. Area I: Academics Responsibilities Students will: *see Expectation Matrix Area II: Behavior Responsibilities Students will: Area III: Social Skills Responsibilities Students will: Faculty and Staff will: Parents will: Administrators will: Lane & Oakes 2012
t& c i tr e s i D tat S ards d n a St High y t i l a n Qu uctio tr s n I Positive Behavior Interventions and Supports (PBIS)
What do I need to know?
What do I need to know? Sample Elementary
Procedures for Teaching Faculty and Staff: Students: Parents/ Community: https: //youtu. be/b 4 swsa_kn. YE Lane & Oakes 2012
Procedures for Reinforcing Faculty and Staff: Students: Parents/ Community: Do Cou 1 bo n atio pon x of n for Mac to C omm aroni : and unit Chee y Fo od D se Laneriv &e. Oakes 2012
Ticket Examples
Reactive Plan
Essential Components of Primary Prevention Efforts Social Validity Treatment Integrity l a c i t i Cr r o f n o ati m r o f in nd a l o scho teams ct i r t s i d Systematic Screening Academic Behavior
Measure Aug Feb March April SRSS-IE Sept Oct Nov Dec Jan School Demographics Student Demographic Information Screening Measures Student Outcome Measures - Academic Student Outcome Measures - Behavior Program Measures Social Validity - PIRS Schoolwide Evaluation Tool (SET) CI 3 T Treatment Integrity May
See Lane, Menzies, Oakes, and Kalberg (2012) What screening tools are available?
Systematic Screener for Behavior Disorders (SSBD 2 nd ed. ; Walker, Severson, & Feil, 2014)
SSBD Screening Process Pool of Regular Classroom Students STAGE 1: TEACHER SCREENING on Externalizing and Internalizing Behavioral Disorders 3 Highest Ranked Pupils on Externalizing and on Internalizing Behavior Criteria PASS GATE 1 STAGE 2: TEACHER RATING on Critical Events Index and Combined Frequency Index Exceed Normative Criteria on CEI of CFI PASS GATE 2 STAGE 3: DIRECT OBSERVATION AND/ OR SARS of Process Selected Pupils in Classroom and on Playground Exceed Normative Criteria on AET and PSB PASS GATE 3 Pre-referral Intervention(s) Child may be referred to Child Study Team 28
SSBD Results – Winter 2007 through Winter 2009 Risk Status of Nominated Students 80 70 Internalizing Externalizing Number of Students 60 50 40 47 62 59 43 56 60 30 Exceeded Normative Criteria 20 10 17 13 7 0 Nominated But Did Not Exceed Criteria 6. 18% 3. 50% 7 3. 18% 8. 90% 13 6. 50% 6 2. 73% Winter 2007 Winter 2008 Winter 2009 (N=60) (N=69) (N=66) (N=60) (N=69) 1. 44%(N=66) % computed based on total # students screened Screening Time Point Source. Lane, Menzies, Oakes, & Kalberg, 20120. Figure 2. 2 WES Elementary Systematic Screening for Behavior Disorders (SSBD; Walker & Severson, 1992) results comparing the percentage of students nominated and exceeding normative criteria for both externalizing and internalizing behavior disorders over a three year period.
0 2 1 Low Academic Negative Aggressive Achievement Attitude Behavior Peer Problem Rejection SRSS Score: Sum Items 1 -7 (Range 0 - 21) Student Risk Screening Scale (SRSS) DATE TEACHER NAME 0 = Never 1= Occasionally 2 = Sometimes 3 = Frequently Use the above scale to rate each item for each student. Lie, Cheat, Steal Sneak Student Name Student ID Smith, Sally 11111 0 0 3 Drummond, T. (1994). Student Risk Screening Scale. Grants Pass, OR: Josephine County Mental Health Program. 7 0 0 0 0
Student Risk Screening Scale (Drummond, 1994) The SRSS is 7 -item mass screener used to identify students who are at risk for antisocial behavior. Uses 4 -point Likert-type scale: never = 0, occasionally = 1, sometimes = 2, frequently = 3 Teachers evaluate each student on the following items - Steal - Low Academic Achievement - Lie, Cheat, Sneak - Negative Attitude - Behavior Problems - Aggressive Behavior - Peer Rejection Student Risk is divided into 3 categories Low 0– 3 Moderate 4– 8 High 9 - 21 (SRSS; Drummond, 1994)
Student Risk Screening Scale (Drummond, 1994) 2 0 1 0 0 11111 Lie, Cheat, Behavior Low Academic Negative Aggressive Sneak Problem Peer Rejection Achievement Attitude Behavior Student ID Smith, Sally Student Name Steal SRSS Score: Sum Items 1 -7 (Range 0 - 21) DATE TEACHER NAME 0 = Never 1= Occasionally 2 = Sometimes 3 = Frequently Use the above scale to rate each item for each student. 1 3 7 0 0 0 0
Student Risk Screening Scale Middle School Fall 2004 - Fall 2011 n = 12 n = 20 Percentage of Students n = 507 N=534 N=502 N=454 N=470 N=477 N=476 N=524 N= 539 Fall Screeners Lane, K. L. , Oakes, W. P. , & Magill, L. (2014). Primary prevention efforts: How do we implemented and monitor the Tier 1 component of our Comprehensive, Integrated, Three-Tiered (CI 3 T) Model? Preventing School Failure. 58, 143 -158.
SAMPLE DATA: SRSS Middle School Study 1: Behavioral & Academic Characteristics of SRSS Risk Groups Variable Risk Low (n = 422) M (SD) Moderate (n = 51) M (SD) ODR 1. 50 (2. 85) 5. 02 (5. 32) 8. 42 (7. 01) L<M<H In-School Suspensions 0. 08 (0. 38) 0. 35 (1. 04) 1. 71 (2. 26) L<M<H GPA 3. 35 (0. 52) 2. 63 (0. 65) 2. 32 (0. 59) L>M, H M=H Course Failures 0. 68 (1. 50) 2. 78 (3. 46) 4. 17 (3. 49) L<M, H M=H Lane & Oakes High (n = 12) M (SD) (Lane, Parks, Kalberg, & Carter, 2007) Significance Testing
STUDENT RISK SCREENING SCALE High School: Behavioral & Academic Characteristics of SRSS Risk Groups Non-Instructional Raters Variable Risk Low Moderate (n = 328) (n = 52) High (n = 35) M (SD) Significance Testing 8. 27 (7. 72) 8. 97 (9. 39) L < M, H M=H 2. 45 (0. 84) 2. 38 (0. 88) L > M, H M=H M (SD) ODR 3. 53 (5. 53) GPA 3. 10 (0. 82) (Lane, Kalberg, Parks, & Carter, 2008)
Externalizing AUC 0. 952 Elementary Level Results: ROC Curves 1. 0 AUC = 0. 952 0. 6 an Ch ce 0. 4 0% =5 Sensitivity 0. 8 0. 2 0. 0 0. 2 0. 4 0. 6 0. 8 1. 0 1 - Specificity Lane, K. L. , Little, M. A. , Casey, A. M. , Lambert, W. , Wehby, J. H. , Weisenbach, J. L. , & Phillips, A. , (2009). A comparison of systematic screening tools for emotional and behavioral disorders: How do they compare? Journal of Emotional and Behavioral Disorders, 17, 93 -105.
Internalizing AUC. 802 Elementary Level Results: ROC Curves 1. 0 AUC =. 802 0. 8 ce an Ch 0. 4 0% =5 Sensitivity 0. 6 0. 2 0. 0 0. 2 0. 4 0. 6 1 - Specificity 0. 8 1. 0
STUDENT RISK SCREENING SCALE-IE Aggressive Behavior Lonely Negative Attitude Low Academic Achievement Obsessive-Compulsive Behavior Peer Rejection Behavior Problem Anxious Sad; Depressed Shy; Withdrawn Emotionally Flat Lie, Cheat, Sneak 0 = Never Steal TEACHER NAME 2 = Sometimes 3 = Frequently Use the above scale to rate each item for each student. Validation Study Student Name Original SRSS-IE 14 12 items retained for use at the elementary level 14 items under development in middle and high schools Self-Inflicts Pain 1= Occasionally
Convergent Validity: SRSS-E 7, SRSS-I 5, & SRSS-IE 12 with the SSBD Note. SSBD refers to the Systematic Screening for Behavior Disorders (Walker & Severson, 1992). SRSS-IE 5 refers to the version with 5 times retained. SRSS-IE 12 refers to the original 7 items from the SRSS developed by Drummond (1994) combined with the new five items constituting the SRSS-IE 5. The SRSS-E 7 refers to the original 7 items constituting the SRSS. Lane, K. L. , Oakes, W. P. , Harris, P. J. , Menzies, H. M. , Cox, M. L. , & Lambert, W. (2012) Initial evidence for the reliability and validity of the Student Risk Screening Scale for internalizing and externalizing behaviors at the elementary level. Behavioral Disorders, 37, 99 -122.
SRSS-IE: SRSS-E 7, SRSS-I 5 Cut Scores • Enter ‘practice’ data into that one sheet so that the total scores and conditional formatting are tested. • Items 1 -7 (The SRSS externalizing scale) 0– 3 4– 8 9 – 21 low risk moderate risk (yellow) high risk (red) • Items 8 -12 (The SRSS-IE internalizing items)*preliminary cut scores for elementary only 0 – 1 low risk 2 – 3 moderate (yellow) 4 – 15 high (red) • Confirm the “Count” column is completed (students’ numbered sequentially). Formulas are anchored by the “Count” column; it must contain a number for each student listed for accurate total formulas.
How do we score and interpret the SRSS-IE at the Elementary Level? • All scores will be automatically calculated. • SRSS scores are the sum of items 1 – 7 (range 0 – 21) • Internalizing scores are the sum of items 8 -12 (range 0 -15)
Sample Elementary School … Fall % of Students Screened SRSS-E 7 Results – All Students 100% 90% 80% 70% 60% 50% 40% 30% 20% 10% 0% N = 25 4. 56% 6. 93% N = 86 9. 97% 23. 82% N = 250 N = 35 N = 300 85. 47% 69. 25% School F 14 N = 16 School F 15 Time School Screening Point. F 16 Low Risk (0 -3) Moderate (4 -8) School F 17 High (9 -21)
Sample Elementary School … Fall 2015 SRSS-E 7 Comparison by Grade Level K 1 st 2 nd N Screened Low (0 -3) Moderate (4 -8) High (9 -21) 65 54 (83. 08%) 7 (10. 77%) 4 (6. 15%) 53 45 (84. 91%) 3 (5. 66%) 5 (9. 43%) 46 31 (67. 39%) 8 (17. 39%) 7 (15. 22%)
Sample Elementary School … Fall 2015 SRSS-E 7 Comparison by Grade Level 3 rd 4 th 5 th N Screened Low (0 -3) Moderate (4 -8) High (9 -21) 68 64 (94. 12%) 4 (5. 88%) 0 (0%) 57 52 (91. 23%) 5 (8. 77%) 0 (0%) 62 54 (87. 10%) 8 (12. 90%) 0 (0%)
Sample Elementary School … Fall % of Students Screened SRSS-I 5 Results – All Students 100% 90% 80% 70% 60% 50% 40% 30% 20% 10% 0% N = 72 N = 19 5. 41% 19. 94% N = 85 12. 25% N = 43 23. 55% N = 204 N = 289 82. 34% 56. 51% School F 14 School F 15 Time School Screening Point. F 16 Low Risk (0 -1) Moderate (2 -3) School F 17 High (4 -15)
Sample Elementary School … Fall 2015 SRSS-I 5 Comparison by Grade Level K 1 st 2 nd N Screened Low (0 -1) Moderate (2 -3) High (4 -15) 65 49 (75. 38%) 9 (13. 85%) 7 (10. 77%) 53 40 (75. 47%) 9 (16. 98%) 4 (7. 55%) 46 36 (78. 26%) 6 (13. 04%) 4 (8. 70%)
Sample Elementary School … Fall 2015 SRSS-I 5 Comparison by Grade Level 3 rd 4 th 5 th N Screened Low (0 -1) Moderate (2 -3) High (4 -15) 68 60 (88. 24%) 6 (8. 82%) 2 (2. 94%) 57 51 (89. 47%) 5 (8. 77%) 1 (1. 75%) 62 53 (85. 48%) 8 (12. 90%) 1 (1. 61%)
Sample High School … Fall % of Students Screened SRSS Results – All Students 100% 90% 80% 70% 60% 50% 40% 30% 20% 10% 0% 2. 42% 8. 02% N = 29 N = 96 N = 1072 89. 56% School F 15 School F 16 School F 17 School F 18 Screening Time Point N = 1197 Low Risk (0 -3) Moderate (4 -8) High (9 -21) School F 19
Sample High School … Fall 2015 SRSS Comparison by Grade Level N = 1197 Screened Low (0 -3) Moderate (4 -8) High (9 -21) 327 287 (87. 77%) 32 (9. 79%) 8 (2. 45%) 10 th 318 271 (85. 22%) 34 (10. 69%) 13 (4. 09%) 11 th 289 264 (91. 35%) 19 (6. 57%) 6 (2. 08%) 263 250 (95. 06%) 11 (4. 18%) 2 (0. 76%) 9 th 12 th
Student Risk Screening Scale –Early Childhood (SRSS-EC) Lane, Oakes, Menzies, Major, Allegra, Powers and Schatschneider (2015) 50
Screening … Considering the Logistics & Ci 3 T in Action
Examining your screening data … … implications for primary prevention efforts … implications for teachers … implications for student-based interventions See Lane, Menzies, Bruhn, and Crnobori (2011)
Social Skills Improvement System – Performance Screening Guide Spring 2012 – Total School 100% Adequate progress Moderate Difficulties Significant Difficulties 7. 14 11. 04 4. 49 90% N = 54 Percent of Students 80% 45. 60 N = 22 N = 35 47. 55 70% 36. 73 N = 31 6. 34 38. 24 60% N = 223 N = 233 N = 180 N = 187 50% N = 212 N = 235 N = 271 40% 30% 20% 43. 35 55. 42 47. 96 10% 56. 12 0% Reading Skills n = 489 Math Skills Prosocial Behavior Motivation to Learn n = 490 Subscales n = 489 Lane, K. L. , Oakes, W. P. , & Magill, L. (2013). Primary prevention efforts: How do we implemented and monitor the Tier 1 component of our Comprehensive, Integrated, Three-Tiered (CI 3 T) Model?
Student Risk Screening Scale Middle School Fall 2004 - Fall 2011 n = 12 Percentage of Students n = 20 n = 507 N=534 N=502 N=454 N=470 N=477 Fall Screeners N=476 N=524 N= 539 Lane & Oakes
Examining your screening data … … implications for primary prevention efforts … implications for teachers … implications for student-based interventions See Lane, Menzies, Bruhn, and Crnobori (2011)
Teacher-Level Considerations 1. Instructional Considerations 2. General Classroom Management 3. Low-intensity Strategies
Student Risk Screening Scale- Internalizing & Externalizing (SRSS-IE)
Examining Academic and Behavioral Data: Elementary School Level Lane, K. L. , Menzies, H. M. , Ennis, R. P. , & Oakes, W. P. (2015). Supporting Behavior for School Success: A Step-by-Step Guide to Key Strategies. New York, NY: Guilford Press.
Examining Academic and Behavioral Data: Middle and High School Level Lane, K. L. , Menzies, H. M. , Ennis, R. P. , & Oakes, W. P. (2015). Supporting Behavior for School Success: A Step-by-Step Guide to Key Strategies. New York, NY: Guilford Press.
Schoolwide Positive Behavior Support Comprehensive, Integrative, Three-tiered (CI 3 T) Models of Support Low Intensity Strategies Basic Classroom Management Effective Instruction Low Intensity Strategies Behavior Contracts Self-Monitoring - Functional Assessment-Based Interventions Higher Intensity Strategies Assess, Design, Implement, and Evaluate Assessment
Low-Intensity Strategies Opportunities to Respond Behavior Specific Praise Active Supervision Instructional Feedback Self-monitoring High p Requests Precorrection Incorporating Choice Behavior Contracts
Choice Active Supervision Behavior Specific Praise Increased OTRs Poster Session: Cantwell Consider a book study … Build school site capacity Lane, K. L. , Menzies, H. , Bruhn, A. , & Crnobori, M. (2011). Managing challenging behaviors in schools: Research-based strategies that work. New York, NY: Guilford Press.
Ci 3 T. org
Examining your screening data … … implications for primary prevention efforts … implications for teachers … implications for student-based interventions See Lane, Menzies, Bruhn, and Crnobori (2011)
Comprehensive, Integrated, Three-Tiered Model of Prevention (Lane, Kalberg, & Menzies, 2009) Goal: Reduce Harm Specialized individual systems for students with high-risk Tertiary ≈5% Prevention (Tier 3) ≈15% Secondary Prevention (Tier 2) Goal: Prevent Harm School/classroom-wide systems for all students, staff, & settings Goal: Reverse Harm Specialized group systems for students at-risk PBIS Framework ≈80% Validated Curricula Primary Prevention (Tier 1) Academic Behavioral Social
Schoolwide Positive Behavior Support Comprehensive, Integrative, Three-tiered (CI 3 T) Models of Support Low Intensity Strategies Basic Classroom Management Effective Instruction Low Intensity Strategies Behavior Contracts Self-Monitoring - Functional Assessment-Based Interventions Higher Intensity Strategies Assess, Design, Implement, and Evaluate Assessment
BASC 2 – Behavior and Emotional Screening Scale Spring 2012 N = 24 Percent of Students 100% 90% 80% 70% 60% 50% 40% 30% N = 67 Normal Elevated 3. 85 10. 74 Extremely Elevated 5. 45 3. 65 8. 68 12. 38 2. 46 11. 33 N = 533 85. 42 87. 67 82. 18 86. 21 20% 10% 0% Total N = 624 Sixth n = 219 Seventh Subgroup n = 202 Eighth n = 203
A Step-by-Step Process Step 1: Construct your assessment schedule Step 2: Identify your secondary supports �Existing and new interventions Step 3: Determine entry criteria �Academic screening scores, progress data, behavior screening scores, attendance data, etc. Step 4: Identify outcome measures �Pre and post tests, CBM, office discipline data, GPA, etc. Step 5: Identify exit criteria �Reduction of discipline contacts, academic success, reduction of truancies and absences, etc. Step 6: Consider additional needs
Examining Academic and Behavioral Data: Elementary School Level Lane, K. L. , Menzies, H. M. , Ennis, R. P. , & Oakes, W. P. (2015). Supporting Behavior for School Success: A Step-by-Step Guide to Key Strategies. New York, NY: Guilford Press.
Examining Academic and Behavioral Data: Middle and High School Level Lane, K. L. , Menzies, H. M. , Ennis, R. P. , & Oakes, W. P. (2015). Supporting Behavior for School Success: A Step-by-Step Guide to Key Strategies. New York, NY: Guilford Press.
Sample Secondary Intervention Grid Support Description Schoolwide Data: Entry Criteria Data to Monitor Progress Exit Criteria mod to high risk Academic: 2 or more missing assignments with in a grading period completion, or other behavior addressed in contract Treatment Integrity Social Validity Completion of behavior contract Students who score in the abnormal range for H and CP on the SDQ; course failure or at risk on CBM Work completion and accuracy in the academic area of concern; passing grades Passing grade on the report card in the academic area of concern Sample Secondary Intervention Grid. Successful Behavior: SRSS Work Behavior Contract A written agreement between two parties used to specify the contingent relationship between the completion of a behavior and access to or delivery of a specific reward. Contract may involve administrator, teacher, parent, and student. Selfmonitoring Students will monitor and record their academic production (completion/ accuracy) and on-task behavior each day. Treatment Integrity
An illustration Support Description Small group reading instruction with selfmonitoring Small group reading instruction (30 min, 3 days per week). Students monitored their participation in the reading instructional tasks. Students used checklists of reading lesson components each day to complete and compare to teachers’ rating. K – 1. Schoolwide Data: Entry Criteria Students who: Behavior: Fall SRSS at moderate (4 -8) or high (9 – 21) risk Academic: Fall AIMSweb LNF at the strategic or intensive level Data to Monitor Progress: AIMSweb reading PSF and NWF progress monitoring probes (weekly). Daily selfmonitoring checklists Treatment Integrity Social Validity Exit Criteria Meet AIMSweb reading benchmark at next screening time point. Low Risk on SRSS at next screening time point.
Small group Reading Instruction with Self. Monitoring Lane, K. L. , & Oakes, W. P. (2012). Identifying Students for Secondary and Tertiary Prevention Efforts: How do we determine which students have Tier 2 and Tier 3 needs? In preparation.
First Grade Students’ Self Monitoring Form Altmann, S. A. (2010). Project support and include: the additive benefits of self-monitoring on students’ reading acquisition. Unpublished master’s thesis, Vanderbilt University.
Treatment Integrity Social Validity Monitor student progress Altmann, S. A. (2010). Project support and include: the additive benefits of self-monitoring on students’ reading acquisition. Unpublished master’s thesis, Vanderbilt University.
Support Description Schoolwide Data: Entry Criteria READ 180 (Stage C) Reading Intervention Students participate in a 50 (1) Students in min reading instructional grades 9 – 12. block during their study hall (2) Reading period. Students meet in the performance basic computer lab for or below basic on participation in the online state assessment portion 20 min daily. (but above 4 th grade Instruction is relevant to reading level). high school students. (3) SRSS risk scores Students use a progress in the moderate management system to range (4 – 8). monitor and track their own progress. Instruction is taught by special education teachers and general education teachers with training in the READ 180 Curriculum. Lane, K. L. , Oakes, W. P. , Menzies, H. M. , Oyer, J. , & Jenkins, A. (2013). Working within the context of three-tiered models of prevention: Using school wide data to identify high school students for targeted supports. Journal of Applied School Psychology, 29, 203 -229. Data to Monitor Progress: Student Measures: Meeting individual READ 180 reading goals: (1) Progress Monitoring with Scholastic Reading Inventory (2) Writing Assessments (3) formative assessments (vocabulary, comprehension and spelling) (4) Curriculum-based Assessments (5) Attendance in class Treatment Integrity: Teachers monitor performance and attendance in class. Completion of weekly checklists for activities completed. Social Validity: Students and teachers complete surveys Exit Criteria Students meet instructional reading goals. SRSS score in the low risk category (0 – 3) on the next screening time point.
Support Description Mentoring Program (Sophomor es/ Juniors/ Seniors) Focus is on academic achievement, character development, problemsolving skills, improving self -esteem, relationships with adults and peers, and school attendance. Volunteer teachers serve as mentors; meeting weekly (30 – 60 min) with students during the school day. Schoolwide Data: Entry Criteria (1) 10 th/11 th/ 12 th graders (2) Behavior: SRSS: High (9 -21) or Moderate (4 -8) by either 2 nd or 7 th period teacher ODR ≥ 2 Absences ≥ 5 days in one grading period (3) Academic: GPA ≤ 2. 75 Lane, K. L. , Oakes, W. P. , Menzies, H. M. , Oyer, J. , & Jenkins, A. (2013). Working within the context of three-tiered models of prevention: Using school wide data to identify high school students for targeted supports. Journal of Applied School Psychology, 29, 203 -229. Data to Monitor Progress: Exit Criteria Student Measures: Yearlong support (1) Increase of GPA at mid-term and semester Students who no report cards. longer meet criteria (2) Decrease of ODR next fall monitored weekly. (3) Reduced absences Seniors: graduation (fewer than one per quarter) Treatment Integrity: Mentors complete weekly mentoring checklists to report meeting time and activities. Social Validity: Pre and post surveys for students and mentors.
Support Description Schoolwide Data: Entry Criteria Data to Monitor Progress: Exit Criteria Targeted Direct, targeted instruction of (1) 12 th graders Student Measures: Algebra II Grade Algebra II learning targets by (2) Algebra II grade Algebra II classroom increases to Study Hall math teachers. drops below a 75 at grades satisfactory level Time will be used to re-teach any point in the Daily class average if (above 75%). concepts, provide one-onsemester grade is ≤ 75 one or small group (3) Have study hall Treatment Integrity: instruction and offer greater time available and Daily monitoring of the supports for students permission of 5 th lessons covered and struggling to pass the period teacher student attendance graduation requirement (4) Self-selecting to Social Validity: Pre and course. engage in study hall Post Student Surveys 50 min per day until exit criteria is met. Lane, K. L. , Oakes, W. P. , Menzies, H. M. , Oyer, J. , & Jenkins, A. (2013). Working within the context of three-tiered models of prevention: Using school wide data to identify high school students for targeted supports. Journal of Applied School Psychology, 29, 203 -229.
Ci 3 T. org
Schoolwide Positive Behavior Support Comprehensive, Integrative, Three-tiered (CI 3 T) Models of Support Low Intensity Strategies Basic Classroom Management Effective Instruction Low Intensity Strategies Behavior Contracts Self-Monitoring - Functional Assessment-Based Interventions Higher Intensity Strategies Assess, Design, Implement, and Evaluate Assessment
Comprehensive, Integrated, Three-Tiered Model of Prevention (Lane, Kalberg, & Menzies, 2009) Goal: Reduce Harm Specialized individual systems for students with high-risk Tertiary ≈5% Prevention (Tier 3) ≈15% Secondary Prevention (Tier 2) Goal: Prevent Harm School/classroom-wide systems for all students, staff, & settings Goal: Reverse Harm Specialized group systems for students at-risk PBIS Framework ≈80% Validated Curricula Primary Prevention (Tier 1) Academic Behavioral Social
Changes in Harry’s Behavior Baseline 1 Intervention 1 Baseline 2 Intervention 2 100 90 Percentage of AET 80 70 60 50 40 30 20 10 0 4/27 4/28 4/29 4/30 5/5 5/10 5/13 5/14 5/17 5/18 5/19 5/20 5/21 5/24 5/25 5/26 5/27 5/28 Date of Session Cox, M. , Griffin, M. M. , Hall, R. , Oakes, W. P. , & Lane, K. L. (2012). Using a functional assessment-based intervention to increase academic engaged time in an inclusive middle school setting. Beyond Behavior, 2, 44 – 54.
A Step-by-Step Process Step 1: Construct your assessment schedule Step 2: Identify your secondary supports �Existing and new interventions Step 3: Determine entry criteria �Nomination, academic failure, behavior screening scores, attendance data etc. Step 4: Identify outcome measures �Pre and post tests, CBM, office discipline data, GPA etc. Step 5: Identify exit criteria �Reduction of discipline contacts, academic success, reduction of truancies and absences etc. Step 6: Consider additional needs
Getting Started with Systematic Screening …
Recommendations to Consider • Recommendation #1: Build Stakeholders’ Expertise • Recommendation #2: Develop the Structures to Sustain and Improve Practices • Recommendation #3: Conduct Screenings in a Responsible Fashion • Recommendation #4: Consider Legal Implications- know your state laws (Lane & Oakes, 2012)
Session 1: 2 hr Session 3: 2 hr Session 2: full day Session 4: Full Day Session 5: 2 hr Session 6: Full Day Building Tier 2 Supports Building Tier 3 Supports Prepare to Implement CI 3 T Models: An Overview HW Building the Primary Prevention Plan H W How to Share Monitor Screeners the Plan Complete Share Overview with Faculty & Staff; Build Reactive Plan Finalize & Share Expectation Matrix and Teaching & Reinforcing Components Assessment Schedule H W Share CI 3 T plan; Complete PIRS & Secondary Grid H W Share revised CI 3 T plan; Complete CI 3 T Feedback Form
Session 5: Overview of Teacher focused Strategies Overview of Student Focused Strategies Using data to determine Draft the Secondary Intervention Grid based on existing supports Session 4: Revise Primary Plan using Stakeholder feedback Prepare presentation Additional Professional Development on Specific Topics tation n e m Imple f Tier 2 o Stages hin CI 3 T wit and 3 Session 6: Final revisions of CI 3 T Plan based on stakeholder feedback Draft Tertiary Prevention Intervention Grids Design Implementation Manual and Plan for roll out to faculty, students, and parents CI 3 T: Tertiary Prevention Overview of CI 3 T Prevention Models Setting a Purpose Establish team meetings and roles Session 2: Mission and Purpose Establish Roles and Responsibilities Procedures for Teaching Procedures for Reinforcing Reactive Plan Session 3: Procedures for Monitoring MTSS: CI 3 T Training Series CI 3 T: Secondary Prevention CI 3 T: Primary Prevention CI 3 T Team Training Sequence Session 1: Core Content Curriculum Check In - Check Out Functional Assessmentbased Interventions Reading, Math, Writing Benchmarking and Progress Monitoring Tools Student Driven Interventions, Strategies, & Practices Additional Tier 3 Supports Teacher Drive Supports: Instructional Techniques to Improve Students’ Motivation; General Classroom Management Practices; Low Intensity Behavior Supports
The Professional Development Installa tion Training Series November January December 3: Two-Hour After School 1: Two-Hour After School Share Overview Finalize & Share with Faculty & 2: Full Day Expectation Matrix and Staff; Build Teaching & Reinforcing Reactive Plan Components March February Tertiary Prevention Series 6: Full Day Share Screeners Complete Assessment Schedule Share CI 3 T plan; Complete PIRS & Secondary Grid Share revised CI 3 T plan; Complete CI 3 T Feedback Form Primary Prevention Series Secondary 5: Two-Hour After School 4: Full Day February November April Primary March Primary May January Secondary Teritiary Secondary Prevention Stand Alone Sessions Teritiary November December February January Figure 5. Comprehensive, Integrated, Three-tiered (CI 3 T) Models of prevention training sequence. Lane, K. L. , Oakes, W. P. , Jenkins, A. , Menzies, H. M. , & Kalberg, J. R. (2014). A team-based process for designing Comprehensive, Integrated, Three-Tiered (CI 3 T) Models of CI 3 T Training Project 89 Prevention: How does my school-site leadership team design a CI 3 T model? Preventing School Failure, 2014 -2015 58, 129 -142. DOI: 10. 1080/1045988 X. 2014. 893976
USD 497 MTSS-CI 3 T Model of Support ≈5% High Tertiary Support (Tier 3) ≈15% Secondary Support (Tier 2) Support Intensity Positive Behavioral Interventions and Supports (PBIS) Framework Validated Core Resource ELA Math ≈80% Validated Curricula Primary Support (Tier 1) Low Academic Behavioral Social CI 3 T – Comprehensive Integrated 3 Tiered Model of Prevention (Lane, Kalberg, & Menzies, 2009).
2015 -2016 Professional Learning Offerings Installa tion
Monthly Faculty Presentations For Faculty & Staff During the Work Day 8 AM: Behavior Specific Praise
PBIS. org On Demand Resources • Very useful to find research on specific interventions • Power. Point presentations are available for some interventions • Training modules are available on PBIS aspects and interventions • Some tools and measures are available to be viewed • Quick FAQs on secondary and tertiary interventions
Moving Forward … thank you! Kathleen. Lane@ku. edu Learning outcomes: Participants will learn how systematic screening data can be used to 1. examine students’ overall performance 2. inform low-intensity teacher-level interventions 3. connect students to Tier 2 and 3 supports.