PLANETARY XRAY AURORAS Randy Gladstone Southwest Research Institute


![Bunce et al. [2004] 5000 km High IMF, fast flow simulation of pulsed reconnection](https://slidetodoc.com/presentation_image_h/30f9606d91d011cf2664aebde74448dd/image-11.jpg "Bunce et al. [2004] 5000 km High IMF, fast flow simulation of pulsed reconnection")
 Fe. XVII (0. 70 -0. 75 &")


- Slides: 21
PLANETARY X-RAY AURORAS Randy Gladstone Southwest Research Institute San Antonio, TX USA European Planetary Science Congress 21 September 2006 Berlin
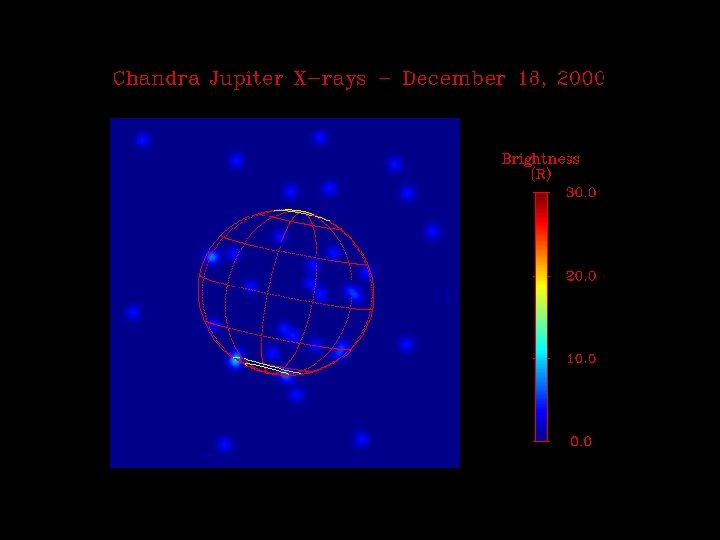
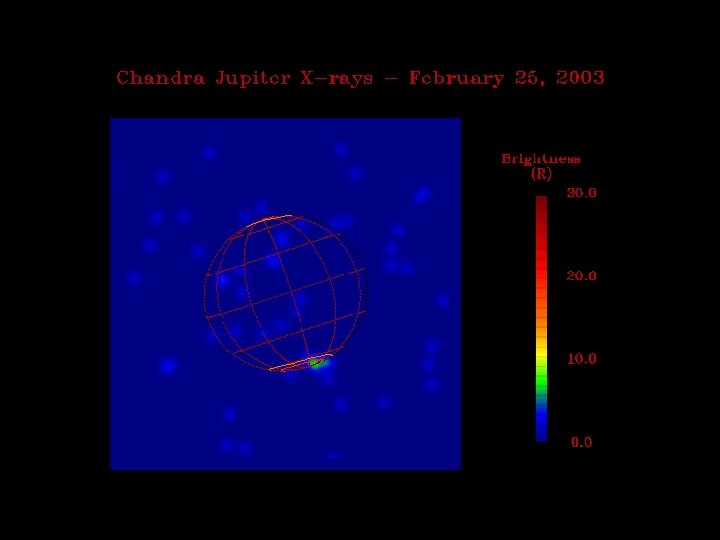
Saturn: • No clear auroral signature seen Jupiter: • Chandra HRC-I x-ray observations of Jupiter in Dec. 2000 and Feb. 2003 reveal an erratically pulsating hot spot with a luminosity of ~1 GW, located near the region expected for the cusp • The Jovian x-ray emissions result from heavy ion (O & S) precipitation from just within the magnetosphere (with a possible contribution from ions originating in the solar wind) • XMM-Newton observations show specific emission lines and indicate an electron bremsstrahlung component at energies >2 ke. V Earth: • Energetic auroral x-rays due to electron bremsstrahlung • To investigate the possibility of ion emissions at Earth, Chandra HRC observations were made of Earth’s cusp region in 2003 and 2004
SATURN
Saturn Observations: Initial Chandra & XMM observations showed no aurora [Ness et al. 2004 a; b]. A hint of aurora appears on Jan. 20, 2004, but is not statistically significant. Instead of correlating with FUV emissions observed by HST, the x-rays match the variability of a fortuitous solar flare [Bhardwaj et al. 2005; Clarke et al. 2005].
JUPITER
Polar brightness maps in latitude & system III longitude, from Dec. 2000. The north hot spot is near 67ºN, III=170º; the south hot spot drifts like the 7. 8 m hot spots seen by Caldwell et al. [1988].
2000 North 2003 South The distinct 45 -minute pulsation period observed in Dec. 2000 (above) was not seen in Feb. 2003 (right), or in XMM data from Apr. and Nov. 2003. The pulsations are still there, but they aren’t nearly as regular as when first detected [Elsner et al. 2005]
Simultaneous Chandra ACIS x-ray pulse & HST-STIS FUV flare
Bunce et al. [2004] 5000 km High IMF, fast flow simulation of pulsed reconnection at magnetopause produces good agreement with Chandra/STIS flare observations ion precipitation electron precipitation 5000 km
OVII (0. 55 -0. 60 ke. V) Fe. XVII (0. 70 -0. 75 & 0. 80 -0. 85 ke. V) OVIII (0. 63 -0. 68 ke. V) Mg. XI (1. 30 -1. 40 ke. V) Smoothed XMM EPIC images of Jupiter in narrow spectral bands: Auroral emissions due to precipitating O ions are easily distinguished from reflected solar x-ray lines at higher energies [Branduardi. Raymont et al. 2006]
White: North aurora Blue: South aurora Purple: Disk XMM-Newton EPIC spectra from Nov. 2003 observations of Jupiter. Data points for the North and South aurorae are in white and blue, respectively; purple is for non-auroal disk emissions. At >2 ke. V, bremsstrahlung dominates. [Branduardi-Raymont et al. 2006]
EARTH
PIXIE Earth Observations: 2 -12 ke. V, low spatial resolution
Chandra Earth Observations: 0. 1 -10 ke. V, with very high spatial resolution (0. 5", ~0. 3 km from apogee) Observation Plan: Point at fixed RA & DEC, let Earth drift through FOV (30'× 30'); aim for cusp * at various LTs
Chandra Earth Observations 2/7/03 12/16/03 1/6/04 1/24/04 1/30/04 2/15/04 2/28/04 3/4/04 3/7/04 4/10/04 4/13/04
Chandra Earth Observations 2/7/03 12/16/03 1/6/04 1/24/04 1/30/04 2/15/04 2/28/04 3/4/04 3/7/04 4/10/04 4/13/04
smoothed by 40× PSF for better SNR
Estimated X-ray Brightness from Chandra Observation: 1273 counts in 20 minutes, from 500× 500 pixel area on bright arc (pixels are 0. 132" across); use Aeff ~ 100 cm 2 Ex ~ 1273/(20*60)/100/ (500*0. 132/2. 06 e 5)2 ~ 1. 0 e 5 photons/cm 2/s/sr Þ Observed emissions are completely consistent with electron bremsstrahlung
Summary: • Jupiter hot spot x-ray emissions are consistent with Me. V oxygen precipitation associated with pulsed reconnection of nearmagnetopause plasma into the cusp, as suggested by Bunce et al. [2004] and Cravens et al. [2003] • Upcoming Jupiter observations in support of New Horizons flyby in Feb. 2007; 108 ks Chandra time, 72 ks XMM time • Earth x-ray emissions show a variety of forms, from bright arcs to diffuse blobs • The only Earth x-ray data for which nearly coincident particle exist (January 24, 2004) indicate that electron bremsstrahlung can explain the observed x-ray brightness (no need for heavy ions) • Future Earth observations unlikely