Place additional text if needed here A guide


- Slides: 30
Place additional text if needed here A guide for ASU presentations including tips on how to say more with less
Preview your main points • Colors • Data • Images • Charts
Part I: Knowing the ASU color palette
The color palette R 140 G 29 B 64 #8 C 1 D 40 R 255 G 198 B 39 #FFC 627 R 92 G 102 B 112 #5 C 6670 R 255 G 255 B 255 R 0 G 0 B 0 The ASU colors have been programed in the color picker pull-down menu. Select no more than two or three colors to use per slide to avoid making your slide look like a rainbow…a very ugly ASU rainbow.
Part II: Slides that have data and main points
Avoid bullet points; instead, aim for one point per slide.
Seems odd; but, trust me—I know what I’m doing here. “If you absolutely must have two things on one slide (e. g. , a point and a quote), remember to place one of those in a space like this that will draw your audience’s attention. ” – Aristotle
You might end up with five times as many slides as you would otherwise. “But that is perfectly OK because your slides are simpler and you will move through them quicker. ” – Barack Obama
Over 90 percent of college students agree…
…slides with less text on them actually say more.
Use text color to emphasize an important point.
You may also use a box like this to emphasize an important point.
Be sure to use Arial, it is ASU brand approved and standard on both PCs and Macs.
100 percentage of audience members who are engaged by Power. Point presentations that are clear and simple
25 percentage of all audience members who would rather write a dissertation than watch a presentation with 5+ bullet points per slide 2 number of times audience members will fall asleep during a Power. Point presentation that has 5+ bullet points per slide
Part III: Slides that use images
For the most dramatic effect, use no more than one image per slide.
Use large, high-quality images (images that do not become blurry, fuzzy or pixelated when enlarged on a Power. Point slide).
To resize an image, always use the resizing tool on an image’s corner (versus its side); this prevents the image from having a “stretched” appearance.
You may download ASU images for your unit’s print and electronic needs from asu. photoshelter. com. Please email andy. delisle@asu. edu to request access.
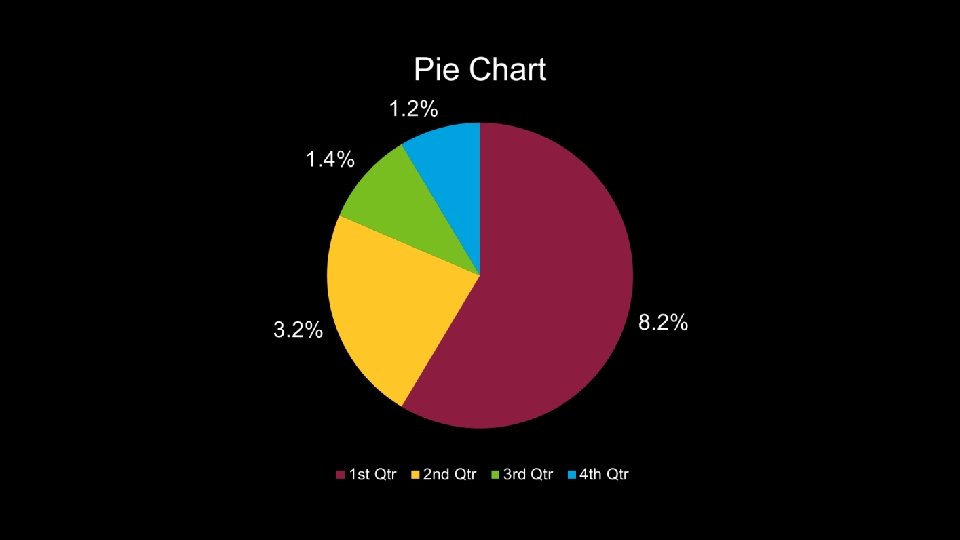
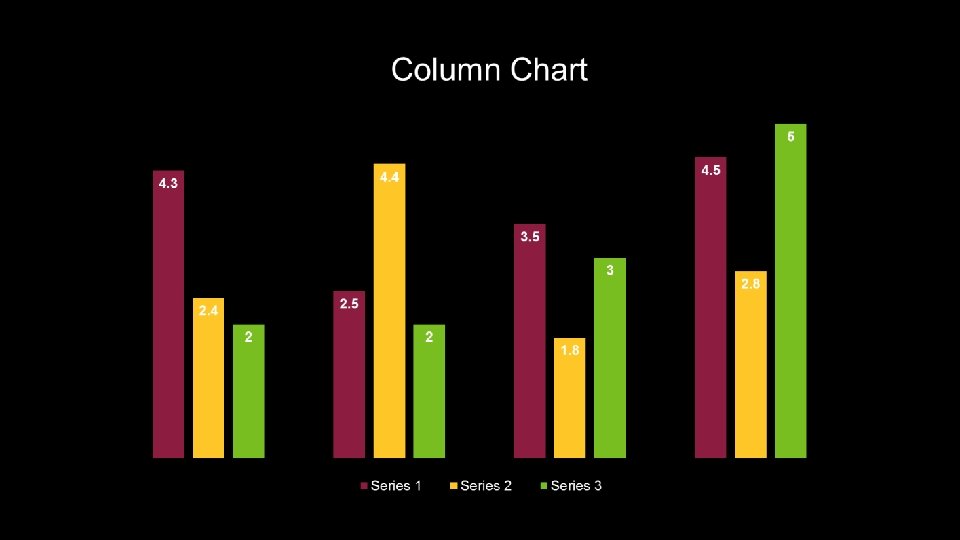
Part IV: Slides that use charts
Sometimes you will need to represent ideas in the form of a chart or graph.
For the greatest impact, use the simplest possible representation; for example…
Use shapes and ASU colors 94% 78% Rated experience good or enjoyable Will return
Line Chart 6 5 4 3 2 1 0 Category 1 Category 2 Series 1 Series 2 Category 3 Series 3 Category 4
solutions-oriented impact entrepreneurial decisive visionary excellence access a New American University bold create imaginative re-envision
Restate your main points • Colors • Data • Images • Charts
Thank you! Contact info or website url here