
PJM Capacity Market Stu Bresler VP Market Operations

PJM Capacity Market Stu Bresler VP, Market Operations PJM© 2011
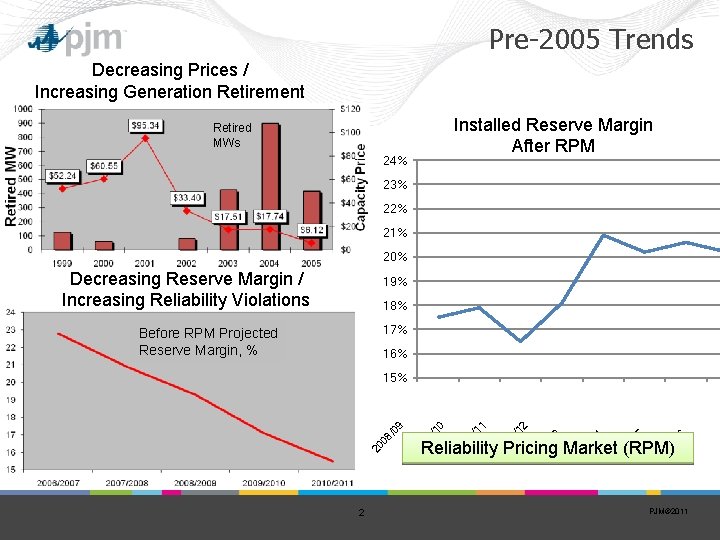
Pre-2005 Trends Decreasing Prices / Increasing Generation Retirement Retired MWs 24% Installed Reserve Margin After RPM 23% 22% 21% 20% Decreasing Reserve Margin / Increasing Reliability Violations 19% 18% 17% Before RPM Projected Reserve Margin, % 16% 20 08 /0 9 20 09 /1 0 20 10 /1 1 20 11 /1 2 20 12 /1 3 20 13 /1 4 20 14 /1 5 20 15 /1 6 15% 2 Reliability Pricing Market (RPM) PJM© 2011
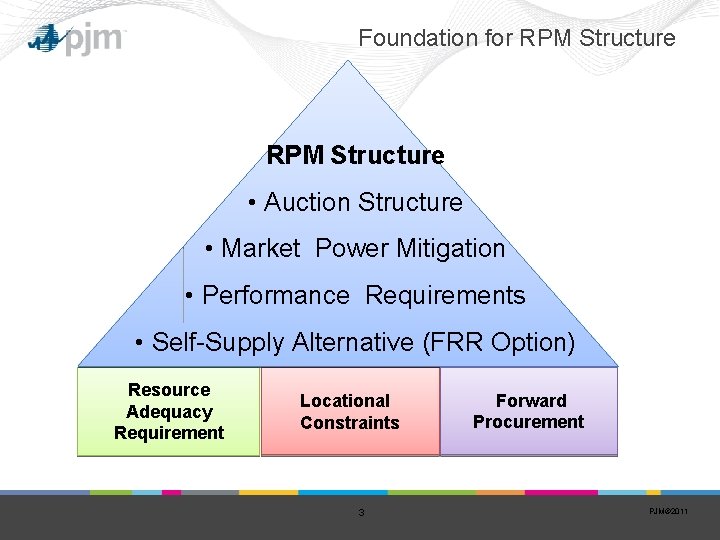
Foundation for RPM Structure • Auction Structure • Market Power Mitigation • Performance Requirements • Self-Supply Alternative (FRR Option) Resource Adequacy Requirement Locational Constraints 3 Forward Procurement PJM© 2011
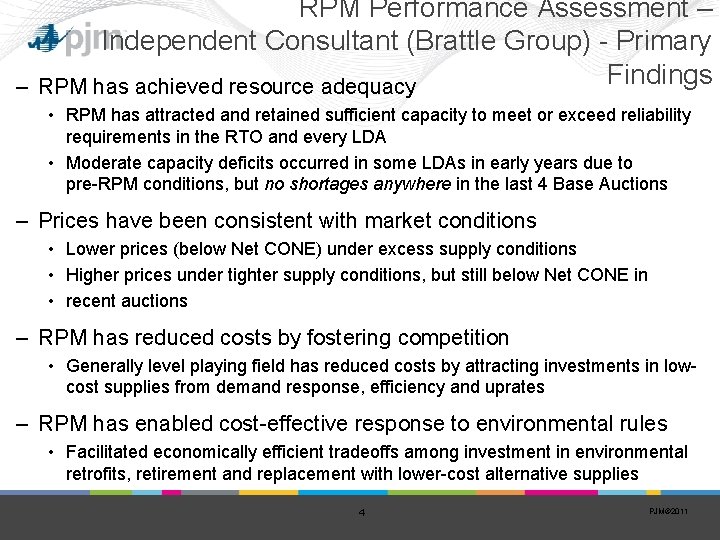
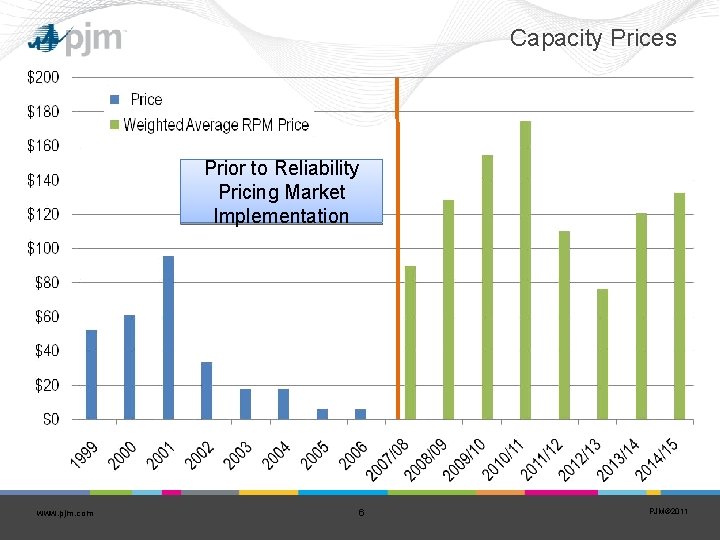
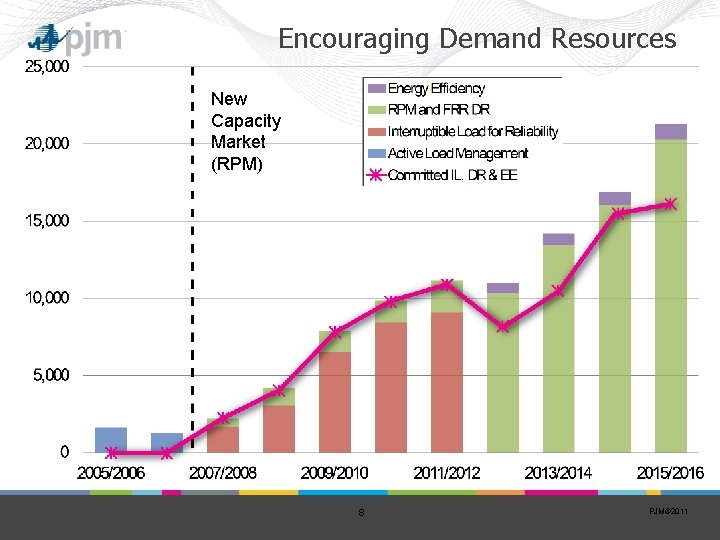
RPM Performance Assessment – Independent Consultant (Brattle Group) - Primary Findings – RPM has achieved resource adequacy • RPM has attracted and retained sufficient capacity to meet or exceed reliability requirements in the RTO and every LDA • Moderate capacity deficits occurred in some LDAs in early years due to pre-RPM conditions, but no shortages anywhere in the last 4 Base Auctions – Prices have been consistent with market conditions • Lower prices (below Net CONE) under excess supply conditions • Higher prices under tighter supply conditions, but still below Net CONE in • recent auctions – RPM has reduced costs by fostering competition • Generally level playing field has reduced costs by attracting investments in lowcost supplies from demand response, efficiency and uprates – RPM has enabled cost-effective response to environmental rules • Facilitated economically efficient tradeoffs among investment in environmental retrofits, retirement and replacement with lower-cost alternative supplies 4 PJM© 2011
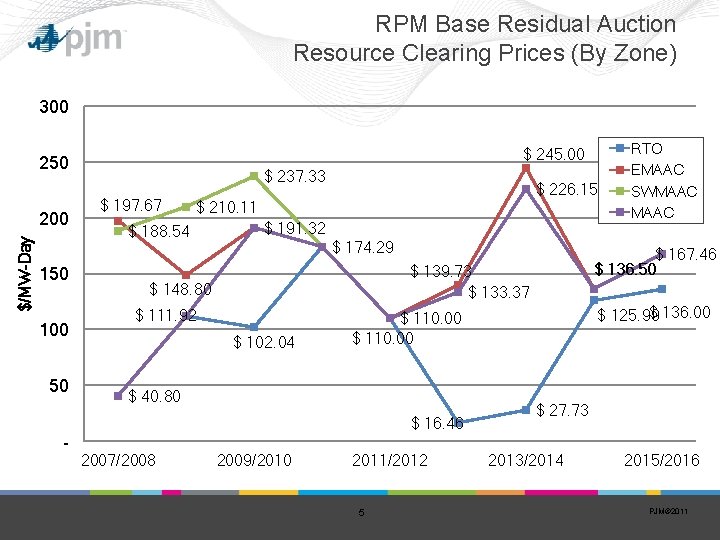
RPM Base Residual Auction Resource Clearing Prices (By Zone) 300 $ 245. 00 250 $/MW-Day 200 150 100 50 - $ 237. 33 $ 197. 67 $ 226. 15 $ 210. 11 $ 188. 54 $ 191. 32 $ 174. 29 $ 111. 92 $ 102. 04 $ 16. 46 2009/2010 $ 136. 00 $ 125. 99 $ 110. 00 $ 40. 80 2007/2008 $ 167. 46 $ 136. 50 $ 139. 73 $ 133. 37 $ 148. 80 2011/2012 5 RTO EMAAC SWMAAC $ 27. 73 2013/2014 2015/2016 PJM© 2011
Capacity Prices Prior to Reliability Pricing Market Implementation www. pjm. com 6 PJM© 2011
Cumulative New Dependable Capacity 2007 -2016 12, 000 10, 000 MW s 8, 000 6, 000 4, 000 2, 000 l el el C Fu la r So se l ie D o yd r H W in d ar N uc le m ea St ne bi ur n T om C C om bu st io bi n ed C yc le 0 7 PJM© 2011
Encouraging Demand Resources New Capacity Market (RPM) 8 PJM© 2011
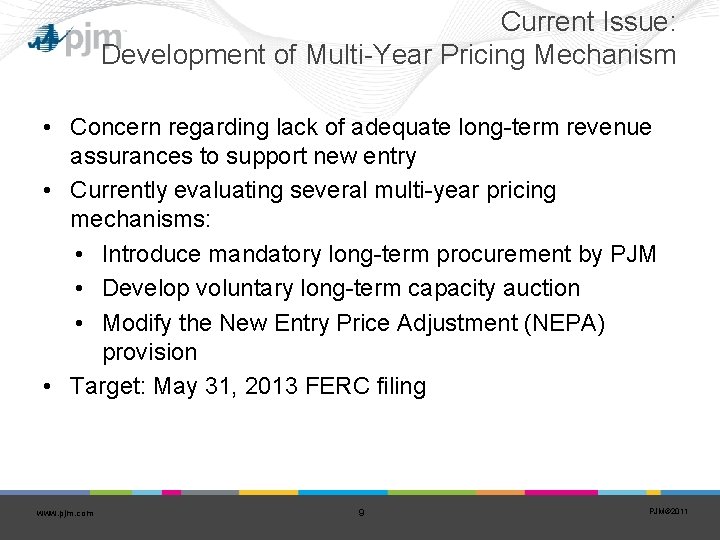
Current Issue: Development of Multi-Year Pricing Mechanism • Concern regarding lack of adequate long-term revenue assurances to support new entry • Currently evaluating several multi-year pricing mechanisms: • Introduce mandatory long-term procurement by PJM • Develop voluntary long-term capacity auction • Modify the New Entry Price Adjustment (NEPA) provision • Target: May 31, 2013 FERC filing www. pjm. com 9 PJM© 2011
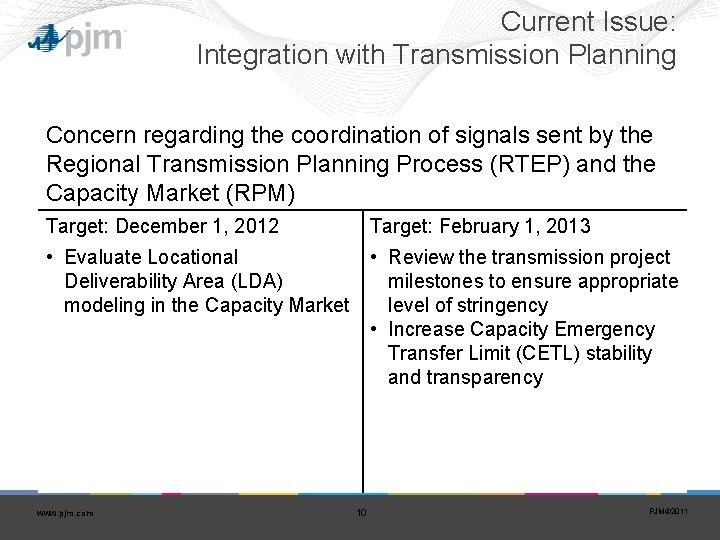
Current Issue: Integration with Transmission Planning Concern regarding the coordination of signals sent by the Regional Transmission Planning Process (RTEP) and the Capacity Market (RPM) Target: December 1, 2012 Target: February 1, 2013 • Evaluate Locational • Review the transmission project Deliverability Area (LDA) milestones to ensure appropriate modeling in the Capacity Market level of stringency • Increase Capacity Emergency Transfer Limit (CETL) stability and transparency www. pjm. com 10 PJM© 2011
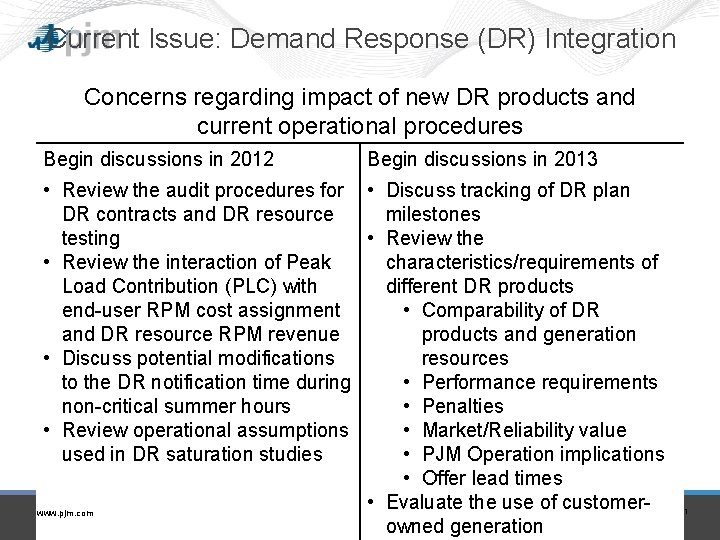
Current Issue: Demand Response (DR) Integration Concerns regarding impact of new DR products and current operational procedures Begin discussions in 2012 Begin discussions in 2013 • Review the audit procedures for • Discuss tracking of DR plan DR contracts and DR resource milestones testing • Review the interaction of Peak characteristics/requirements of Load Contribution (PLC) with different DR products end-user RPM cost assignment • Comparability of DR and DR resource RPM revenue products and generation • Discuss potential modifications resources to the DR notification time during • Performance requirements non-critical summer hours • Penalties • Review operational assumptions • Market/Reliability value used in DR saturation studies • PJM Operation implications • Offer lead times • Evaluate the use of customerwww. pjm. com 11 owned generation PJM© 2011
PJM Capacity Market Thank You More information: www. pjm. com 12 PJM© 2011
- Slides: 12