
PISA 2018 Report for Bosnia and Herzegovina SARAJEVO
PISA 2018 Report for Bosnia and Herzegovina SARAJEVO, 3 DECEMBER 2019 ŽANETA DŽUMHUR, CHIEF ANALYST
PISA 2018 in Bosnia and Herzegovina - Bi. H has participated in PISA survey for the first time - Sample included 6 480 of fifteen-year-old students - 3 148 girls and 3 332 boys - 213 primary and secondary schools
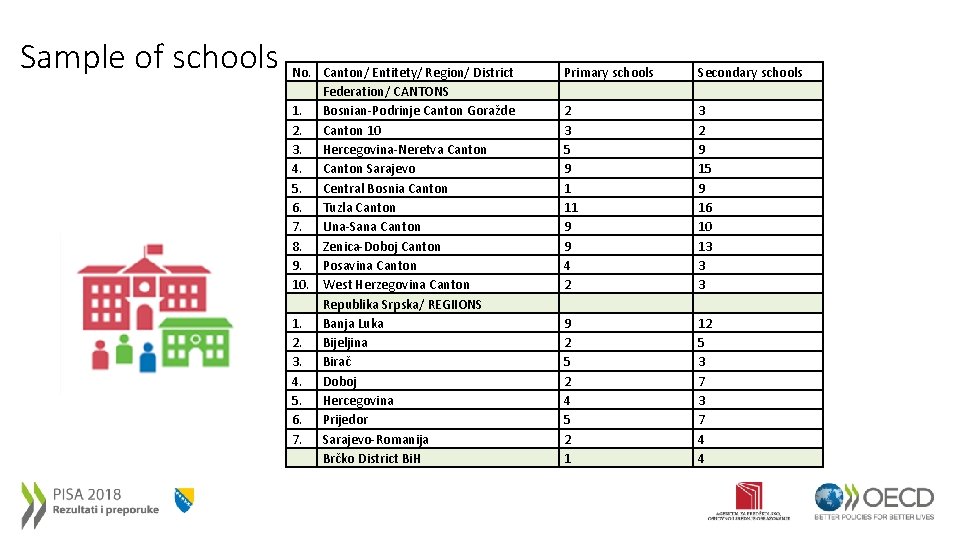
Sample of schools No. 1. 2. 3. 4. 5. 6. 7. 8. 9. 10. 1. 2. 3. 4. 5. 6. 7. Canton/ Entitety/ Region/ District Federation/ CANTONS Bosnian-Podrinje Canton Goražde Canton 10 Hercegovina-Neretva Canton Sarajevo Central Bosnia Canton Tuzla Canton Una-Sana Canton Zenica-Doboj Canton Posavina Canton West Herzegovina Canton Republika Srpska/ REGIIONS Banja Luka Bijeljina Birač Doboj Hercegovina Prijedor Sarajevo-Romanija Brčko District Bi. H Primary schools 2 3 5 9 1 11 9 9 4 2 9 2 5 2 4 5 2 1 Secondary schools 3 2 9 15 9 16 10 13 3 3 12 5 3 7 4 4
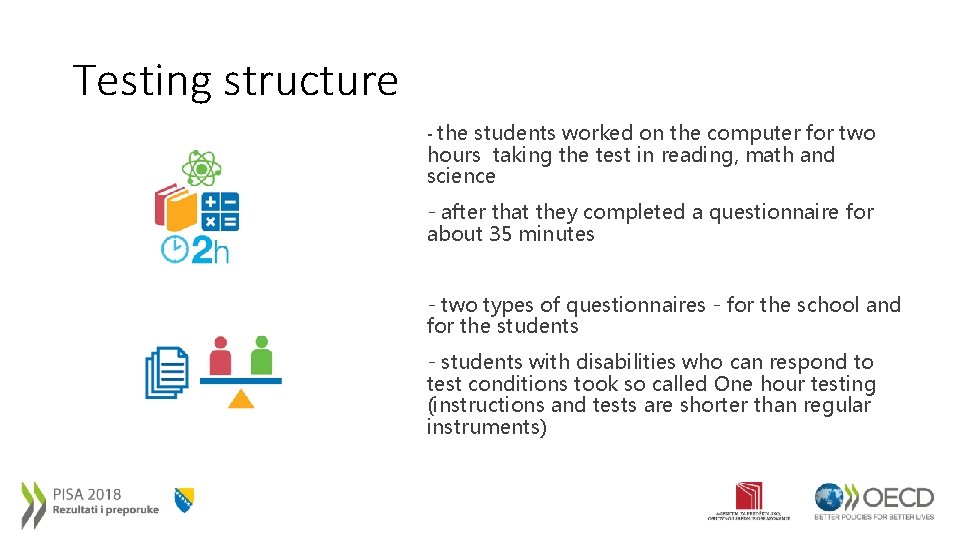
Testing structure - the students worked on the computer for two hours taking the test in reading, math and science - after that they completed a questionnaire for about 35 minutes - two types of questionnaires - for the school and for the students - students with disabilities who can respond to test conditions took so called One hour testing (instructions and tests are shorter than regular instruments)
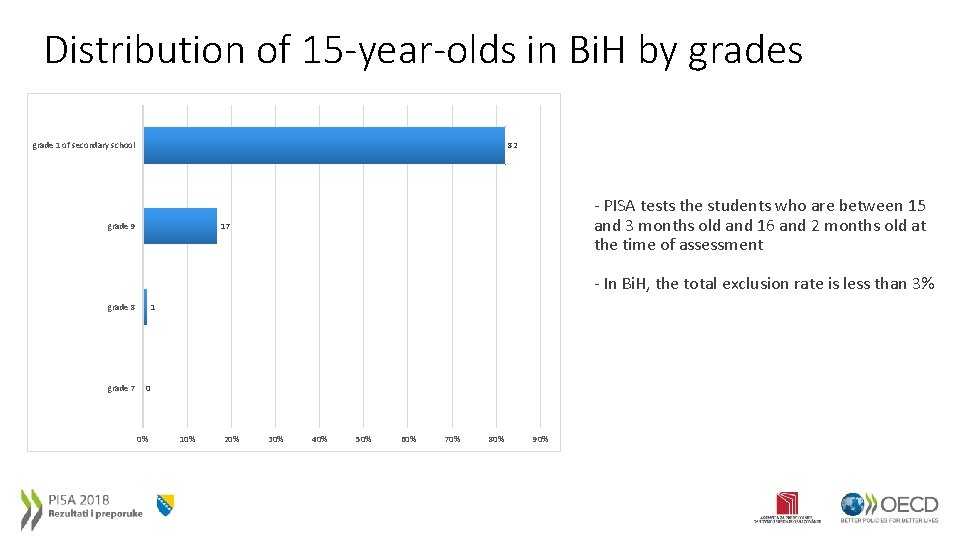
Distribution of 15 -year-olds in Bi. H by grades grade 1 of secondary school 82 grade 9 - PISA tests the students who are between 15 and 3 months old and 16 and 2 months old at the time of assessment 17 - In Bi. H, the total exclusion rate is less than 3% grade 8 grade 7 1 0 0% 10% 20% 30% 40% 50% 60% 70% 80% 90%
Bi. H in PISA 2018 - Results Student Achievements In Bosnia and Herzegovina, mean achievement in mathematics is 406, in reading 403, and in science 398 score points, which is below the OECD average The difference in average achievement in Bosnia and Herzegovina in mathematics, according to the OECD average, is 83 score points, 85 in reading and 91 in science, WHICH IS, ON AVERAGE, THE DIFFERENCE OF THREE YEARS OF SCHOOLING FOR ALL THREE DOMAINS.
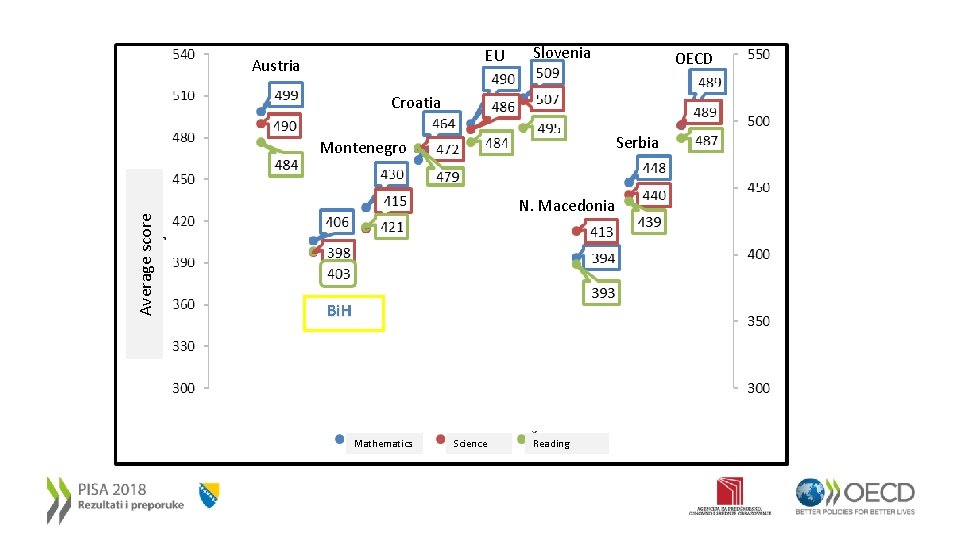
EU Austria Slovenia OECD Croatia Serbia Average score Montenegro N. Macedonia Bi. H Mathematics Science Reading
Levels of achievement - PISA also describes student outcomes by level of knowledge separately in each area identifying the basic level of success (Level 2) - it is considered the minimum level of proficiency in reading, mathematics and science - For all three PISA areas, the basic level is one where students can access tasks that require, at least, minimal ability and aptitude for thinking independently
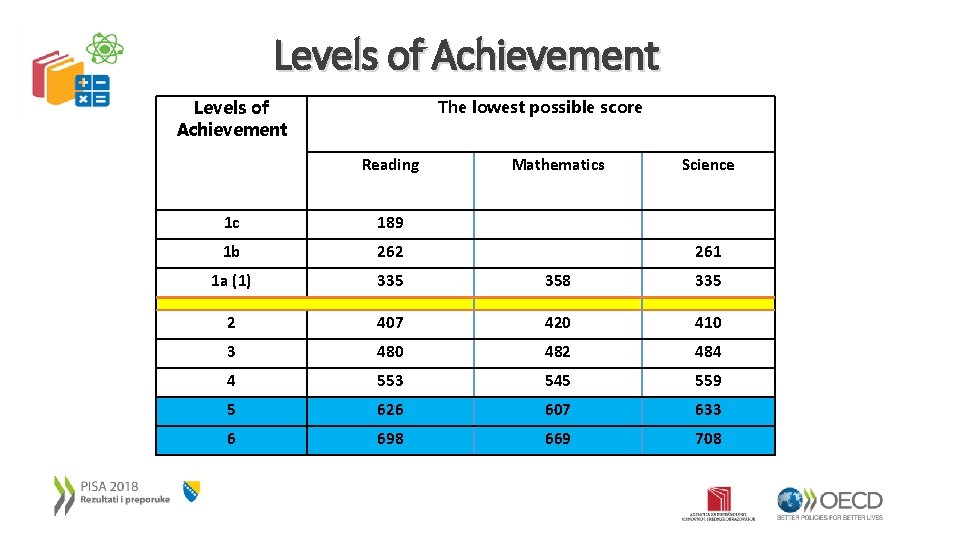
Levels of Achievement The lowest possible score Reading Mathematics Science 1 c 189 1 b 262 1 a (1) 335 358 335 2 407 420 410 3 480 482 484 4 553 545 559 5 626 607 633 6 698 669 708 261
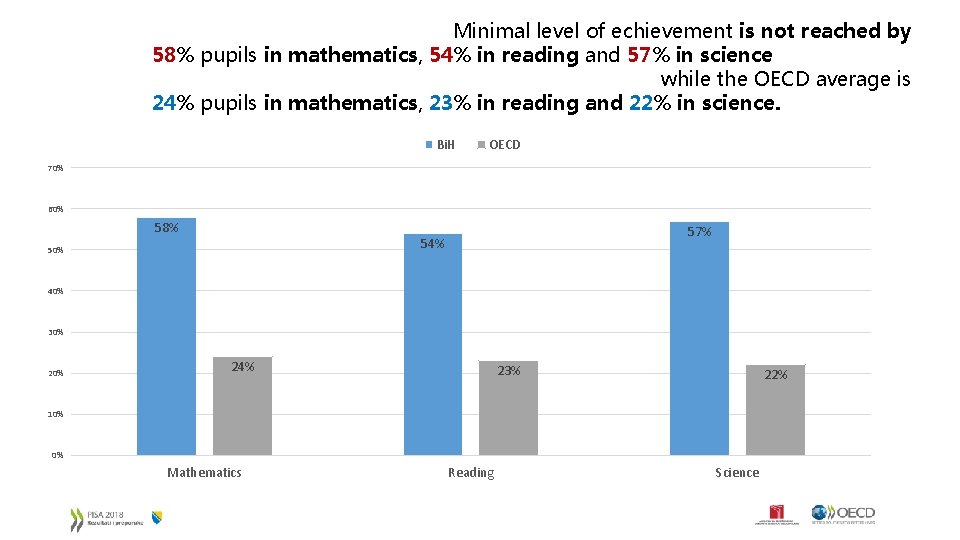
Minimal level of echievement is not reached by 58% pupils in mathematics, 54% in reading and 57% in science while the OECD average is 24% pupils in mathematics, 23% in reading and 22% in science. Bi. H OECD 70% 60% 58% 57% 54% 50% 40% 30% 24% 23% 22% 10% 0% Mathematics Reading Science
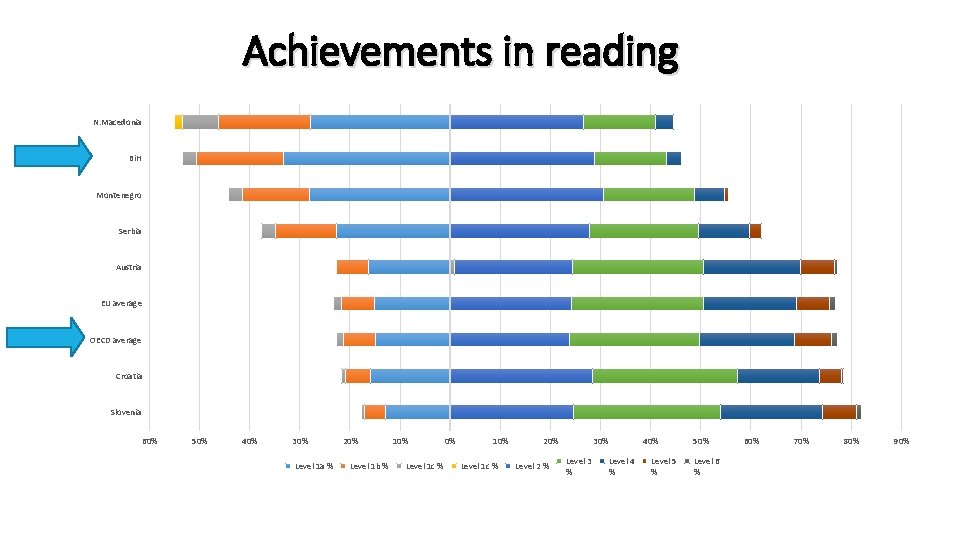
Achievements in reading N. Macedonia Bi. H Montenegro Serbia Austria EU average OECD average Croatia Slovenia 60% 50% 40% 30% Level 1 a % 20% Level 1 b % 10% Level 1 c % 0% 10% Level 1 c % 20% Level 2 % 30% Level 3 % Level 4 % 40% Level 5 % 50% Level 6 % 60% 70% 80% 90%
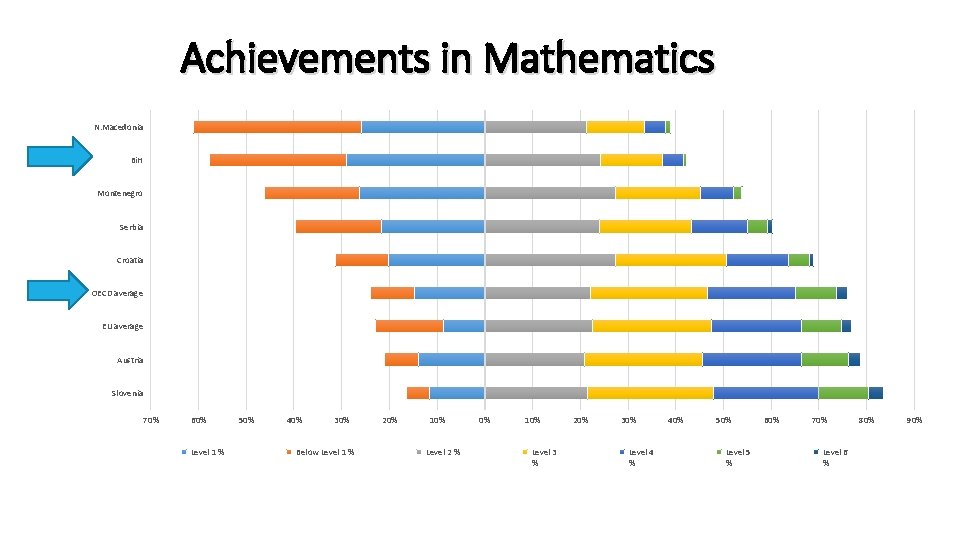
Achievements in Mathematics N. Macedonia Bi. H Montenegro Serbia Croatia OECD average EU average Austria Slovenia 70% 60% Level 1 % 50% 40% 30% Below Level 1 % 20% 10% Level 2 % 0% 10% Level 3 % 20% 30% Level 4 % 40% 50% Level 5 % 60% 70% Level 6 % 80% 90%
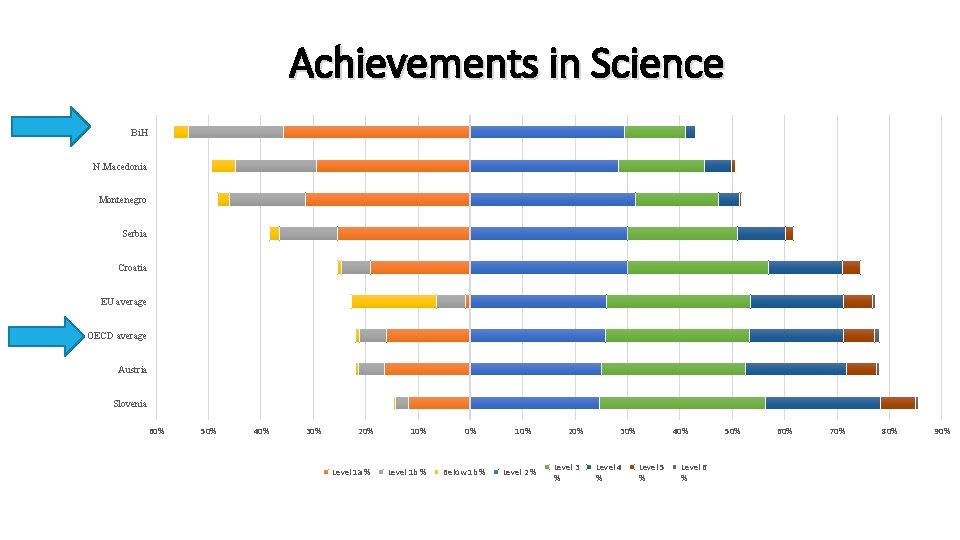
Achievements in Science Bi. H N. Macedonia Montenegro Serbia Croatia EU average OECD average Austria Slovenia 60% 50% 40% 30% 20% Level 1 a % 10% Level 1 b % 0% Below 1 b % 10% Level 2 % 20% Level 3 % 30% Level 4 % 40% Level 5 % Level 6 % 50% 60% 70% 80% 90%
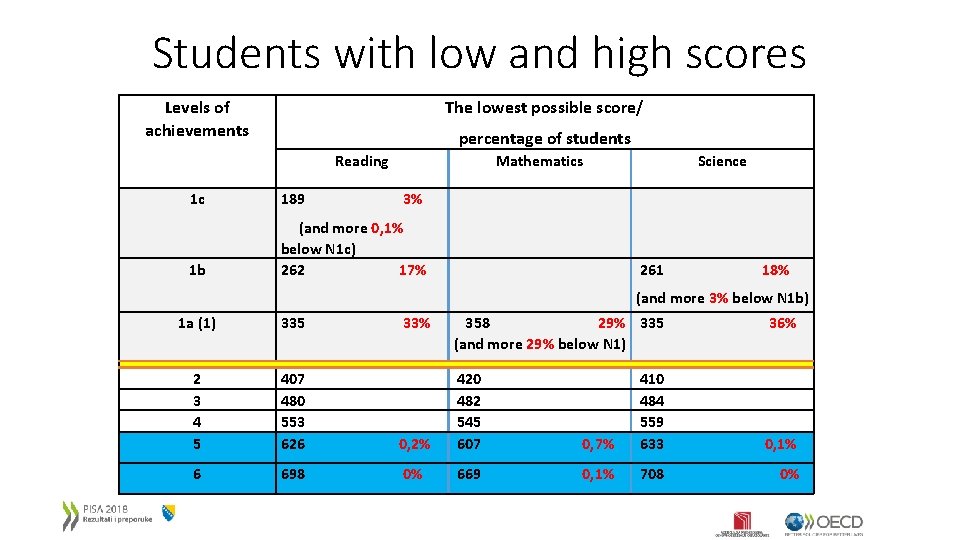
Students with low and high scores Levels of achievements The lowest possible score/ percentage of students Reading Mathematics Science 1 c 189 3% 1 b (and more 0, 1% below N 1 c) 262 17% 261 18% (and more 3% below N 1 b) 1 a (1) 335 33% 358 29% 335 36% (and more 29% below N 1) 2 3 4 5 407 480 553 626 0, 2% 420 482 545 607 0, 7% 410 484 559 633 0, 1% 6 698 0% 669 0, 1% 708 0%
THANK YOU FOR YOUR ATTENTION!
- Slides: 15