Pin Intels Dynamic Binary Instrumentation Engine Pin Tutorial
Pin: Intel’s Dynamic Binary Instrumentation Engine Pin Tutorial Intel Corporation Presented By: Robert Cohn Tevi Devor CGO 2010 1 Software & Services Group
Agenda • Part 1: Introduction to Pin • Part 2: Larger Pin tools and writing efficient Pin tools • Part 3: Deeper into Pin API • Part 4: Advanced Pin API • Part 5: Performance #s Software & Services Group 2
Part 1: Introduction to Pin • Dynamic Binary Instrumentation • Pin Capabilities • Overview of how Pin works • Sample Pin Tools Software & Services Group 3
What Does “Pin” Stand For? • Three Letter Acronyms @ Intel – TLAs – 263 possible TLAs – 263 -1 are in use at Intel – Only 1 is not approved for use at Intel – Guess which one: • Pin Is Not an acronym • Pin is based on the post link optimizer Spike – Use dynamic code generation to make a less intrusive profile guided optimization and instrumentation system – Pin is a small Spike – Spike is EOL http: //www. cgo. org/cgo 2004/papers/01_82_luk_ck. pdf Software & Services Group 4
Instrumentation A technique that inserts code into a program to collect run-time information q Program analysis : performance profiling, error detection, capture & replay q Architectural study : processor and cache simulation, trace collection • Source-Code Instrumentation • Static Binary Instrumentation • Dynamic Binary Instrumentation q Instrument code just before it runs (Just In Time – JIT) – No need to recompile or re-link – Discover code at runtime – Handle dynamically-generated code Pin istoarunning dynamic binary – Attach processes instrumentation engine Software & Services Group 5
Advantages of Pin Instrumentation • Programmable Instrumentation: – Provides rich set of APIs to write, in C, C++, assembly, your own instrumentation tools, called Pin. Tools – APIs are designed to maximize ease of use – abstract away the underlying instruction set idiosyncrasies • Multiplatform: – Supports IA-32, Intel 64, IA-64 – Supports Linux, Windows, Mac. OS • Robust: – – Can instrument real-life applications: Database, web browsers, … Can instrument multithreaded applications Supports signals and exceptions, self modifying code… If you can Run it – you can Pin it • Efficient: Pin can be used to instrument all the user level code – Applies compiler optimizations on instrumentation code in an application Software & Services Group 6
Pin Instrumentation Capabilities • Use Pin APIs to write Pin. Tools that: – Replace application functions with your own – Call the original application function from within your replacement function – Fully examine any application instruction, and insert a call to your instrumenting function to be executed whenever that instruction executes – Pass parameters to your instrumenting function from a large set of supported parameters – – Register values (including IP), Register values by reference (for modification) Memory addresses read/written by the instruction Full register context …. – Track function calls including syscalls and examine/change arguments – Track application threads – Intercept signals If Pina process doesn’ttree have it, you don’t want it – Instrument – Many other capabilities… Software & Services Group 7
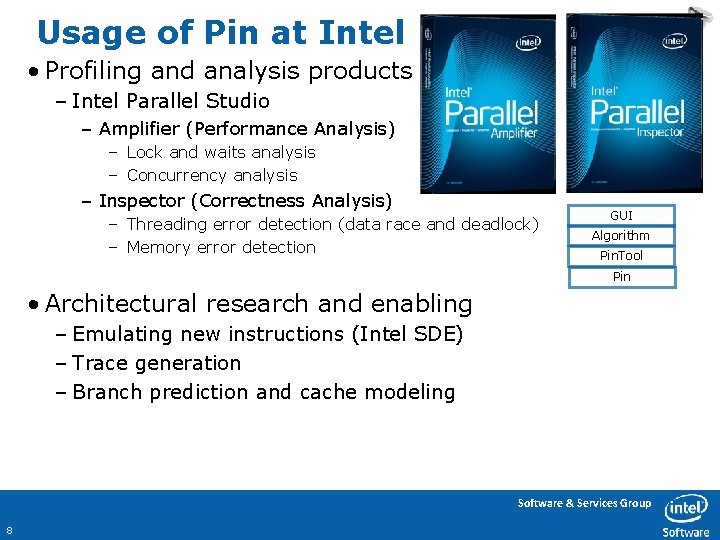
Usage of Pin at Intel • Profiling and analysis products – Intel Parallel Studio – Amplifier (Performance Analysis) – Lock and waits analysis – Concurrency analysis – Inspector (Correctness Analysis) – Threading error detection (data race and deadlock) – Memory error detection GUI Algorithm Pin. Tool Pin • Architectural research and enabling – Emulating new instructions (Intel SDE) – Trace generation – Branch prediction and cache modeling Software & Services Group 8
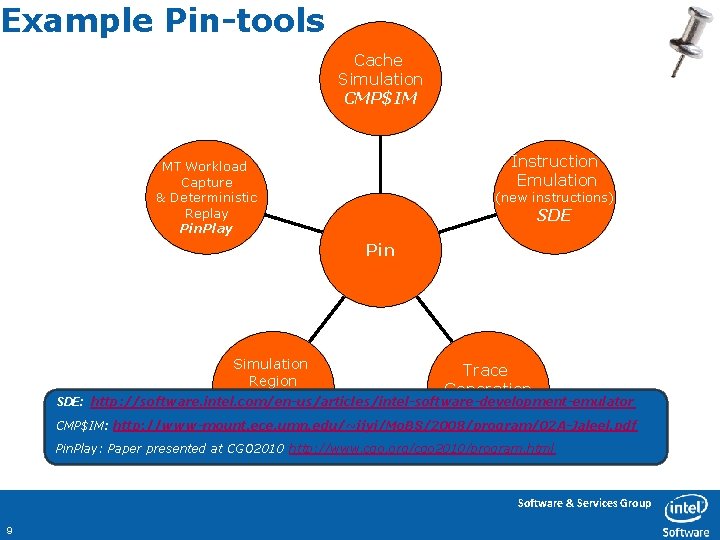
Example Pin-tools Cache Simulation CMP$IM Instruction Emulation MT Workload Capture & Deterministic Replay Pin. Play (new instructions) SDE Pin Simulation Trace Region Generation Selection SDE: http: //software. intel. com/en-us/articles/intel-software-development-emulator pin. LIT Pin. Points CMP$IM: http: //www-mount. ece. umn. edu/~jjyi/Mo. BS/2008/program/02 A-Jaleel. pdf Pin. Play: Paper presented at CGO 2010 http: //www. cgo. org/cgo 2010/program. html Software & Services Group 9
Pin Usage Outside Intel • Popular and well supported – 30, 000+ downloads, 400+ citations • Free Down. Load – www. pintool. org – Includes: Detailed user manual, source code for 100 s of Pin tools • Pin User Group (Pin. Heads) – http: //tech. groups. yahoo. com/group/pinheads/ – Pin users and Pin developers answer questions Software & Services Group 10
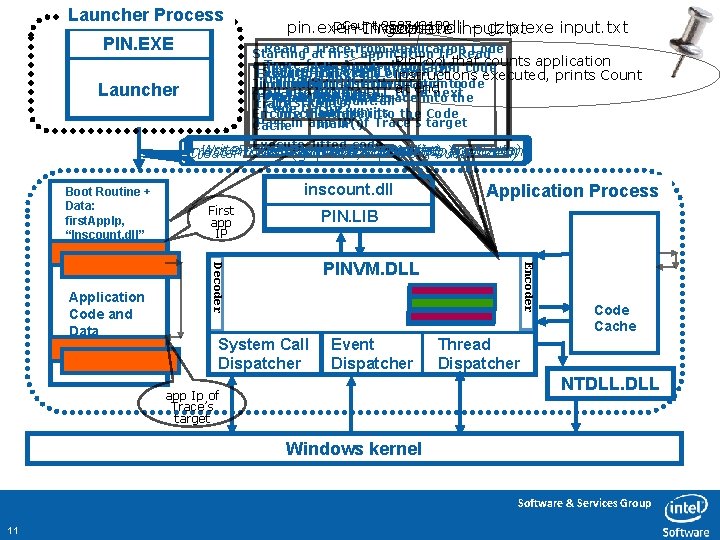
Launcher Process PIN. EXE Count 258743109 pin. exe –t. Invocation inscount. dll – gzip. exe input. txt Pin gzip. exe input. txt Read a at Trace Application Code Starting firstfrom application IP Read Pin. Tool that counts application a Jit Trace from Application Code code it, adding instrumentation Source Trace exit branch is Start PINVM. DLL Execution of Trace ends instructions executed, prints Count from inscount. dll modified to instrumentation directly at branch to running Jit it, adding code endnext Load. Trace to Jit Call into PINVM. DLL Destination from inscount. dll Load PINVM. DLL Encode the jitted trace into the inscount. dll (first. App. Ip, trace Code Cache and run into its the Code “inscount. dll”) Encode the trace Pass in app IP of Trace’s target main() Cache Launcher Execute Jitted code Write. Process. Memory(Boot. Routine, Boot. Data) Resume atand Boot. Routine Get. Context(&first. App. Ip) Inject Pin Boot. Routine Data intosuspended) application Set. Context(Boot. Routine. Ip) Create. Process (gzip. exe, input. txt, First app IP PIN. LIB PINVM. DLL System Call Dispatcher Event Dispatcher Application Process Encoder Application Code and Data inscount. dll Decoder Boot Routine + Data: first. App. Ip, “Inscount. dll” Code Cache Thread Dispatcher NTDLL. DLL app Ip of Trace’s target Windows kernel Software & Services Group 11
All code in this presentation is covered by the following: • • /*BEGIN_LEGAL Intel Open Source License • • • Copyright (c) 2002 -2010 Intel Corporation. All rights reserved. • • • • • • Redistributions of source code must retain the above copyright notice, this list of conditions and the following disclaimer. Redistributions in binary form must reproduce the above copyright notice, this list of conditions and the following disclaimer in the documentation and/or other materials provided with the distribution. Neither the name of the Intel Corporation nor the names of its contributors may be used to endorse or promote products derived from this software without specific prior written permission. Redistribution and use in source and binary forms, with or without modification, are permitted provided that the following conditions are met: THIS SOFTWARE IS PROVIDED BY THE COPYRIGHT HOLDERS AND CONTRIBUTORS ``AS IS'' AND ANY EXPRESS OR IMPLIED WARRANTIES, INCLUDING, BUT NOT LIMITED TO, THE IMPLIED WARRANTIES OF MERCHANTABILITY AND FITNESS FOR A PARTICULAR PURPOSE ARE DISCLAIMED. IN NO EVENT SHALL THE INTEL OR ITS CONTRIBUTORS BE LIABLE FOR ANY DIRECT, INCIDENTAL, SPECIAL, EXEMPLARY, OR CONSEQUENTIAL DAMAGES (INCLUDING, BUT NOT LIMITED TO, PROCUREMENT OF SUBSTITUTE GOODS OR SERVICES; LOSS OF USE, DATA, OR PROFITS; OR BUSINESS INTERRUPTION) HOWEVER CAUSED AND ON ANY THEORY OF LIABILITY, WHETHER IN CONTRACT, STRICT LIABILITY, OR TORT (INCLUDING NEGLIGENCE OR OTHERWISE) ARISING IN ANY WAY OUT OF THE USE OF THIS SOFTWARE, EVEN IF ADVISED OF THE POSSIBILITY OF SUCH DAMAGE. END_LEGAL */ Software & Services Group 12
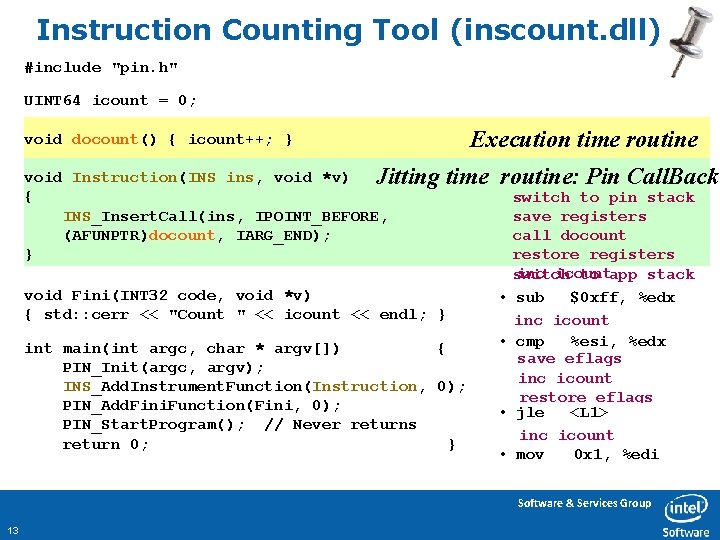
Instruction Counting Tool (inscount. dll) #include "pin. h" UINT 64 icount = 0; Execution time routine void docount() { icount++; } void Instruction(INS ins, void *v) Jitting { INS_Insert. Call(ins, IPOINT_BEFORE, (AFUNPTR)docount, IARG_END); } time routine: Pin Call. Back void Fini(INT 32 code, void *v) { std: : cerr << "Count " << icount << endl; } int main(int argc, char * argv[]) { PIN_Init(argc, argv); INS_Add. Instrument. Function(Instruction, 0); PIN_Add. Fini. Function(Fini, 0); PIN_Start. Program(); // Never returns return 0; } switch to pin stack save registers call docount restore registers inc icount switch to app stack • sub $0 xff, %edx inc icount • cmp %esi, %edx save eflags inc icount restore eflags • jle <L 1> inc icount • mov 0 x 1, %edi Software & Services Group 13

Launcher Process pin. exe –t inscount. dll – gzip. exe input. txt PIN. EXE Read a Trace from Application Code Jit it, adding instrumentation code from inscount. dll Launcher Encode the Jitted trace into the Code Cache First app IP PIN. LIB PINVM. DLL System Call Dispatcher Event Dispatcher Application Process Encoder Application Code and Data inscount. dll Decoder Boot Routine + Data: first. App. Ip, “Inscount. dll” Code Cache Thread Dispatcher NTDLL. DLL Windows kernel Software & Services Group 14
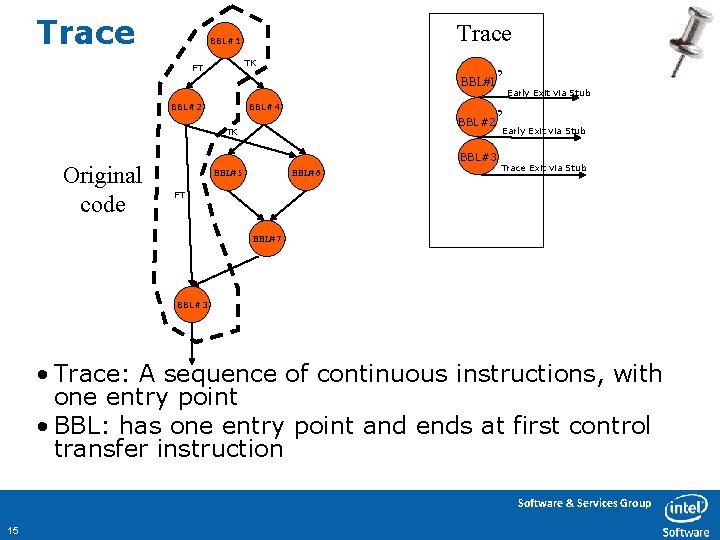
Trace BBL#1 TK FT BBL#1 BBL#2 BBL#4 BBL#3 BBL# 5 Early Exit via Stub ’ BBL#2 TK Original code ’ BBL# 6 Early Exit via Stub Trace Exit via Stub FT BBL# 7 BBL#3 • Trace: A sequence of continuous instructions, with one entry point • BBL: has one entry point and ends at first control transfer instruction Software & Services Group 15
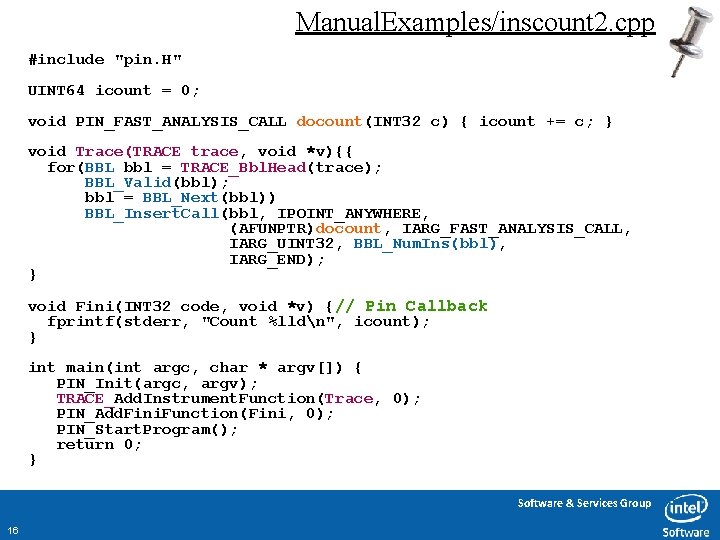
Manual. Examples/inscount 2. cpp #include "pin. H" UINT 64 icount = 0; void PIN_FAST_ANALYSIS_CALL docount(INT 32 c) { icount += c; } void Trace(TRACE trace, void *v){{ for(BBL bbl = TRACE_Bbl. Head(trace); BBL_Valid(bbl); bbl = BBL_Next(bbl)) BBL_Insert. Call(bbl, IPOINT_ANYWHERE, (AFUNPTR)docount, IARG_FAST_ANALYSIS_CALL, IARG_UINT 32, BBL_Num. Ins(bbl), IARG_END); } void Fini(INT 32 code, void *v) {// Pin Callback fprintf(stderr, "Count %lldn", icount); } int main(int argc, char * argv[]) { PIN_Init(argc, argv); TRACE_Add. Instrument. Function(Trace, 0); PIN_Add. Fini. Function(Fini, 0); PIN_Start. Program(); return 0; } Software & Services Group 16
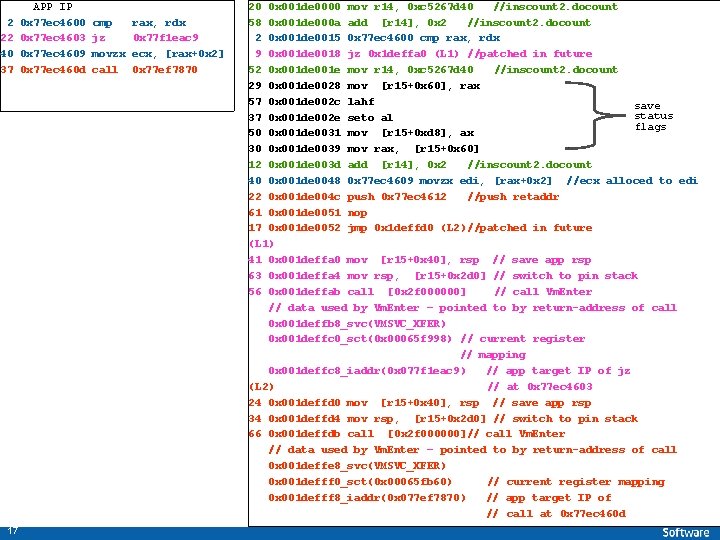
2 22 40 37 17 APP IP 0 x 77 ec 4600 0 x 77 ec 4603 0 x 77 ec 4609 0 x 77 ec 460 d cmp jz movzx call rax, rdx 0 x 77 f 1 eac 9 ecx, [rax+0 x 2] 0 x 77 ef 7870 20 0 x 001 de 0000 mov r 14, 0 xc 5267 d 40 //inscount 2. docount 58 0 x 001 de 000 a add [r 14], 0 x 2 //inscount 2. docount 2 0 x 001 de 0015 0 x 77 ec 4600 cmp rax, rdx 9 0 x 001 de 0018 jz 0 x 1 deffa 0 (L 1) //patched in future 52 0 x 001 de 001 e mov r 14, 0 xc 5267 d 40 //inscount 2. docount 29 0 x 001 de 0028 mov [r 15+0 x 60], rax 57 0 x 001 de 002 c lahf save status 37 0 x 001 de 002 e seto al flags 50 0 x 001 de 0031 mov [r 15+0 xd 8], ax 30 0 x 001 de 0039 mov rax, [r 15+0 x 60] 12 0 x 001 de 003 d add [r 14], 0 x 2 //inscount 2. docount 40 0 x 001 de 0048 0 x 77 ec 4609 movzx edi, [rax+0 x 2] //ecx alloced to edi 22 0 x 001 de 004 c push 0 x 77 ec 4612 //push retaddr 61 0 x 001 de 0051 nop 17 0 x 001 de 0052 jmp 0 x 1 deffd 0 (L 2)//patched in future (L 1) 41 0 x 001 deffa 0 mov [r 15+0 x 40], rsp // save app rsp 63 0 x 001 deffa 4 mov rsp, [r 15+0 x 2 d 0] // switch to pin stack 56 0 x 001 deffab call [0 x 2 f 000000] // call Vm. Enter // data used by Vm. Enter – pointed to by return-address of call 0 x 001 deffb 8_svc(VMSVC_XFER) 0 x 001 deffc 0_sct(0 x 00065 f 998) // current register // mapping 0 x 001 deffc 8_iaddr(0 x 077 f 1 eac 9) // app target IP of jz (L 2) // at 0 x 77 ec 4603 24 0 x 001 deffd 0 mov [r 15+0 x 40], rsp // save app rsp 34 0 x 001 deffd 4 mov rsp, [r 15+0 x 2 d 0] // switch to pin stack 66 0 x 001 deffdb call [0 x 2 f 000000]// call Vm. Enter // data used by Vm. Enter – pointed to by return-address of call 0 x 001 deffe 8_svc(VMSVC_XFER) 0 x 001 defff 0_sct(0 x 00065 fb 60) // current register mapping 0 x 001 defff 8_iaddr(0 x 077 ef 7870) // app target IP of Software & Services Group // call at 0 x 77 ec 460 d
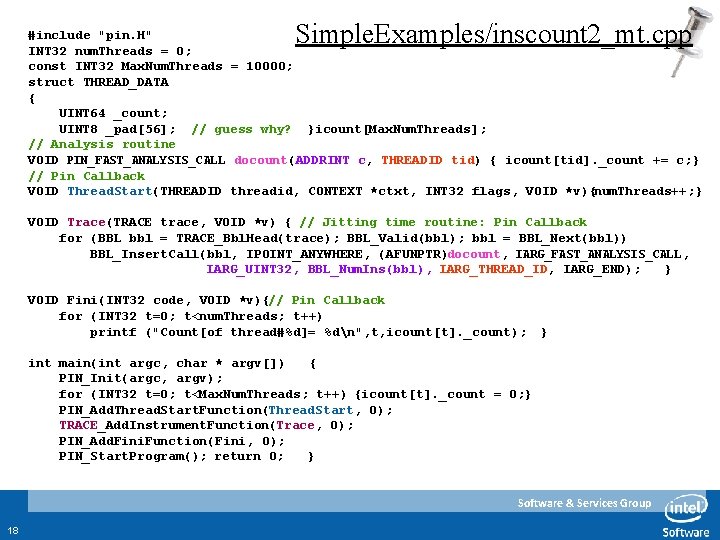
Simple. Examples/inscount 2_mt. cpp #include "pin. H" INT 32 num. Threads = 0; const INT 32 Max. Num. Threads = 10000; struct THREAD_DATA { UINT 64 _count; UINT 8 _pad[56]; // guess why? }icount[Max. Num. Threads]; // Analysis routine VOID PIN_FAST_ANALYSIS_CALL docount(ADDRINT c, THREADID tid) { icount[tid]. _count += c; } // Pin Callback VOID Thread. Start(THREADID threadid, CONTEXT *ctxt, INT 32 flags, VOID *v){num. Threads++; } VOID Trace(TRACE trace, VOID *v) { // Jitting time routine: Pin Callback for (BBL bbl = TRACE_Bbl. Head(trace); BBL_Valid(bbl); bbl = BBL_Next(bbl)) BBL_Insert. Call(bbl, IPOINT_ANYWHERE, (AFUNPTR)docount, IARG_FAST_ANALYSIS_CALL, IARG_UINT 32, BBL_Num. Ins(bbl), IARG_THREAD_ID, IARG_END); } VOID Fini(INT 32 code, VOID *v){// Pin Callback for (INT 32 t=0; t<num. Threads; t++) printf ("Count[of thread#%d]= %dn", t, icount[t]. _count); } int main(int argc, char * argv[]) { PIN_Init(argc, argv); for (INT 32 t=0; t<Max. Num. Threads; t++) {icount[t]. _count = 0; } PIN_Add. Thread. Start. Function(Thread. Start, 0); TRACE_Add. Instrument. Function(Trace, 0); PIN_Add. Fini. Function(Fini, 0); PIN_Start. Program(); return 0; } Software & Services Group 18
Multi-Threading • Pin supports multi-threading – Application threads execute jitted code including instrumentation code (inlined and not inlined), without any serialization introduced by Pin – Instrumentation code can use Pin and/or OS synchronization constructs to introduce serialization if needed. – Will see examples of this in Part 4 – Pin provides APIs for thread local storage. – Will see examples in Part 3 – Pin callbacks are serialized – Jitting is serialized – Only one application thread can be jitting code at any time Software & Services Group 19
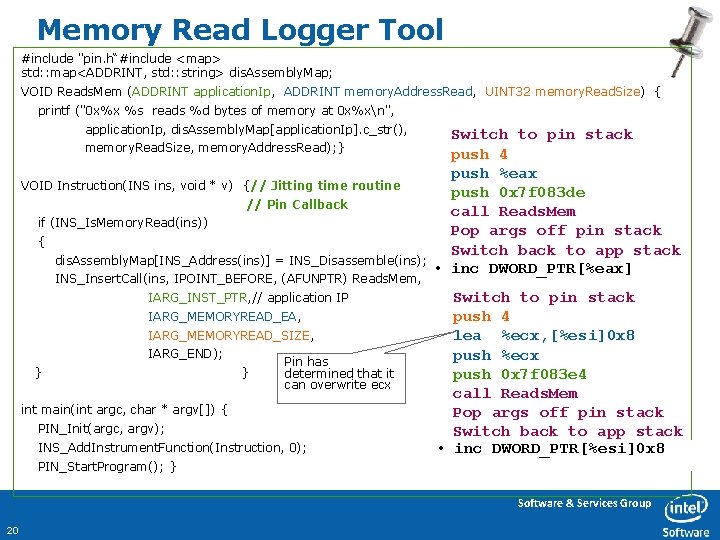
Memory Read Logger Tool #include "pin. h“#include <map> std: : map<ADDRINT, std: : string> dis. Assembly. Map; VOID Reads. Mem (ADDRINT application. Ip, ADDRINT memory. Address. Read, UINT 32 memory. Read. Size) { printf ("0 x%x %s reads %d bytes of memory at 0 x%xn", application. Ip, dis. Assembly. Map[application. Ip]. c_str(), memory. Read. Size, memory. Address. Read); } VOID Instruction(INS ins, void * v) {// Jitting time routine // Pin Callback if (INS_Is. Memory. Read(ins)) { dis. Assembly. Map[INS_Address(ins)] = INS_Disassemble(ins); INS_Insert. Call(ins, IPOINT_BEFORE, (AFUNPTR) Reads. Mem, IARG_INST_PTR, // application IP IARG_MEMORYREAD_EA, IARG_MEMORYREAD_SIZE, IARG_END); } } Pin has determined that it can overwrite ecx int main(int argc, char * argv[]) { PIN_Init(argc, argv); INS_Add. Instrument. Function(Instruction, 0); Switch to pin stack push 4 push %eax push 0 x 7 f 083 de call Reads. Mem Pop args off pin stack Switch back to app stack • inc DWORD_PTR[%eax] Switch to pin stack push 4 lea %ecx, [%esi]0 x 8 push %ecx push 0 x 7 f 083 e 4 call Reads. Mem Pop args off pin stack Switch back to app stack • inc DWORD_PTR[%esi]0 x 8 PIN_Start. Program(); } Software & Services Group 20
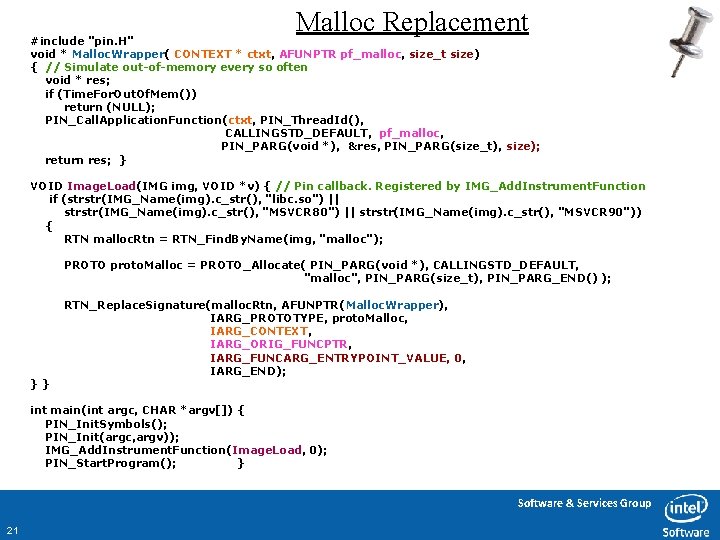
Malloc Replacement #include "pin. H" void * Malloc. Wrapper( CONTEXT * ctxt, AFUNPTR pf_malloc, size_t size) { // Simulate out-of-memory every so often void * res; if (Time. For. Out. Of. Mem()) return (NULL); PIN_Call. Application. Function(ctxt, PIN_Thread. Id(), CALLINGSTD_DEFAULT, pf_malloc, PIN_PARG(void *), &res, PIN_PARG(size_t), size); return res; } VOID Image. Load(IMG img, VOID *v) { // Pin callback. Registered by IMG_Add. Instrument. Function if (strstr(IMG_Name(img). c_str(), "libc. so") || strstr(IMG_Name(img). c_str(), "MSVCR 80") || strstr(IMG_Name(img). c_str(), "MSVCR 90")) { RTN malloc. Rtn = RTN_Find. By. Name(img, "malloc"); PROTO proto. Malloc = PROTO_Allocate( PIN_PARG(void *), CALLINGSTD_DEFAULT, "malloc", PIN_PARG(size_t), PIN_PARG_END() ); }} RTN_Replace. Signature(malloc. Rtn, AFUNPTR(Malloc. Wrapper), IARG_PROTOTYPE, proto. Malloc, IARG_CONTEXT, IARG_ORIG_FUNCPTR, IARG_FUNCARG_ENTRYPOINT_VALUE, 0, IARG_END); int main(int argc, CHAR *argv[]) { PIN_Init. Symbols(); PIN_Init(argc, argv)); IMG_Add. Instrument. Function(Image. Load, 0); PIN_Start. Program(); } Software & Services Group 21

Pin Probe-Mode • Probe mode is a method of using Pin to wrap or replace application functions with functions in the tool. A jump instruction (probe), which redirects the flow of control to the replacement function is placed at the start of the specified function. • The bytes being overwritten are relocated, so that Pin can provide the replacement function with the address of the first relocated byte. This enables the replacement function to call the replaced (original) function. • In probe mode, the application and the replacement routine are run natively (not Jitted). This improves performance, but puts more responsibility on the tool writer. Probes can only be placed on RTN boundaries, and should inserted within the Image load callback. Pin will automatically remove the probes when an image is unloaded. • Many of the PIN APIs that are available in JIT mode are not available in Probe mode. Software & Services Group 22
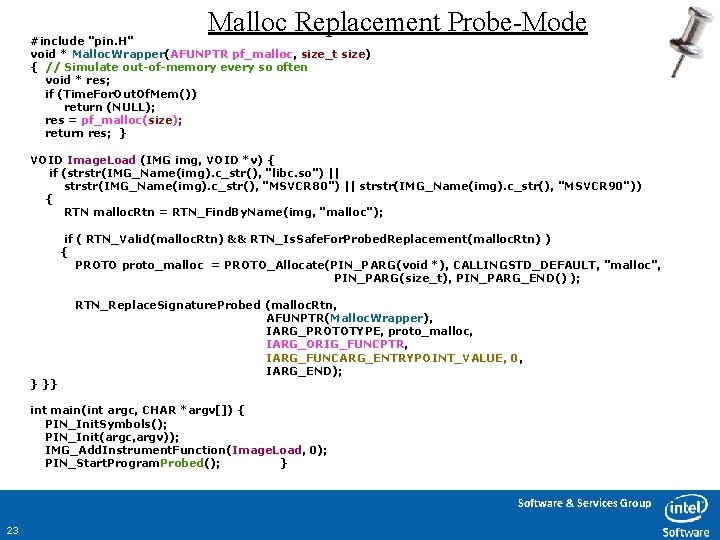
Malloc Replacement Probe-Mode #include "pin. H" void * Malloc. Wrapper(AFUNPTR pf_malloc, size_t size) { // Simulate out-of-memory every so often void * res; if (Time. For. Out. Of. Mem()) return (NULL); res = pf_malloc(size); return res; } VOID Image. Load (IMG img, VOID *v) { if (strstr(IMG_Name(img). c_str(), "libc. so") || strstr(IMG_Name(img). c_str(), "MSVCR 80") || strstr(IMG_Name(img). c_str(), "MSVCR 90")) { RTN malloc. Rtn = RTN_Find. By. Name(img, "malloc"); if ( RTN_Valid(malloc. Rtn) && RTN_Is. Safe. For. Probed. Replacement(malloc. Rtn) ) { PROTO proto_malloc = PROTO_Allocate(PIN_PARG(void *), CALLINGSTD_DEFAULT, "malloc", PIN_PARG(size_t), PIN_PARG_END() ); } }} RTN_Replace. Signature. Probed (malloc. Rtn, AFUNPTR(Malloc. Wrapper), IARG_PROTOTYPE, proto_malloc, IARG_ORIG_FUNCPTR, IARG_FUNCARG_ENTRYPOINT_VALUE, 0, IARG_END); int main(int argc, CHAR *argv[]) { PIN_Init. Symbols(); PIN_Init(argc, argv)); IMG_Add. Instrument. Function(Image. Load, 0); PIN_Start. Program. Probed(); } Software & Services Group 23
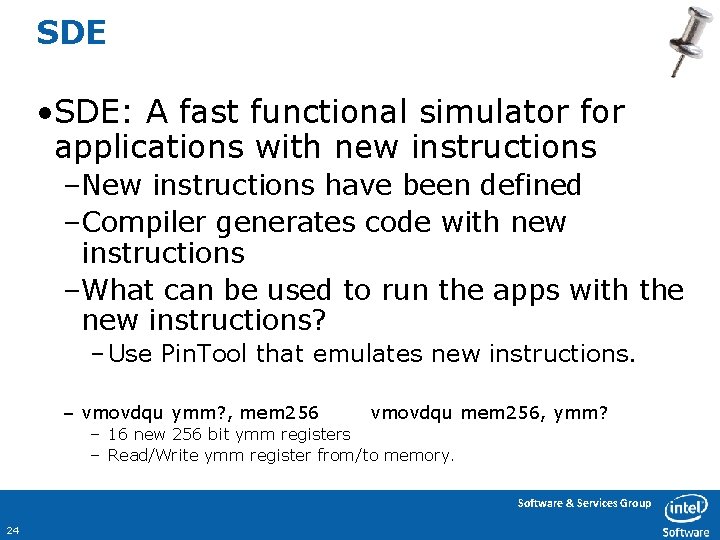
SDE • SDE: A fast functional simulator for applications with new instructions –New instructions have been defined –Compiler generates code with new instructions –What can be used to run the apps with the new instructions? – Use Pin. Tool that emulates new instructions. – vmovdqu ymm? , mem 256 vmovdqu mem 256, ymm? – 16 new 256 bit ymm registers – Read/Write ymm register from/to memory. Software & Services Group 24
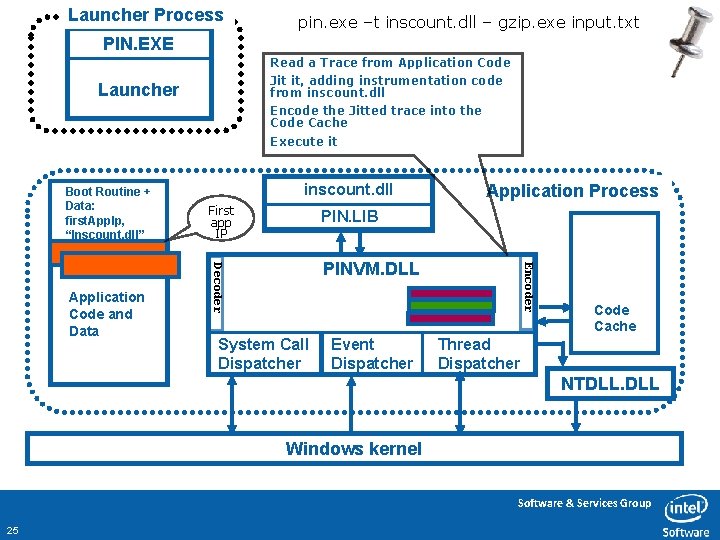
Launcher Process pin. exe –t inscount. dll – gzip. exe input. txt PIN. EXE Read a Trace from Application Code Jit it, adding instrumentation code from inscount. dll Launcher Encode the Jitted trace into the Code Cache Execute it First app IP PIN. LIB PINVM. DLL System Call Dispatcher Event Dispatcher Application Process Encoder Application Code and Data inscount. dll Decoder Boot Routine + Data: first. App. Ip, “Inscount. dll” Code Cache Thread Dispatcher NTDLL. DLL Windows kernel Software & Services Group 25
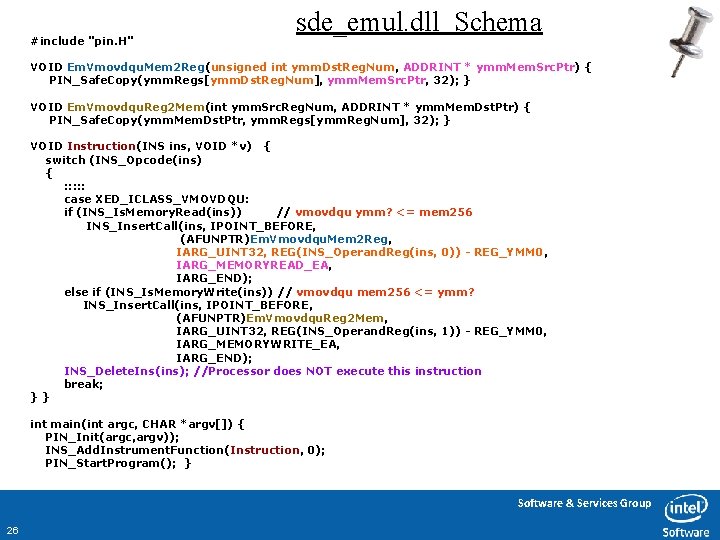
#include "pin. H" sde_emul. dll Schema VOID Em. Vmovdqu. Mem 2 Reg(unsigned int ymm. Dst. Reg. Num, ADDRINT * ymm. Mem. Src. Ptr) { PIN_Safe. Copy(ymm. Regs[ymm. Dst. Reg. Num], ymm. Mem. Src. Ptr, 32); } VOID Em. Vmovdqu. Reg 2 Mem(int ymm. Src. Reg. Num, ADDRINT * ymm. Mem. Dst. Ptr) { PIN_Safe. Copy(ymm. Mem. Dst. Ptr, ymm. Regs[ymm. Reg. Num], 32); } VOID Instruction(INS ins, VOID *v) { switch (INS_Opcode(ins) { : : : case XED_ICLASS_VMOVDQU: if (INS_Is. Memory. Read(ins)) // vmovdqu ymm? <= mem 256 INS_Insert. Call(ins, IPOINT_BEFORE, (AFUNPTR)Em. Vmovdqu. Mem 2 Reg, IARG_UINT 32, REG(INS_Operand. Reg(ins, 0)) - REG_YMM 0, IARG_MEMORYREAD_EA, IARG_END); else if (INS_Is. Memory. Write(ins)) // vmovdqu mem 256 <= ymm? INS_Insert. Call(ins, IPOINT_BEFORE, (AFUNPTR)Em. Vmovdqu. Reg 2 Mem, IARG_UINT 32, REG(INS_Operand. Reg(ins, 1)) - REG_YMM 0, IARG_MEMORYWRITE_EA, IARG_END); INS_Delete. Ins(ins); //Processor does NOT execute this instruction break; }} int main(int argc, CHAR *argv[]) { PIN_Init(argc, argv)); INS_Add. Instrument. Function(Instruction, 0); PIN_Start. Program(); } Software & Services Group 26
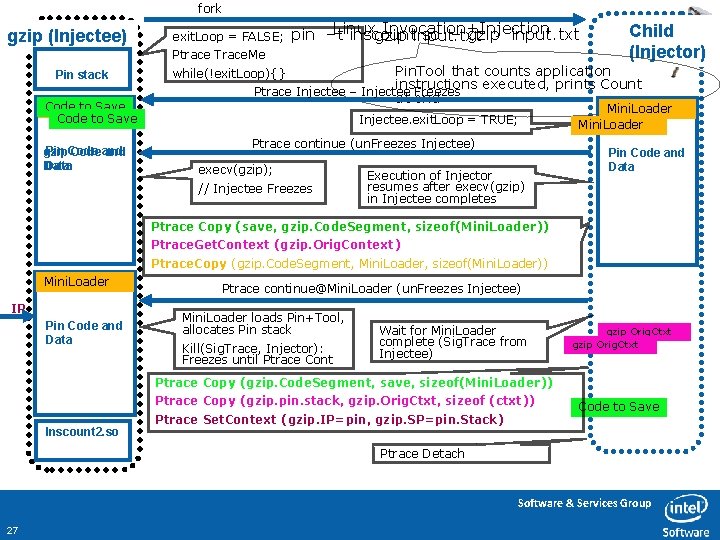
fork gzip (Injectee) Pin stack Code to Save Mini. Loader Code to Save Pin Code gzip Codeand Data exit. Loop = FALSE; Linux Invocation+Injection pin –t inscount. so – gzip input. txt Ptrace Trace. Me Child (Injector) Pin. Tool that counts application while(!exit. Loop){} instructions executed, prints Count Ptrace Injectee – Injectee Freezes at end Mini. Loader Injectee. exit. Loop = TRUE; Mini. Loader Ptrace continue (un. Freezes Injectee) execv(gzip); // Injectee Freezes Execution of Injector resumes after execv(gzip) in Injectee completes Pin Code and Data Ptrace Copy (save, gzip. Code. Segment, sizeof(Mini. Loader)) Ptrace. Get. Context (gzip. Orig. Context) Ptrace. Copy (gzip. Code. Segment, Mini. Loader, sizeof(Mini. Loader)) Mini. Loader IP Pin Code and Data Ptrace continue@Mini. Loader (un. Freezes Injectee) Mini. Loader loads Pin+Tool, allocates Pin stack Kill(Sig. Trace, Injector): Freezes until Ptrace Cont Wait for Mini. Loader complete (Sig. Trace from Injectee) gzip Orig. Ctxt Ptrace Copy (gzip. Code. Segment, save, sizeof(Mini. Loader)) Ptrace Copy (gzip. pin. stack, gzip. Orig. Ctxt, sizeof (ctxt)) Inscount 2. so Ptrace Set. Context (gzip. IP=pin, gzip. SP=pin. Stack) Code to Save Ptrace Detach Software & Services Group 27
Part 1 Summary • Pin is Intel’s dynamic binary instrumentation engine • Pin can be used to instrument all user level code – – – Windows, Linux IA-32, Intel 64, IA 64 Product level robustness Jit-Mode for full instrumentation: Thread, Function, Trace, BBL, Instruction Probe-Mode for Function Replacement/Wrapping/Instrumentation only. Pin supports multi-threading, no serialization of jitted application nor of instrumentation code • Pin API makes Pin Tools easy to write – Presented 6 full Pin tools, each one fit on 1 ppt slide • Popular and well supported – 30, 000+ downloads, 400+ citations • Free Down. Load – www. pintool. org – Includes: Detailed user manual, source code for 100 s of Pin tools • Pin User Group – http: //tech. groups. yahoo. com/group/pinheads/ – Pin users and Pin developers answer questions Software & Services Group 28
Part 2: Larger Pin tools and writing efficient Pin tools Software & Services Group 29
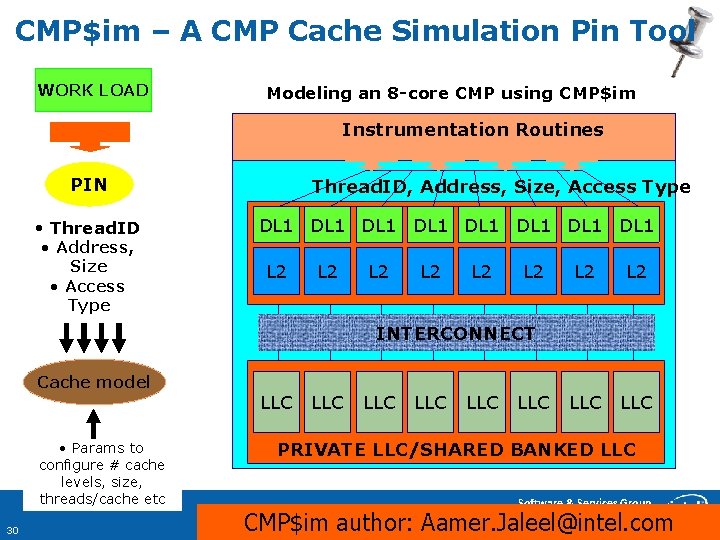
CMP$im – A CMP Cache Simulation Pin Tool WORK LOAD Modeling an 8 -core CMP using CMP$im Instrumentation Routines PIN • Thread. ID • Address, Size • Access Type Thread. ID, Address, Size, Access Type DL 1 DL 1 L 2 L 2 LLC INTERCONNECT Cache model • Params to configure # cache levels, size, threads/cache etc 30 LLC LLC LLC PRIVATE LLC/SHARED BANKED LLC Software & Services Group CMP$im author: Aamer. Jaleel@intel. com
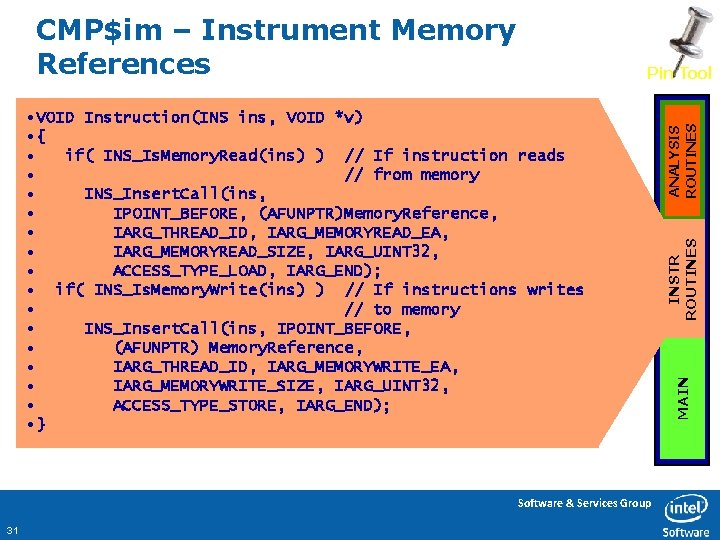
CMP$im – Instrument Memory References Software & Services Group 31 INSTR ROUTINES MAIN • VOID Instruction(INS ins, VOID *v) • { • if( INS_Is. Memory. Read(ins) ) // If instruction reads • // from memory • INS_Insert. Call(ins, • IPOINT_BEFORE, (AFUNPTR)Memory. Reference, • IARG_THREAD_ID, IARG_MEMORYREAD_EA, • IARG_MEMORYREAD_SIZE, IARG_UINT 32, • ACCESS_TYPE_LOAD, IARG_END); • if( INS_Is. Memory. Write(ins) ) // If instructions writes • // to memory • INS_Insert. Call(ins, IPOINT_BEFORE, • (AFUNPTR) Memory. Reference, • IARG_THREAD_ID, IARG_MEMORYWRITE_EA, • IARG_MEMORYWRITE_SIZE, IARG_UINT 32, • ACCESS_TYPE_STORE, IARG_END); • } ANALYSIS ROUTINES Pin Tool
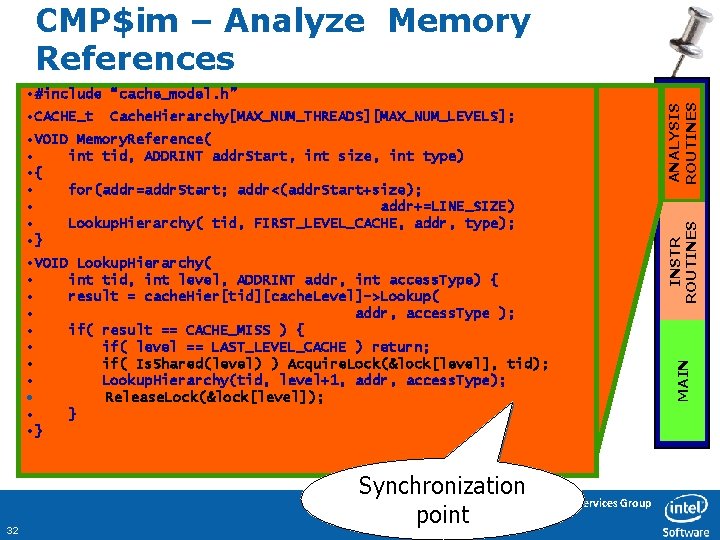
CMP$im – Analyze Memory References • VOID Memory. Reference( • int tid, ADDRINT addr. Start, int size, int type) • { • for(addr=addr. Start; addr<(addr. Start+size); • addr+=LINE_SIZE) • Lookup. Hierarchy( tid, FIRST_LEVEL_CACHE, addr, type); • } • VOID Lookup. Hierarchy( • int tid, int level, ADDRINT addr, int access. Type) { • result = cache. Hier[tid][cache. Level]->Lookup( • addr, access. Type ); • if( result == CACHE_MISS ) { • if( level == LAST_LEVEL_CACHE ) return; • if( Is. Shared(level) ) Acquire. Lock(&lock[level], tid); • Lookup. Hierarchy(tid, level+1, addr, access. Type); • Release. Lock(&lock[level]); • } 32 Synchronization Software & Services Group point INSTR ROUTINES Cache. Hierarchy[MAX_NUM_THREADS][MAX_NUM_LEVELS]; MAIN • CACHE_t ANALYSIS ROUTINES • #include “cache_model. h”
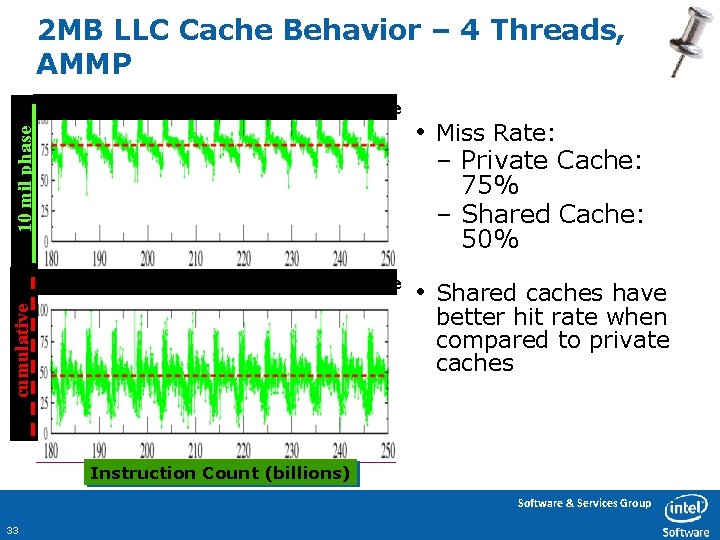
2 MB LLC Cache Behavior – 4 Threads, AMMP 10 mil phase 0 Private Cache Miss Rate cumulative 0 Shared Cache Miss Rate • Miss Rate: • Shared caches have better hit rate when compared to private caches – Private Cache: 75% – Shared Cache: 50% Instruction Count (billions) Software & Services Group 33
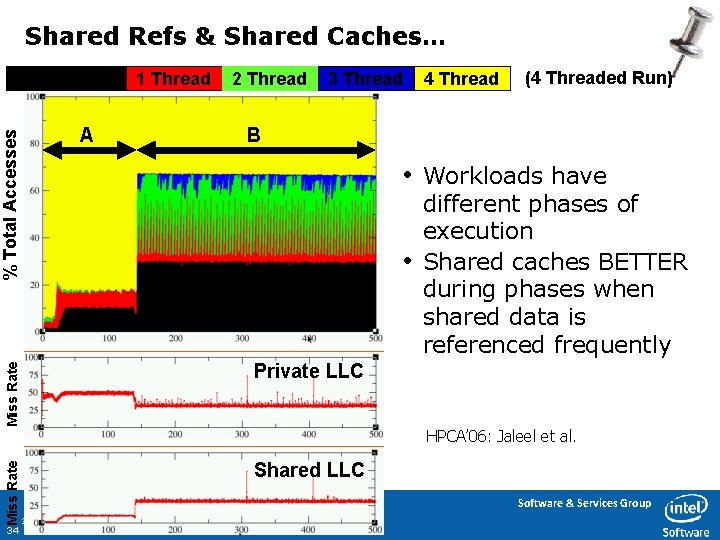
Shared Refs & Shared Caches… Cache Miss % Total Accesses A 1 Thread 2 Thread 3 Thread (4 Threaded Run) B • • Miss Rate Private LLC Miss Rate Gene. Net – 16 MB LLC Shared LLC 34 4 Thread Workloads have different phases of execution Shared caches BETTER during phases when shared data is referenced frequently HPCA’ 06: Jaleel et al. Software & Services Group 34
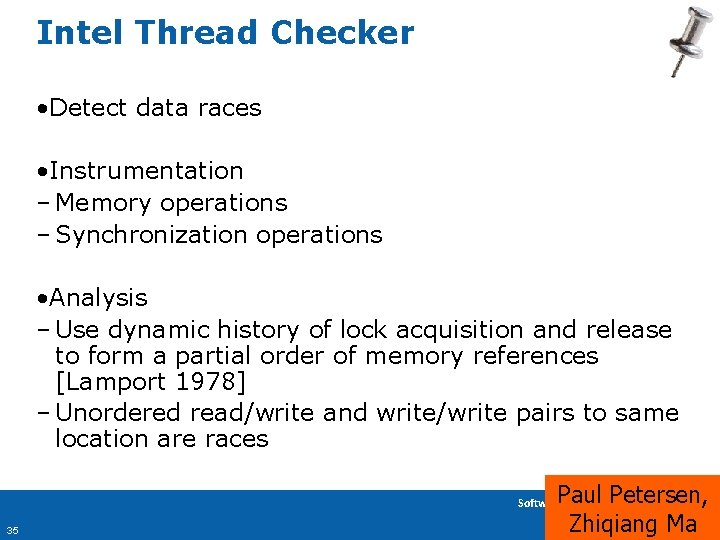
Intel Thread Checker • Detect data races • Instrumentation – Memory operations – Synchronization operations • Analysis – Use dynamic history of lock acquisition and release to form a partial order of memory references [Lamport 1978] – Unordered read/write and write/write pairs to same location are races Paul Petersen, Zhiqiang Ma Software & Services Group 35
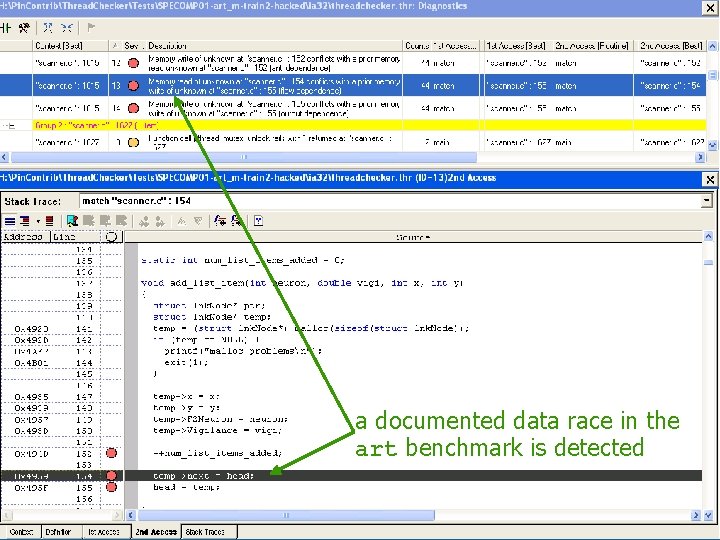
a documented data race in the art benchmark is detected Software & Services Group 36 36
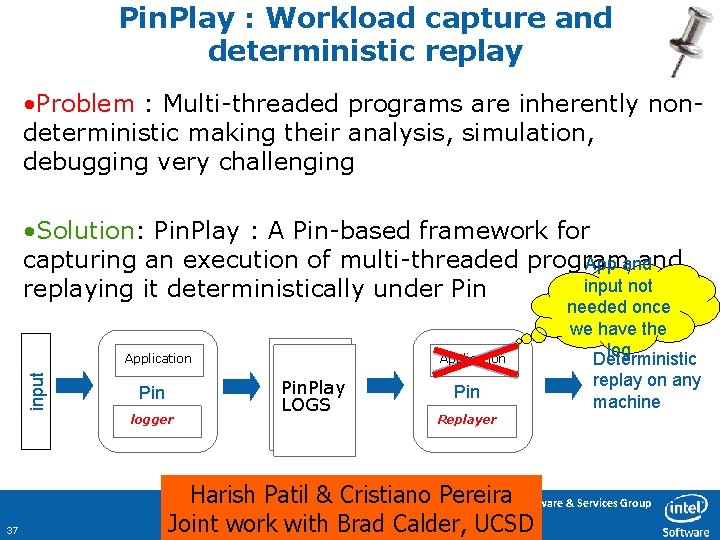
Pin. Play : Workload capture and deterministic replay • Problem : Multi-threaded programs are inherently nondeterministic making their analysis, simulation, debugging very challenging • Solution: Pin. Play : A Pin-based framework for capturing an execution of multi-threaded program and App and input not replaying it deterministically under Pin Application input Application Pin logger 37 Pin. Play LOGS Pin needed once we have the log Deterministic replay on any machine Replayer Harish Patil & Cristiano Pereira Software & Services Group Joint work with Brad Calder, UCSD
Logging to provide deterministic behavior • Start with checkpoint: memory image of code and data • A thread is deterministic if every loads sees either: – Data from original checkpoint – Or a value computed and stored on the thread • Potential non-determinism when a load sees a memory location written by an external agent – Another thread – Or system call, DMA, etc. • Log these values with timestamps Software & Services Group 38
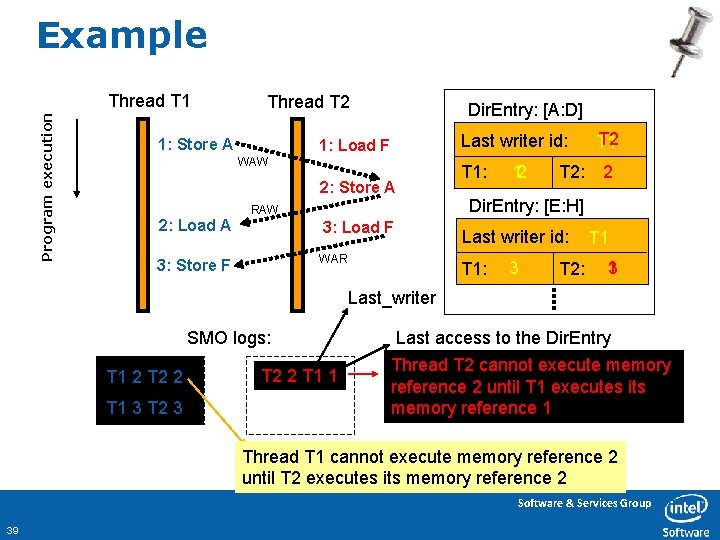
Example Program execution Thread T 1 Thread T 2 1: Store A Dir. Entry: [A: D] Last writer id: 1: Load F WAW T 1: 2: Store A 3: Load F Last writer id: WAR 3: Store F T 2: 2 Dir. Entry: [E: H] RAW 2: Load A 12 T 1 T 1: 3 T 2: T 1 13 Last_writer SMO logs: T 1 2 T 2 2 T 1 3 T 2 2 T 1 1 Last access to the Dir. Entry Thread T 2 cannot execute memory reference 2 until T 1 executes its memory reference 1 Thread T 1 cannot execute memory reference 2 until T 2 executes its memory reference 2 Software & Services Group 39
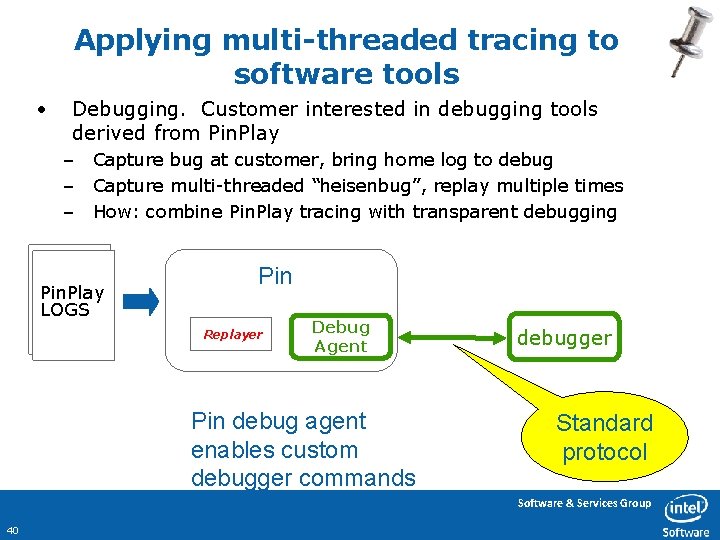
Applying multi-threaded tracing to software tools • Debugging. Customer interested in debugging tools derived from Pin. Play – Capture bug at customer, bring home log to debug – Capture multi-threaded “heisenbug”, replay multiple times – How: combine Pin. Play tracing with transparent debugging Pin. Play LOGS Pin Replayer Debug Agent Pin debug agent enables custom debugger commands debugger Standard protocol Software & Services Group 40
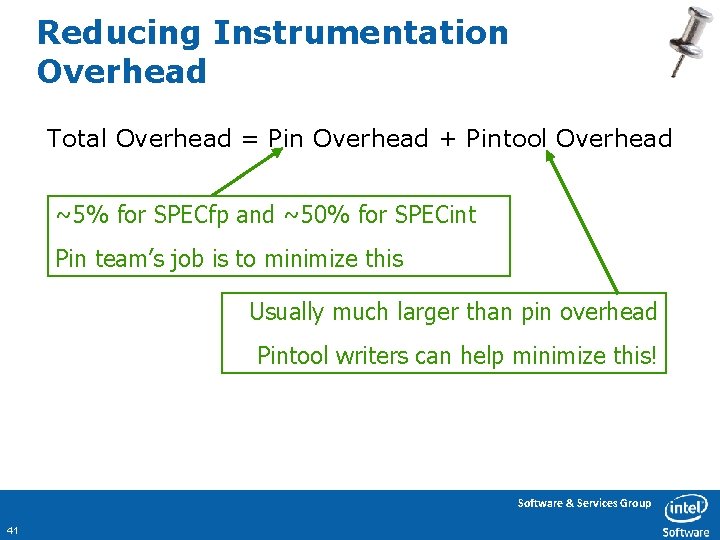
Reducing Instrumentation Overhead Total Overhead = Pin Overhead + Pintool Overhead ~5% for SPECfp and ~50% for SPECint Pin team’s job is to minimize this Usually much larger than pin overhead Pintool writers can help minimize this! Software & Services Group 41
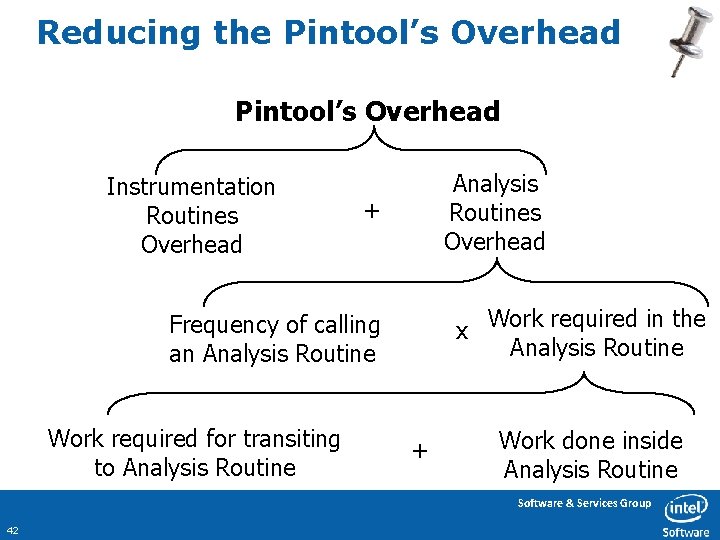
Reducing the Pintool’s Overhead Instrumentation Routines Overhead Analysis Routines Overhead + x Work required in the Analysis Routine Frequency of calling an Analysis Routine Work required for transiting to Analysis Routine + Work done inside Analysis Routine Software & Services Group 42
Reducing Work in Analysis Routines • Key: Shift computation from analysis routines to instrumentation routines whenever possible • This usually has the largest speedup Software & Services Group 43
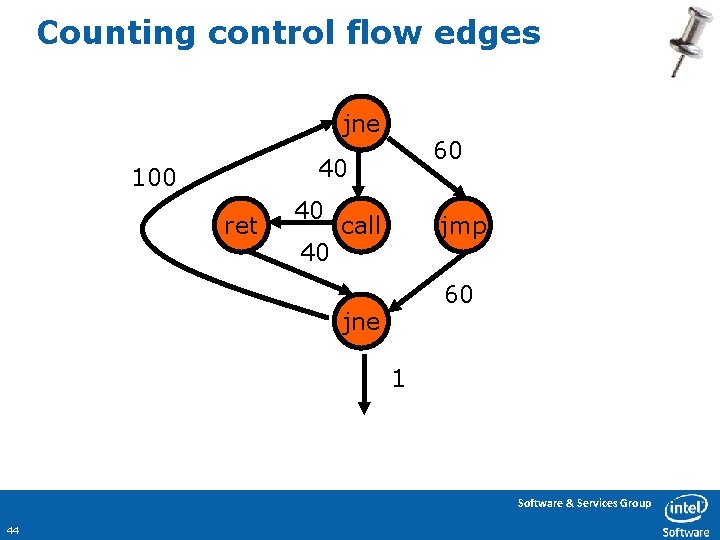
Counting control flow edges jne 60 40 100 ret 40 40 call jmp 60 jne 1 Software & Services Group 44
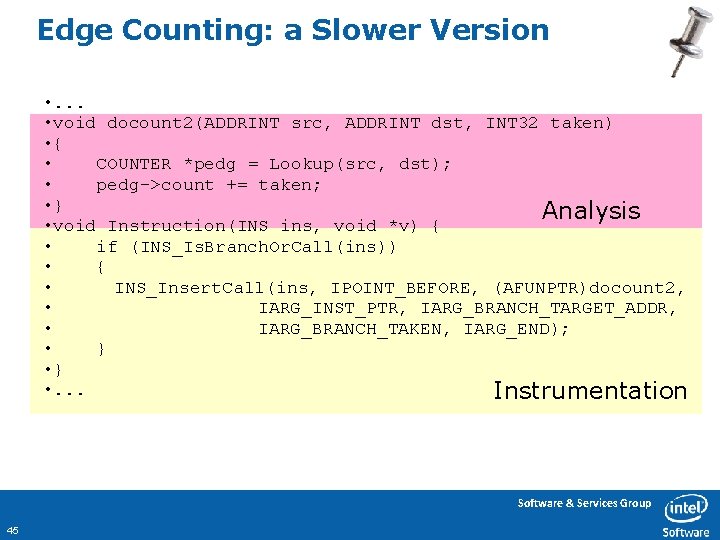
Edge Counting: a Slower Version • . . . • void docount 2(ADDRINT src, ADDRINT dst, INT 32 taken) • { • COUNTER *pedg = Lookup(src, dst); • pedg->count += taken; • } Analysis • void Instruction(INS ins, void *v) { • if (INS_Is. Branch. Or. Call(ins)) • { • INS_Insert. Call(ins, IPOINT_BEFORE, (AFUNPTR)docount 2, • IARG_INST_PTR, IARG_BRANCH_TARGET_ADDR, • IARG_BRANCH_TAKEN, IARG_END); • } • . . . Instrumentation Software & Services Group 45
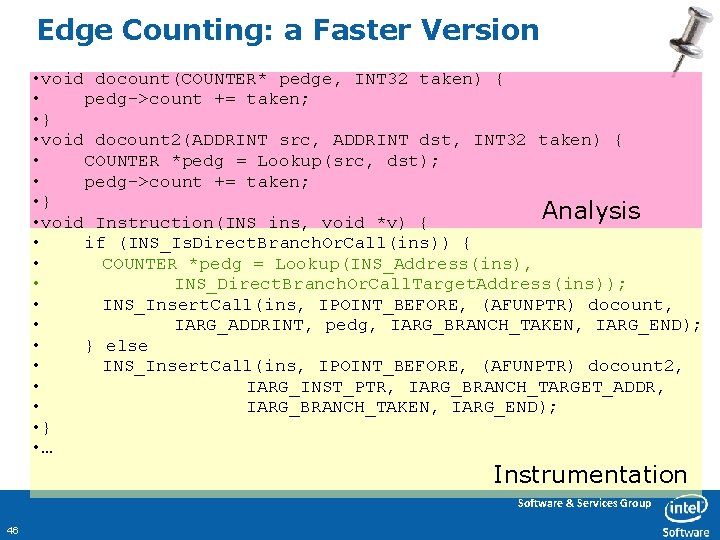
Edge Counting: a Faster Version • void docount(COUNTER* pedge, INT 32 taken) { • pedg->count += taken; • } • void docount 2(ADDRINT src, ADDRINT dst, INT 32 taken) { • COUNTER *pedg = Lookup(src, dst); • pedg->count += taken; • } Analysis • void Instruction(INS ins, void *v) { • if (INS_Is. Direct. Branch. Or. Call(ins)) { • COUNTER *pedg = Lookup(INS_Address(ins), • INS_Direct. Branch. Or. Call. Target. Address(ins)); • INS_Insert. Call(ins, IPOINT_BEFORE, (AFUNPTR) docount, • IARG_ADDRINT, pedg, IARG_BRANCH_TAKEN, IARG_END); • } else • INS_Insert. Call(ins, IPOINT_BEFORE, (AFUNPTR) docount 2, • IARG_INST_PTR, IARG_BRANCH_TARGET_ADDR, • IARG_BRANCH_TAKEN, IARG_END); • } • … Instrumentation Software & Services Group 46
Analysis Routines: Reduce Call Frequency • Key: Instrument at the largest granularity whenever possible Instead of inserting one call per instruction Insert one call per basic block or trace Software & Services Group 47
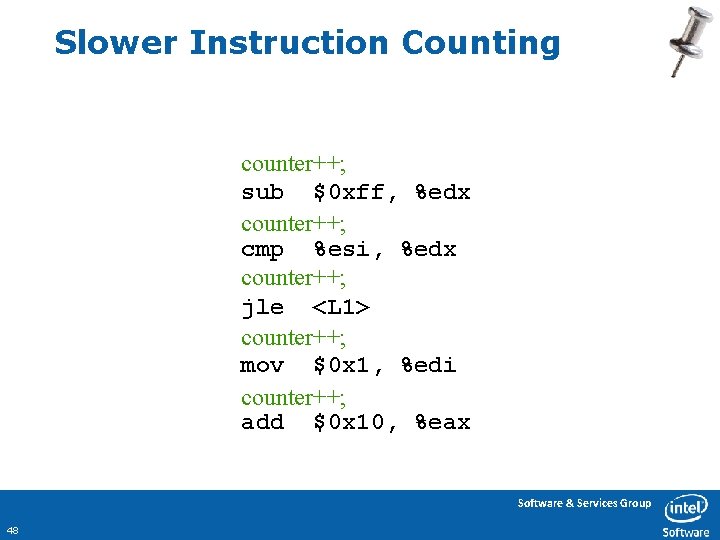
Slower Instruction Counting counter++; sub $0 xff, %edx counter++; cmp %esi, %edx counter++; jle <L 1> counter++; mov $0 x 1, %edi counter++; add $0 x 10, %eax Software & Services Group 48
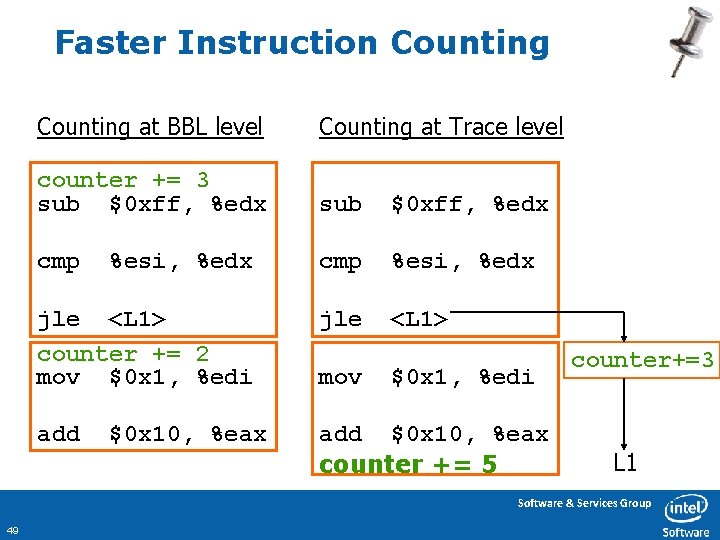
Faster Instruction Counting at BBL level Counting at Trace level counter += 3 sub $0 xff, %edx cmp %esi, %edx jle <L 1> counter += 2 mov $0 x 1, %edi jle <L 1> add $0 x 10, %eax counter += 5 $0 x 10, %eax mov $0 x 1, %edi counter+=3 L 1 Software & Services Group 49
Reducing Work for Analysis Transitions • Reduce number of arguments to analysis routines – Inline analysis routines – Pass arguments in registers – Instrumentation scheduling Software & Services Group 50
Reduce Number of Arguments • Eliminate arguments only used for debugging • Instead of passing TRUE/FALSE, create 2 analysis functions – Instead of inserting a call to: Analysis(BOOL val) – Insert a call to one of these: Analysis. True() Analysis. False() – IARG_CONTEXT is very expensive (> 10 arguments) Software & Services Group 51
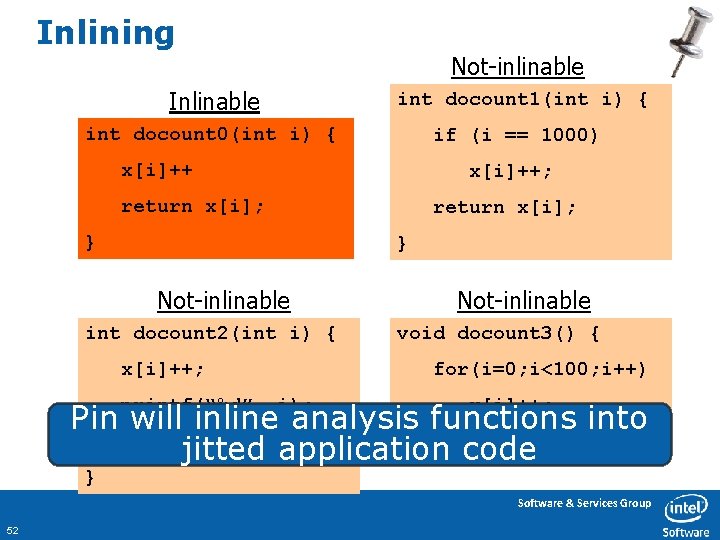
Inlining Not-inlinable Inlinable int docount 1(int i) { int docount 0(int i) { if (i == 1000) x[i]++; return x[i]; } Not-inlinable int docount 2(int i) { x[i]++; printf(“%d”, i); Not-inlinable void docount 3() { for(i=0; i<100; i++) x[i]++; Pin will inline analysis functions into return x[i]; } jitted application code } Software & Services Group 52
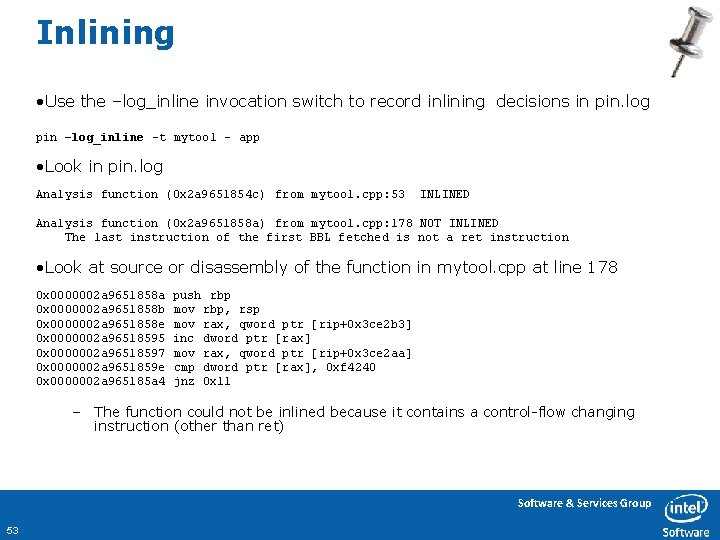
Inlining • Use the –log_inline invocation switch to record inlining decisions in pin. log pin –log_inline –t mytool – app • Look in pin. log Analysis function (0 x 2 a 9651854 c) from mytool. cpp: 53 INLINED Analysis function (0 x 2 a 9651858 a) from mytool. cpp: 178 NOT INLINED The last instruction of the first BBL fetched is not a ret instruction • Look at source or disassembly of the function in mytool. cpp at line 178 0 x 0000002 a 9651858 a 0 x 0000002 a 9651858 b 0 x 0000002 a 9651858 e 0 x 0000002 a 96518595 0 x 0000002 a 96518597 0 x 0000002 a 9651859 e 0 x 0000002 a 965185 a 4 push rbp mov rbp, rsp mov rax, qword ptr [rip+0 x 3 ce 2 b 3] inc dword ptr [rax] mov rax, qword ptr [rip+0 x 3 ce 2 aa] cmp dword ptr [rax], 0 xf 4240 jnz 0 x 11 – The function could not be inlined because it contains a control-flow changing instruction (other than ret) Software & Services Group 53
Conditional Inlining • Inline a common scenario where the analysis routine has a single “if-then” – The “If” part is always executed – The “then” part is rarely executed – Useful cases: 1. “If” can be inlined, “Then” is not 2. “If” has small number of arguments, “then” has many arguments (or IARG_CONTEXT) • Pintool writer breaks analysis routine into two: – INS_Insert. If. Call (ins, …, (AFUNPTR)doif, …) – INS_Insert. Then. Call (ins, …, (AFUNPTR)dothen, …) Software & Services Group 54
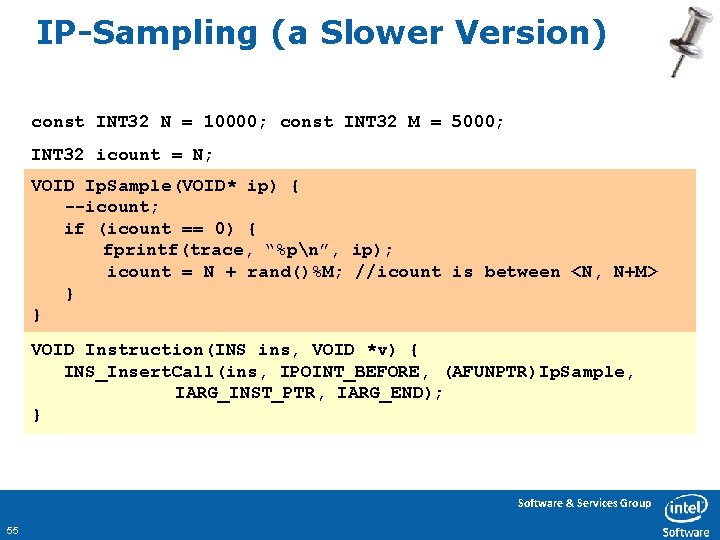
IP-Sampling (a Slower Version) const INT 32 N = 10000; const INT 32 M = 5000; INT 32 icount = N; VOID Ip. Sample(VOID* ip) { --icount; if (icount == 0) { fprintf(trace, “%pn”, ip); icount = N + rand()%M; //icount is between <N, N+M> } } VOID Instruction(INS ins, VOID *v) { INS_Insert. Call(ins, IPOINT_BEFORE, (AFUNPTR)Ip. Sample, IARG_INST_PTR, IARG_END); } Software & Services Group 55
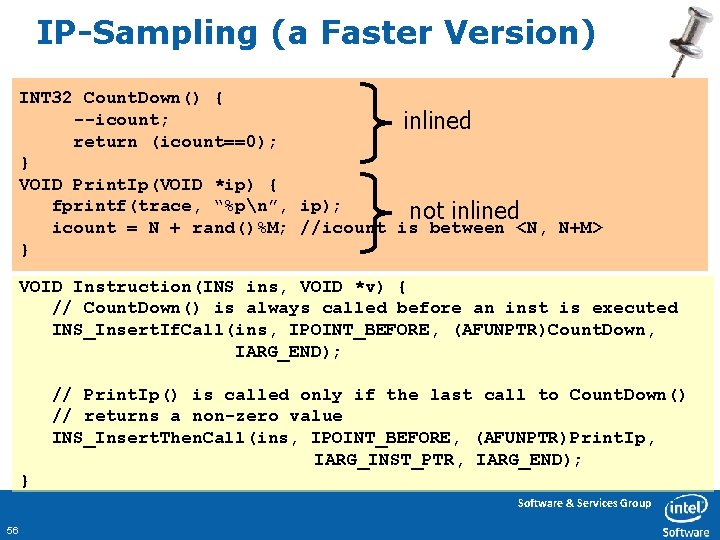
IP-Sampling (a Faster Version) INT 32 Count. Down() { --icount; inlined return (icount==0); } VOID Print. Ip(VOID *ip) { fprintf(trace, “%pn”, ip); not inlined icount = N + rand()%M; //icount is between <N, N+M> } VOID Instruction(INS ins, VOID *v) { // Count. Down() is always called before an inst is executed INS_Insert. If. Call(ins, IPOINT_BEFORE, (AFUNPTR)Count. Down, IARG_END); // Print. Ip() is called only if the last call to Count. Down() // returns a non-zero value INS_Insert. Then. Call(ins, IPOINT_BEFORE, (AFUNPTR)Print. Ip, IARG_INST_PTR, IARG_END); } Software & Services Group 56
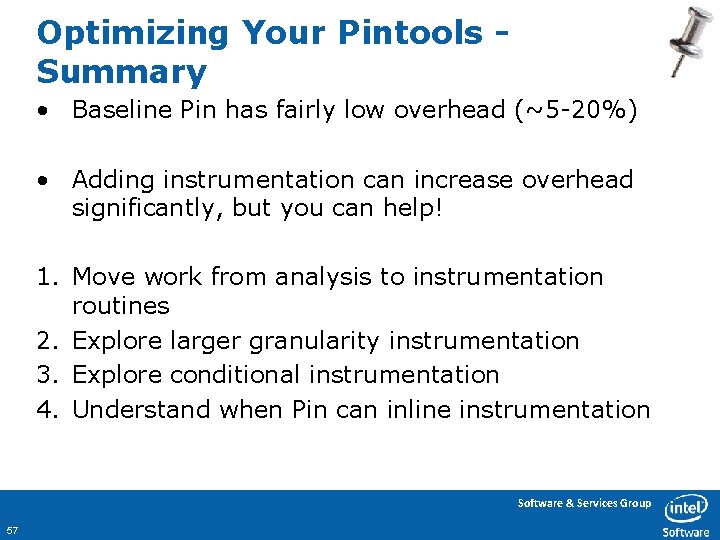
Optimizing Your Pintools Summary • Baseline Pin has fairly low overhead (~5 -20%) • Adding instrumentation can increase overhead significantly, but you can help! 1. Move work from analysis to instrumentation routines 2. Explore larger granularity instrumentation 3. Explore conditional instrumentation 4. Understand when Pin can inline instrumentation Software & Services Group 57
Part 3: Deeper into Pin API • Agenda – memtrace_simple tool – membuffer_simple tool – branchbuffer_simple tool – Symbols Debug. Info – Probe-Mode – Multi-Threading Software & Services Group 58
memtrace_simple • Tool code collects pairs of {app. IP, mem. Addr} of memory accessing instructions into a per-thread buffer – Remember: It is the application thread(s) that execute the Pin Tool code. • When the buffer becomes full, tool code processes the entries in the buffer, resets the collection to start at the beginning of the buffer, then execution continues – and so-forth. • Is a representative of many memory-trace processing tools Software & Services Group 59
memtrace_simple • Tool code must – Instrument each memory accessing instruction – Determine where in the buffer the {app. IP, mem. Addr} of the instruction should be written – Determine when the buffer becomes full • Will instrument instructions on Trace level – i. e. TRACE_Add. Instrument. Function(Trace, 0); – Not all instructions in the trace will necessarily execute each time trace is executed – because of early exits. • Will try to allocate, in the buffer, maximum space needed by trace at the trace start – if not enough space => buffer is full Software & Services Group 60
memtrace_simple • Instrumentation code for each memory accessing instruction in the trace will write it’s {app. IP, mem. Addr} pair to a constant offset from the start of the trace in the buffer. – Empty pairs (those instructions that were NOT executed) will be denoted by having an app. IP==0. Software & Services Group 61
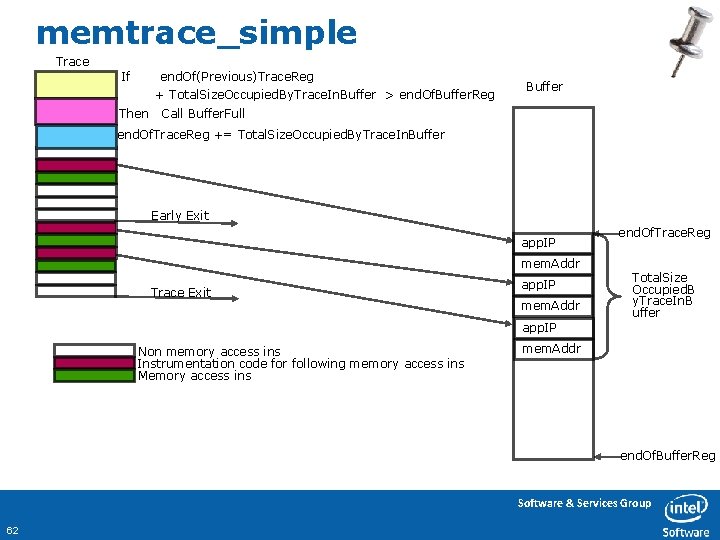
memtrace_simple Trace If end. Of(Previous)Trace. Reg + Total. Size. Occupied. By. Trace. In. Buffer > end. Of. Buffer. Reg Then Buffer Call Buffer. Full end. Of. Trace. Reg += Total. Size. Occupied. By. Trace. In. Buffer Early Exit app. IP mem. Addr Trace Exit app. IP mem. Addr end. Of. Trace. Reg Total. Size Occupied. B y. Trace. In. B uffer app. IP Non memory access ins Instrumentation code for following memory access ins Memory access ins mem. Addr end. Of. Buffer. Reg Software & Services Group 62
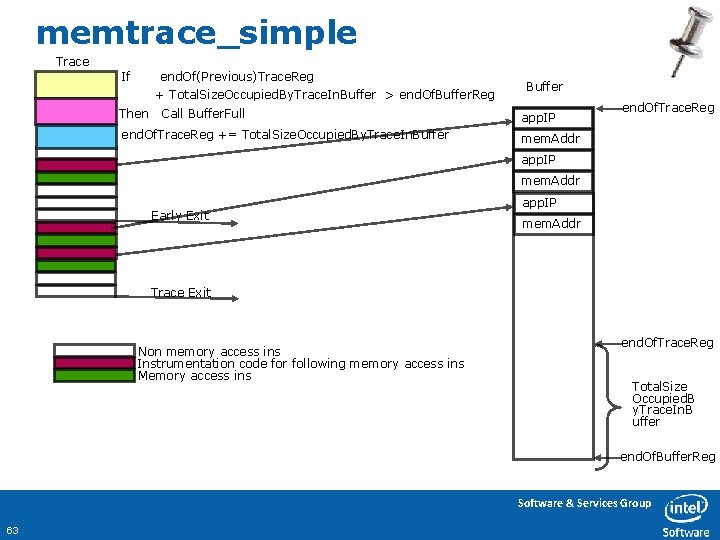
memtrace_simple Trace If end. Of(Previous)Trace. Reg + Total. Size. Occupied. By. Trace. In. Buffer > end. Of. Buffer. Reg Then Call Buffer. Full end. Of. Trace. Reg += Total. Size. Occupied. By. Trace. In. Buffer app. IP end. Of. Trace. Reg mem. Addr app. IP mem. Addr Early Exit app. IP mem. Addr Trace Exit Non memory access ins Instrumentation code for following memory access ins Memory access ins end. Of. Trace. Reg Total. Size Occupied. B y. Trace. In. B uffer end. Of. Buffer. Reg Software & Services Group 63
memtrace_simple • Tool will: – iterate thru all INSs of the Trace – Record which ones need to be instrumented (access memory) – Record the ins, the memop, the offset from start of the trace in the buffer where the {app. IP, mem. Addr} pair of this ins should be written – Get a sum of the Total. Size. Occupied. By. Trace. In. Buffer – Insert the IF-THEN sequence at the beginning of the trace – Insert the update of end. Of. Trace. Reg just after the IF-THEN sequence – iterate thru recorded (memory accessing) INSs of the Trace – Insert the instrumentation code before each recorded memory accessing instruction – this is the code that writes the {app. IP, mem. Addr} pair into the buffer at the designated offset (from start of trace) for this INS. – end. Of. Trace. Reg and end. Of. Buffer. Reg are virtual registers allocated by Pin to the Pin tool. Software & Services Group 64
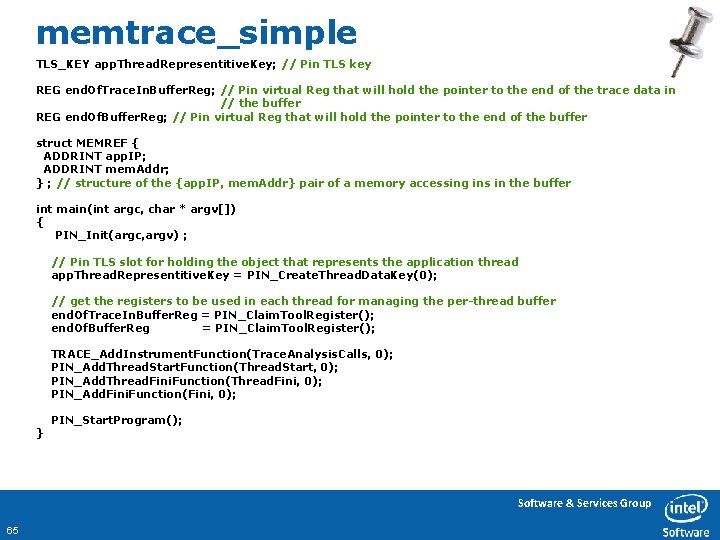
memtrace_simple TLS_KEY app. Thread. Representitive. Key; // Pin TLS key REG end. Of. Trace. In. Buffer. Reg; // Pin virtual Reg that will hold the pointer to the end of the trace data in // the buffer REG end. Of. Buffer. Reg; // Pin virtual Reg that will hold the pointer to the end of the buffer struct MEMREF { ADDRINT app. IP; ADDRINT mem. Addr; } ; // structure of the {app. IP, mem. Addr} pair of a memory accessing ins in the buffer int main(int argc, char * argv[]) { PIN_Init(argc, argv) ; // Pin TLS slot for holding the object that represents the application thread app. Thread. Representitive. Key = PIN_Create. Thread. Data. Key(0); // get the registers to be used in each thread for managing the per-thread buffer end. Of. Trace. In. Buffer. Reg = PIN_Claim. Tool. Register(); end. Of. Buffer. Reg = PIN_Claim. Tool. Register(); TRACE_Add. Instrument. Function(Trace. Analysis. Calls, 0); PIN_Add. Thread. Start. Function(Thread. Start, 0); PIN_Add. Thread. Fini. Function(Thread. Fini, 0); PIN_Add. Fini. Function(Fini, 0); } PIN_Start. Program(); Software & Services Group 65
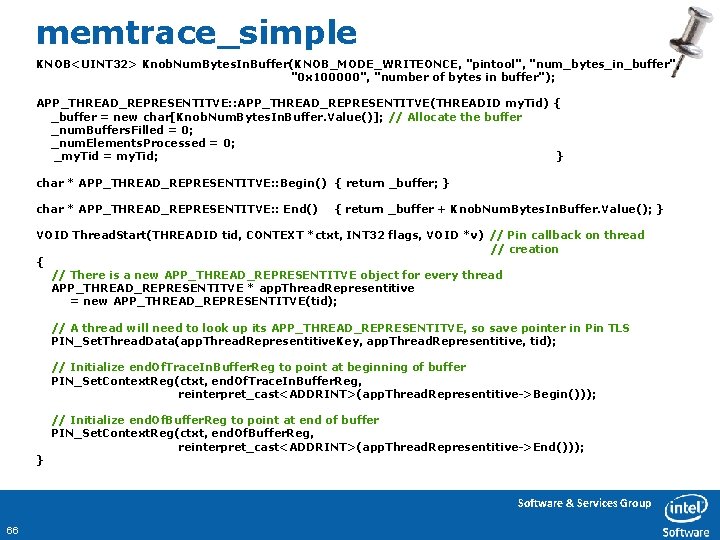
memtrace_simple KNOB<UINT 32> Knob. Num. Bytes. In. Buffer(KNOB_MODE_WRITEONCE, "pintool", "num_bytes_in_buffer", "0 x 100000", "number of bytes in buffer"); APP_THREAD_REPRESENTITVE: : APP_THREAD_REPRESENTITVE(THREADID my. Tid) { _buffer = new char[Knob. Num. Bytes. In. Buffer. Value()]; // Allocate the buffer _num. Buffers. Filled = 0; _num. Elements. Processed = 0; _my. Tid = my. Tid; } char * APP_THREAD_REPRESENTITVE: : Begin() { return _buffer; } char * APP_THREAD_REPRESENTITVE: : End() { return _buffer + Knob. Num. Bytes. In. Buffer. Value(); } VOID Thread. Start(THREADID tid, CONTEXT *ctxt, INT 32 flags, VOID *v) // Pin callback on thread // creation { // There is a new APP_THREAD_REPRESENTITVE object for every thread APP_THREAD_REPRESENTITVE * app. Thread. Representitive = new APP_THREAD_REPRESENTITVE(tid); // A thread will need to look up its APP_THREAD_REPRESENTITVE, so save pointer in Pin TLS PIN_Set. Thread. Data(app. Thread. Representitive. Key, app. Thread. Representitive, tid); // Initialize end. Of. Trace. In. Buffer. Reg to point at beginning of buffer PIN_Set. Context. Reg(ctxt, end. Of. Trace. In. Buffer. Reg, reinterpret_cast<ADDRINT>(app. Thread. Representitive->Begin())); } // Initialize end. Of. Buffer. Reg to point at end of buffer PIN_Set. Context. Reg(ctxt, end. Of. Buffer. Reg, reinterpret_cast<ADDRINT>(app. Thread. Representitive->End())); Software & Services Group 66
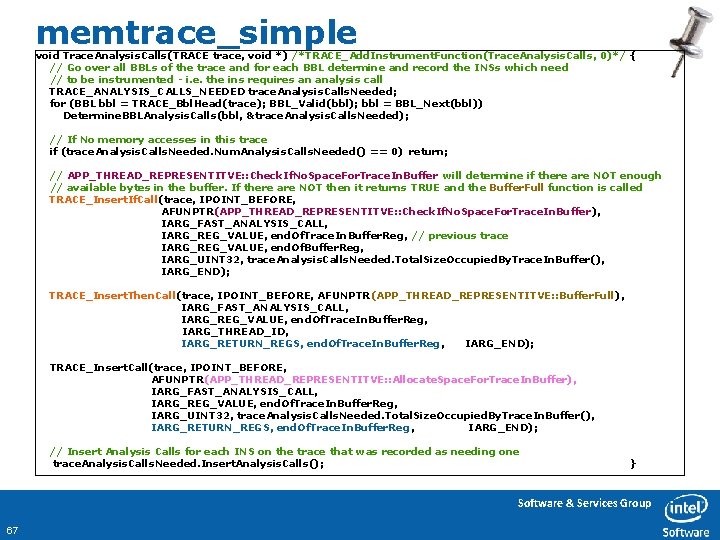
memtrace_simple void Trace. Analysis. Calls(TRACE trace, void *) /*TRACE_Add. Instrument. Function(Trace. Analysis. Calls, 0)*/ { // Go over all BBLs of the trace and for each BBL determine and record the INSs which need // to be instrumented - i. e. the ins requires an analysis call TRACE_ANALYSIS_CALLS_NEEDED trace. Analysis. Calls. Needed; for (BBL bbl = TRACE_Bbl. Head(trace); BBL_Valid(bbl); bbl = BBL_Next(bbl)) Determine. BBLAnalysis. Calls(bbl, &trace. Analysis. Calls. Needed); // If No memory accesses in this trace if (trace. Analysis. Calls. Needed. Num. Analysis. Calls. Needed() == 0) return; // APP_THREAD_REPRESENTITVE: : Check. If. No. Space. For. Trace. In. Buffer will determine if there are NOT enough // available bytes in the buffer. If there are NOT then it returns TRUE and the Buffer. Full function is called TRACE_Insert. If. Call(trace, IPOINT_BEFORE, AFUNPTR(APP_THREAD_REPRESENTITVE: : Check. If. No. Space. For. Trace. In. Buffer ), IARG_FAST_ANALYSIS_CALL, IARG_REG_VALUE, end. Of. Trace. In. Buffer. Reg, // previous trace IARG_REG_VALUE, end. Of. Buffer. Reg, IARG_UINT 32, trace. Analysis. Calls. Needed. Total. Size. Occupied. By. Trace. In. Buffer(), IARG_END); TRACE_Insert. Then. Call(trace, IPOINT_BEFORE, AFUNPTR(APP_THREAD_REPRESENTITVE: : Buffer. Full), IARG_FAST_ANALYSIS_CALL, IARG_REG_VALUE, end. Of. Trace. In. Buffer. Reg, IARG_THREAD_ID, IARG_RETURN_REGS, end. Of. Trace. In. Buffer. Reg, IARG_END); TRACE_Insert. Call(trace, IPOINT_BEFORE, AFUNPTR(APP_THREAD_REPRESENTITVE: : Allocate. Space. For. Trace. In. Buffer), IARG_FAST_ANALYSIS_CALL, IARG_REG_VALUE, end. Of. Trace. In. Buffer. Reg, IARG_UINT 32, trace. Analysis. Calls. Needed. Total. Size. Occupied. By. Trace. In. Buffer(), IARG_RETURN_REGS, end. Of. Trace. In. Buffer. Reg, IARG_END); // Insert Analysis Calls for each INS on the trace that was recorded as needing one trace. Analysis. Calls. Needed. Insert. Analysis. Calls(); } Software & Services Group 67
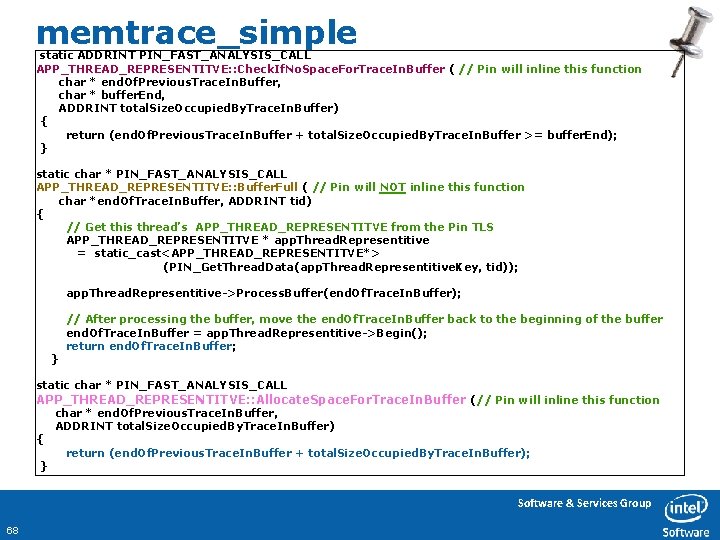
memtrace_simple static ADDRINT PIN_FAST_ANALYSIS_CALL APP_THREAD_REPRESENTITVE: : Check. If. No. Space. For. Trace. In. Buffer ( // Pin will inline this function char * end. Of. Previous. Trace. In. Buffer, char * buffer. End, ADDRINT total. Size. Occupied. By. Trace. In. Buffer) { return (end. Of. Previous. Trace. In. Buffer + total. Size. Occupied. By. Trace. In. Buffer >= buffer. End); } static char * PIN_FAST_ANALYSIS_CALL APP_THREAD_REPRESENTITVE: : Buffer. Full ( // Pin will NOT inline this function char *end. Of. Trace. In. Buffer, ADDRINT tid) { // Get this thread’s APP_THREAD_REPRESENTITVE from the Pin TLS APP_THREAD_REPRESENTITVE * app. Thread. Representitive = static_cast<APP_THREAD_REPRESENTITVE*> (PIN_Get. Thread. Data(app. Thread. Representitive. Key, tid)); app. Thread. Representitive->Process. Buffer(end. Of. Trace. In. Buffer); } // After processing the buffer, move the end. Of. Trace. In. Buffer back to the beginning of the buffer end. Of. Trace. In. Buffer = app. Thread. Representitive->Begin(); return end. Of. Trace. In. Buffer; static char * PIN_FAST_ANALYSIS_CALL APP_THREAD_REPRESENTITVE: : Allocate. Space. For. Trace. In. Buffer (// Pin will inline this function { } char * end. Of. Previous. Trace. In. Buffer, ADDRINT total. Size. Occupied. By. Trace. In. Buffer) return (end. Of. Previous. Trace. In. Buffer + total. Size. Occupied. By. Trace. In. Buffer); Software & Services Group 68
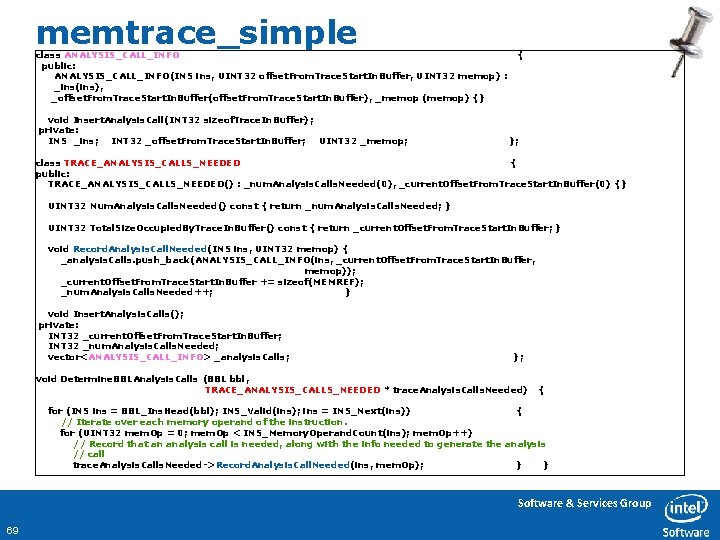
memtrace_simple class ANALYSIS_CALL_INFO public: ANALYSIS_CALL_INFO(INS ins, UINT 32 offset. From. Trace. Start. In. Buffer, UINT 32 memop) : _ins(ins), _offset. From. Trace. Start. In. Buffer(offset. From. Trace. Start. In. Buffer), _memop (memop) {} void Insert. Analysis. Call(INT 32 sizeof. Trace. In. Buffer); private: INS _ins; INT 32 _offset. From. Trace. Start. In. Buffer; UINT 32 _memop; { }; class TRACE_ANALYSIS_CALLS_NEEDED { public: TRACE_ANALYSIS_CALLS_NEEDED() : _num. Analysis. Calls. Needed(0), _current. Offset. From. Trace. Start. In. Buffer(0) {} UINT 32 Num. Analysis. Calls. Needed() const { return _num. Analysis. Calls. Needed; } UINT 32 Total. Size. Occupied. By. Trace. In. Buffer() const { return _current. Offset. From. Trace. Start. In. Buffer; } void Record. Analysis. Call. Needed(INS ins, UINT 32 memop) { _analysis. Calls. push_back(ANALYSIS_CALL_INFO(ins, _current. Offset. From. Trace. Start. In. Buffer, memop)); _current. Offset. From. Trace. Start. In. Buffer += sizeof(MEMREF); _num. Analysis. Calls. Needed++; } void Insert. Analysis. Calls(); private: INT 32 _current. Offset. From. Trace. Start. In. Buffer; INT 32 _num. Analysis. Calls. Needed; vector<ANALYSIS_CALL_INFO> _analysis. Calls; }; void Determine. BBLAnalysis. Calls (BBL bbl, TRACE_ANALYSIS_CALLS_NEEDED * trace. Analysis. Calls. Needed) { for (INS ins = BBL_Ins. Head(bbl); INS_Valid(ins); ins = INS_Next(ins)) { // Iterate over each memory operand of the instruction. for (UINT 32 mem. Op = 0; mem. Op < INS_Memory. Operand. Count(ins); mem. Op++) // Record that an analysis call is needed, along with the info needed to generate the analysis // call trace. Analysis. Calls. Needed-> Record. Analysis. Call. Needed(ins, mem. Op); } } • 69 Software & Services Group
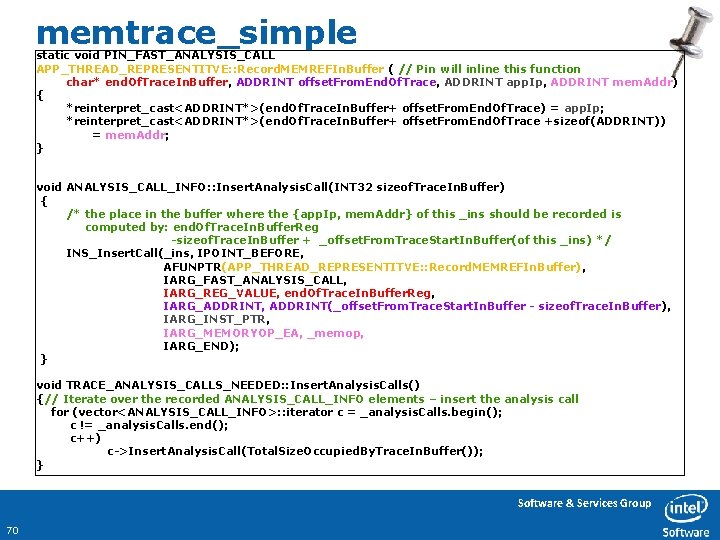
memtrace_simple static void PIN_FAST_ANALYSIS_CALL APP_THREAD_REPRESENTITVE: : Record. MEMREFIn. Buffer ( // Pin will inline this function char* end. Of. Trace. In. Buffer, ADDRINT offset. From. End. Of. Trace, ADDRINT app. Ip, ADDRINT mem. Addr) { *reinterpret_cast<ADDRINT*>(end. Of. Trace. In. Buffer+ offset. From. End. Of. Trace) = app. Ip; *reinterpret_cast<ADDRINT*>(end. Of. Trace. In. Buffer+ offset. From. End. Of. Trace +sizeof(ADDRINT)) = mem. Addr; } void ANALYSIS_CALL_INFO: : Insert. Analysis. Call(INT 32 sizeof. Trace. In. Buffer) { /* the place in the buffer where the {app. Ip, mem. Addr} of this _ins should be recorded is computed by: end. Of. Trace. In. Buffer. Reg -sizeof. Trace. In. Buffer + _offset. From. Trace. Start. In. Buffer(of this _ins) */ INS_Insert. Call(_ins, IPOINT_BEFORE, AFUNPTR(APP_THREAD_REPRESENTITVE: : Record. MEMREFIn. Buffer), IARG_FAST_ANALYSIS_CALL, IARG_REG_VALUE, end. Of. Trace. In. Buffer. Reg, IARG_ADDRINT, ADDRINT(_offset. From. Trace. Start. In. Buffer - sizeof. Trace. In. Buffer), IARG_INST_PTR, IARG_MEMORYOP_EA, _memop, IARG_END); } void TRACE_ANALYSIS_CALLS_NEEDED: : Insert. Analysis. Calls() {// Iterate over the recorded ANALYSIS_CALL_INFO elements – insert the analysis call for (vector<ANALYSIS_CALL_INFO>: : iterator c = _analysis. Calls. begin(); c != _analysis. Calls. end(); c++) c->Insert. Analysis. Call(Total. Size. Occupied. By. Trace. In. Buffer()); } Software & Services Group 70
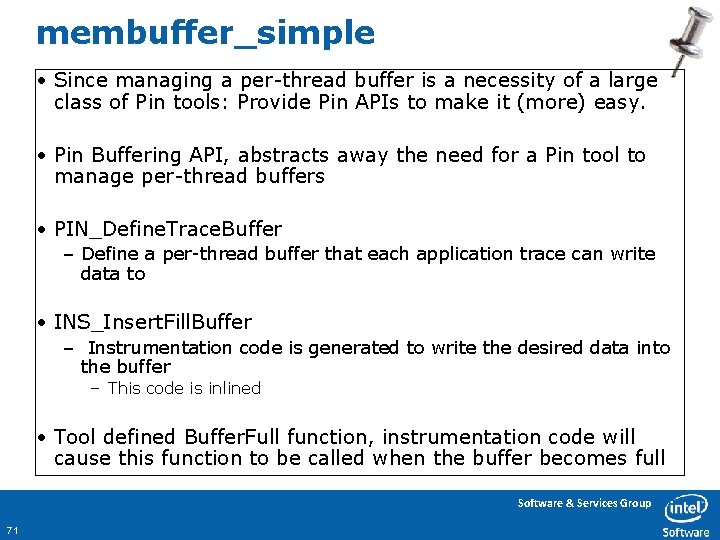
membuffer_simple • Since managing a per-thread buffer is a necessity of a large class of Pin tools: Provide Pin APIs to make it (more) easy. • Pin Buffering API, abstracts away the need for a Pin tool to manage per-thread buffers • PIN_Define. Trace. Buffer – Define a per-thread buffer that each application trace can write data to • INS_Insert. Fill. Buffer – Instrumentation code is generated to write the desired data into the buffer – This code is inlined • Tool defined Buffer. Full function, instrumentation code will cause this function to be called when the buffer becomes full Software & Services Group 71
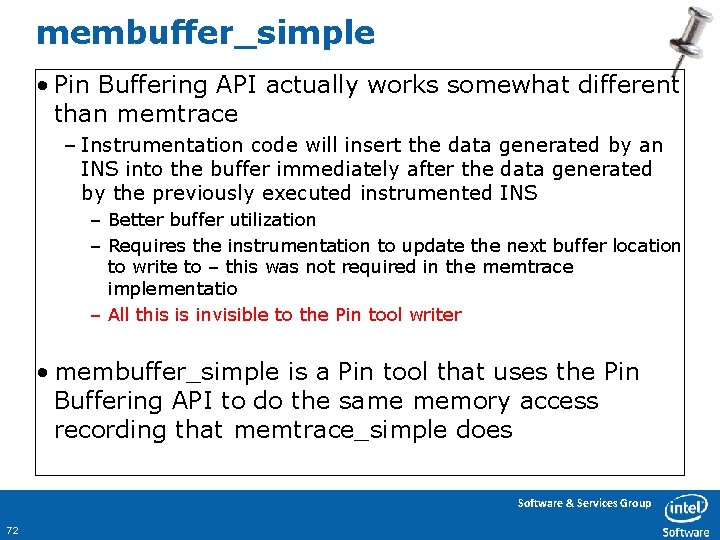
membuffer_simple • Pin Buffering API actually works somewhat different than memtrace – Instrumentation code will insert the data generated by an INS into the buffer immediately after the data generated by the previously executed instrumented INS – Better buffer utilization – Requires the instrumentation to update the next buffer location to write to – this was not required in the memtrace implementatio – All this is invisible to the Pin tool writer • membuffer_simple is a Pin tool that uses the Pin Buffering API to do the same memory access recording that memtrace_simple does Software & Services Group 72
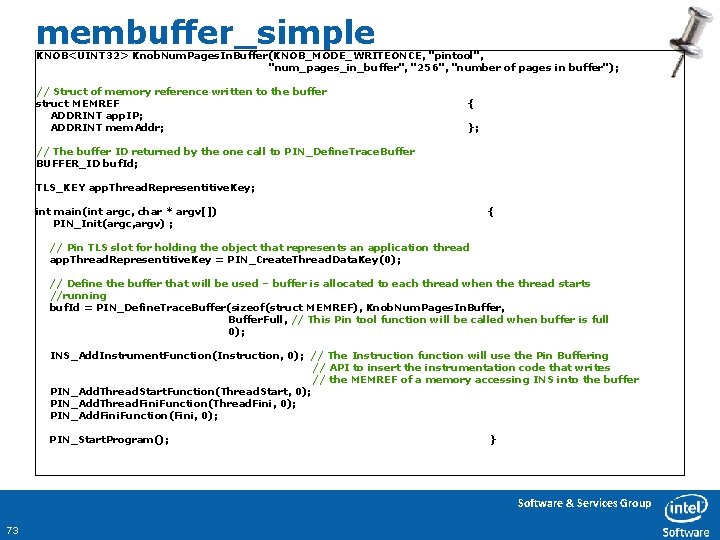
membuffer_simple KNOB<UINT 32> Knob. Num. Pages. In. Buffer(KNOB_MODE_WRITEONCE, "pintool", "num_pages_in_buffer", "256", "number of pages in buffer"); // Struct of memory reference written to the buffer struct MEMREF ADDRINT app. IP; ADDRINT mem. Addr; { }; // The buffer ID returned by the one call to PIN_Define. Trace. Buffer BUFFER_ID buf. Id; TLS_KEY app. Thread. Representitive. Key; int main(int argc, char * argv[]) PIN_Init(argc, argv) ; { // Pin TLS slot for holding the object that represents an application thread app. Thread. Representitive. Key = PIN_Create. Thread. Data. Key(0); // Define the buffer that will be used – buffer is allocated to each thread when the thread starts //running buf. Id = PIN_Define. Trace. Buffer(sizeof(struct MEMREF), Knob. Num. Pages. In. Buffer, Buffer. Full, // This Pin tool function will be called when buffer is full 0); INS_Add. Instrument. Function(Instruction, 0); // The Instruction function will use the Pin Buffering // API to insert the instrumentation code that writes // the MEMREF of a memory accessing INS into the buffer PIN_Add. Thread. Start. Function(Thread. Start, 0); PIN_Add. Thread. Fini. Function(Thread. Fini, 0); PIN_Add. Fini. Function(Fini, 0); PIN_Start. Program(); } Software & Services Group 73
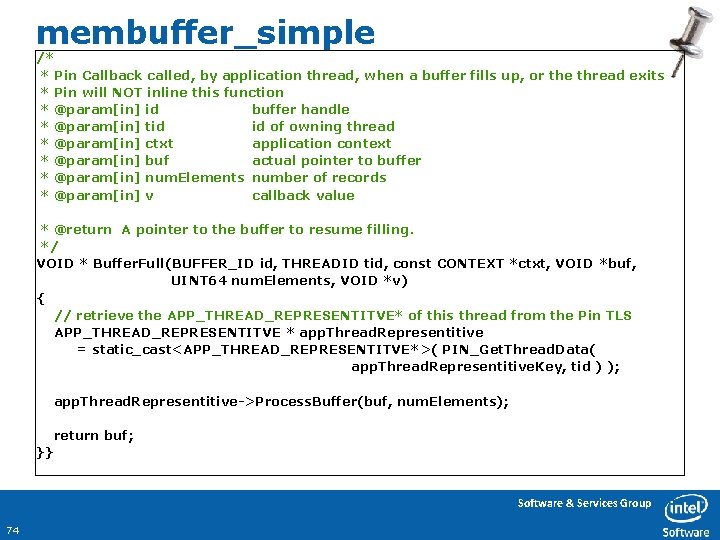
membuffer_simple /* * Pin Callback called, by application thread, when a buffer fills up, or the thread exits * Pin will NOT inline this function * @param[in] id buffer handle * @param[in] tid id of owning thread * @param[in] ctxt application context * @param[in] buf actual pointer to buffer * @param[in] num. Elements number of records * @param[in] v callback value * @return A pointer to the buffer to resume filling. */ VOID * Buffer. Full(BUFFER_ID id, THREADID tid, const CONTEXT *ctxt, VOID *buf, UINT 64 num. Elements, VOID *v) { // retrieve the APP_THREAD_REPRESENTITVE* of this thread from the Pin TLS APP_THREAD_REPRESENTITVE * app. Thread. Representitive = static_cast<APP_THREAD_REPRESENTITVE*>( PIN_Get. Thread. Data( app. Thread. Representitive. Key, tid ) ); app. Thread. Representitive->Process. Buffer(buf, num. Elements); return buf; }} Software & Services Group 74
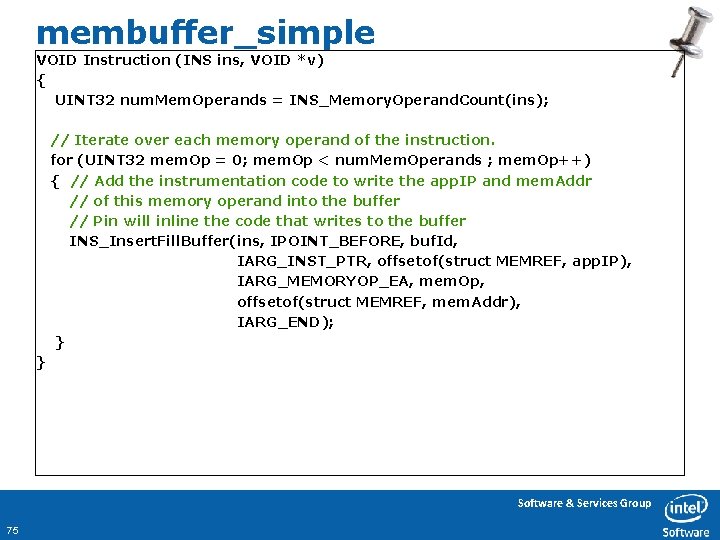
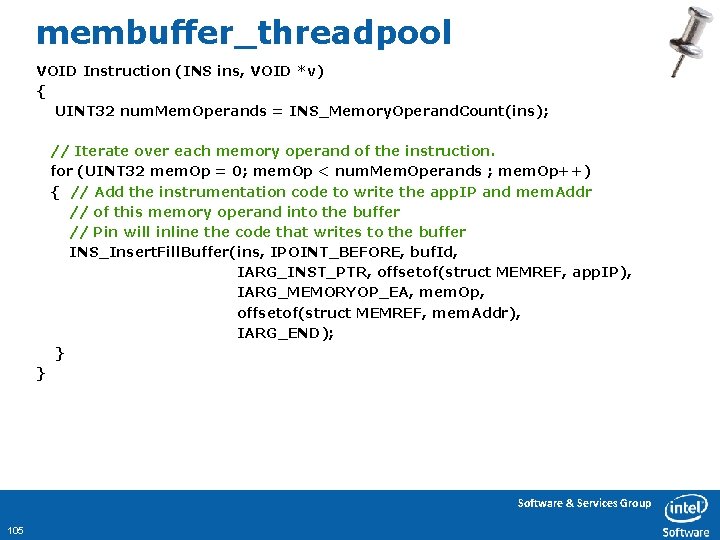
membuffer_simple VOID Instruction (INS ins, VOID *v) { UINT 32 num. Mem. Operands = INS_Memory. Operand. Count(ins); // Iterate over each memory operand of the instruction. for (UINT 32 mem. Op = 0; mem. Op < num. Mem. Operands ; mem. Op++) { // Add the instrumentation code to write the app. IP and mem. Addr // of this memory operand into the buffer // Pin will inline the code that writes to the buffer INS_Insert. Fill. Buffer(ins, IPOINT_BEFORE, buf. Id, IARG_INST_PTR, offsetof(struct MEMREF, app. IP), IARG_MEMORYOP_EA, mem. Op, offsetof(struct MEMREF, mem. Addr), IARG_END); } } Software & Services Group 75
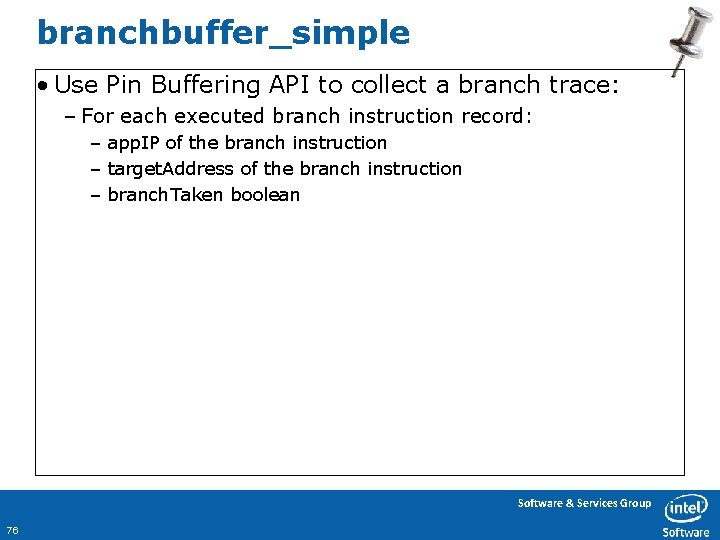
branchbuffer_simple • Use Pin Buffering API to collect a branch trace: – For each executed branch instruction record: – app. IP of the branch instruction – target. Address of the branch instruction – branch. Taken boolean Software & Services Group 76
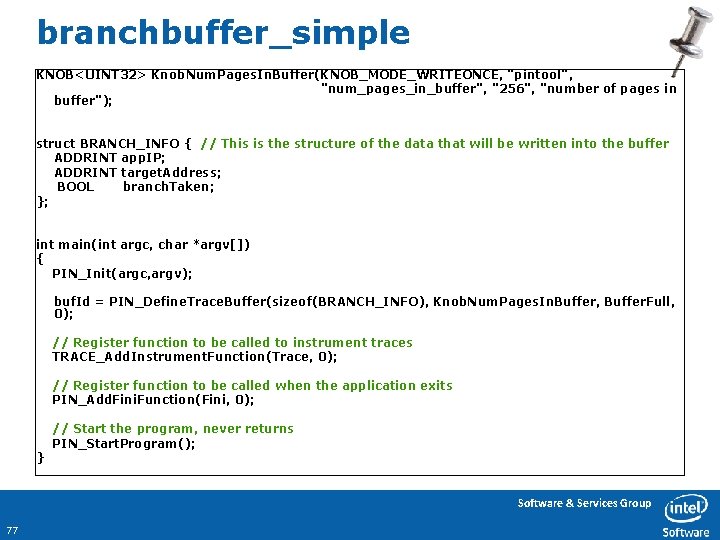
branchbuffer_simple KNOB<UINT 32> Knob. Num. Pages. In. Buffer(KNOB_MODE_WRITEONCE, "pintool", "num_pages_in_buffer", "256", "number of pages in buffer"); struct BRANCH_INFO { // This is the structure of the data that will be written into the buffer ADDRINT app. IP; ADDRINT target. Address; BOOL branch. Taken; }; int main(int argc, char *argv[]) { PIN_Init(argc, argv); buf. Id = PIN_Define. Trace. Buffer(sizeof(BRANCH_INFO), Knob. Num. Pages. In. Buffer, Buffer. Full, 0); // Register function to be called to instrument traces TRACE_Add. Instrument. Function(Trace, 0); // Register function to be called when the application exits PIN_Add. Fini. Function(Fini, 0); } // Start the program, never returns PIN_Start. Program(); Software & Services Group 77
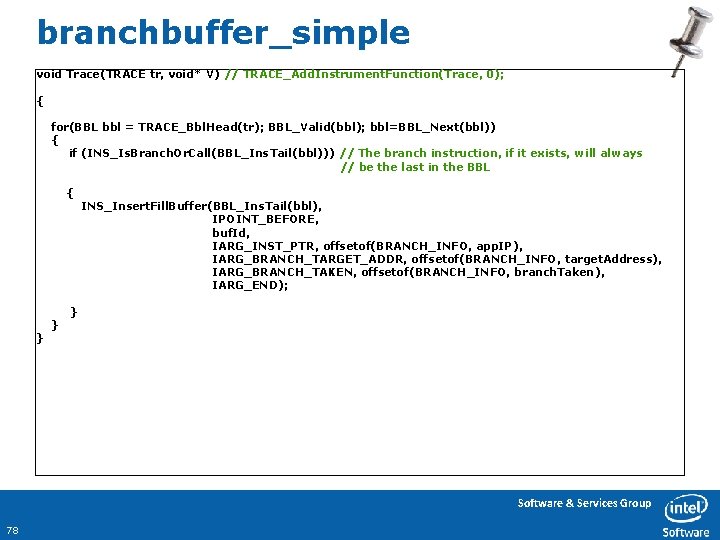
branchbuffer_simple void Trace(TRACE tr, void* V) // TRACE_Add. Instrument. Function(Trace, 0); { for(BBL bbl = TRACE_Bbl. Head(tr); BBL_Valid(bbl); bbl=BBL_Next(bbl)) { if (INS_Is. Branch. Or. Call(BBL_Ins. Tail(bbl))) // The branch instruction, if it exists, will always // be the last in the BBL { } } INS_Insert. Fill. Buffer(BBL_Ins. Tail(bbl), IPOINT_BEFORE, buf. Id, IARG_INST_PTR, offsetof(BRANCH_INFO, app. IP), IARG_BRANCH_TARGET_ADDR, offsetof(BRANCH_INFO, target. Address), IARG_BRANCH_TAKEN, offsetof(BRANCH_INFO, branch. Taken), IARG_END); } Software & Services Group 78
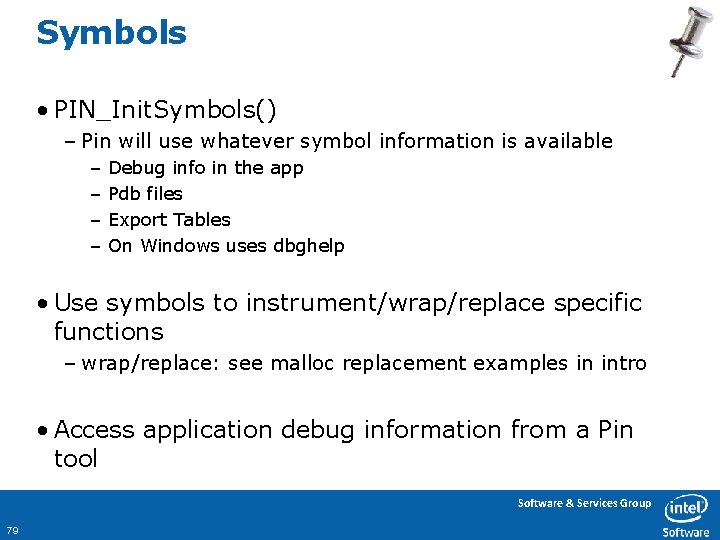
Symbols • PIN_Init. Symbols() – Pin will use whatever symbol information is available – – Debug info in the app Pdb files Export Tables On Windows uses dbghelp • Use symbols to instrument/wrap/replace specific functions – wrap/replace: see malloc replacement examples in intro • Access application debug information from a Pin tool Software & Services Group 79
![Symbols: Instrument malloc and free int main(int argc, char *argv[]) { // Initialize pin Symbols: Instrument malloc and free int main(int argc, char *argv[]) { // Initialize pin](http://slidetodoc.com/presentation_image/769d3d5281931b8e30da2dc1ad2a3503/image-80.jpg)
Symbols: Instrument malloc and free int main(int argc, char *argv[]) { // Initialize pin symbol manager PIN_Init. Symbols(); PIN_Init(argc, argv); // Register the function Image. Load to be called each time an image is loaded in the process // This includes the process itself and all shared libraries it loads (implicitly or explicitly) IMG_Add. Instrument. Function(Image. Load, 0); // Never returns PIN_Start. Program(); } Software & Services Group 80
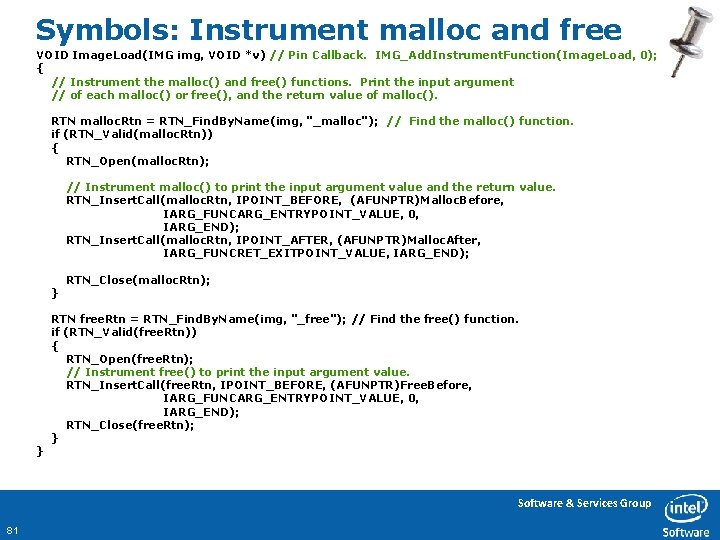
Symbols: Instrument malloc and free VOID Image. Load(IMG img, VOID *v) // Pin Callback. IMG_Add. Instrument. Function(Image. Load, 0); { // Instrument the malloc() and free() functions. Print the input argument // of each malloc() or free(), and the return value of malloc(). RTN malloc. Rtn = RTN_Find. By. Name(img, "_malloc"); // Find the malloc() function. if (RTN_Valid(malloc. Rtn)) { RTN_Open(malloc. Rtn); // Instrument malloc() to print the input argument value and the return value. RTN_Insert. Call(malloc. Rtn, IPOINT_BEFORE, (AFUNPTR)Malloc. Before, IARG_FUNCARG_ENTRYPOINT_VALUE, 0, IARG_END); RTN_Insert. Call(malloc. Rtn, IPOINT_AFTER, (AFUNPTR)Malloc. After, IARG_FUNCRET_EXITPOINT_VALUE, IARG_END); } } RTN_Close(malloc. Rtn); RTN free. Rtn = RTN_Find. By. Name(img, "_free"); // Find the free() function. if (RTN_Valid(free. Rtn)) { RTN_Open(free. Rtn); // Instrument free() to print the input argument value. RTN_Insert. Call(free. Rtn, IPOINT_BEFORE, (AFUNPTR)Free. Before, IARG_FUNCARG_ENTRYPOINT_VALUE, 0, IARG_END); RTN_Close(free. Rtn); } Software & Services Group 81
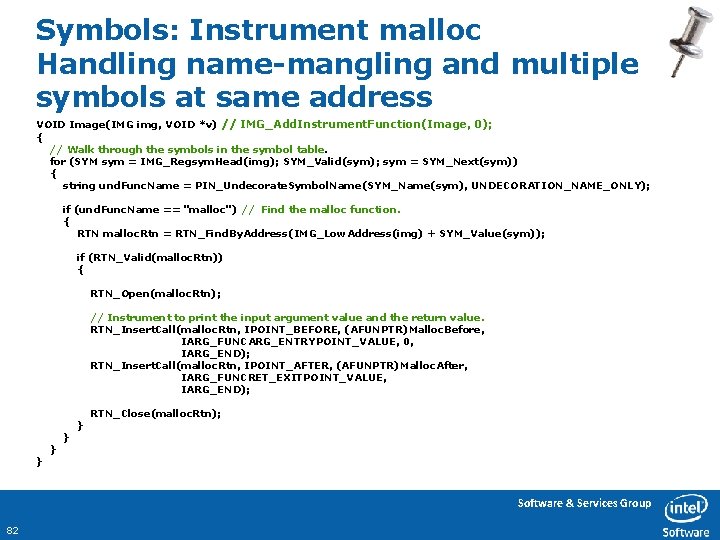
Symbols: Instrument malloc Handling name-mangling and multiple symbols at same address VOID Image(IMG img, VOID *v) // IMG_Add. Instrument. Function(Image, 0); { // Walk through the symbols in the symbol table. for (SYM sym = IMG_Regsym. Head(img); SYM_Valid(sym); sym = SYM_Next(sym)) { string und. Func. Name = PIN_Undecorate. Symbol. Name(SYM_Name(sym), UNDECORATION_NAME_ONLY); if (und. Func. Name == "malloc") // Find the malloc function. { RTN malloc. Rtn = RTN_Find. By. Address(IMG_Low. Address(img) + SYM_Value(sym)); if (RTN_Valid(malloc. Rtn)) { RTN_Open(malloc. Rtn); // Instrument to print the input argument value and the return value. RTN_Insert. Call(malloc. Rtn, IPOINT_BEFORE, (AFUNPTR)Malloc. Before, IARG_FUNCARG_ENTRYPOINT_VALUE, 0, IARG_END); RTN_Insert. Call(malloc. Rtn, IPOINT_AFTER, (AFUNPTR)Malloc. After, IARG_FUNCRET_EXITPOINT_VALUE, IARG_END); } } RTN_Close(malloc. Rtn); Software & Services Group 82
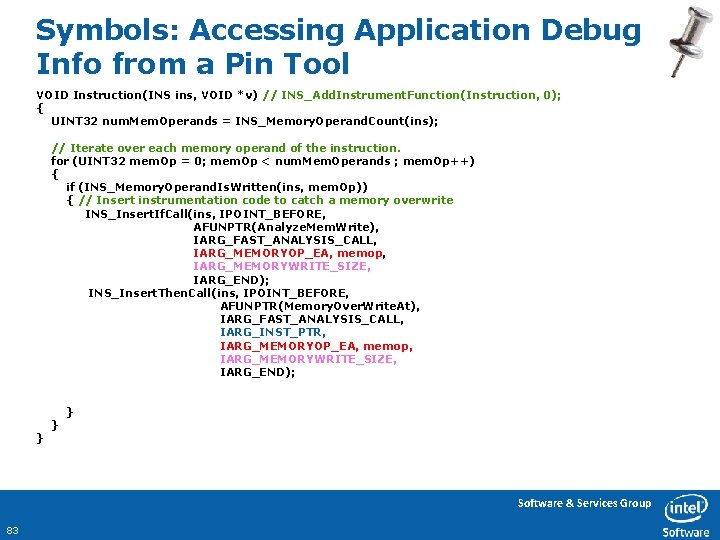
Symbols: Accessing Application Debug Info from a Pin Tool VOID Instruction(INS ins, VOID *v) // INS_Add. Instrument. Function(Instruction, 0); { UINT 32 num. Mem. Operands = INS_Memory. Operand. Count(ins); // Iterate over each memory operand of the instruction. for (UINT 32 mem. Op = 0; mem. Op < num. Mem. Operands ; mem. Op++) { if (INS_Memory. Operand. Is. Written(ins, mem. Op)) { // Insert instrumentation code to catch a memory overwrite INS_Insert. If. Call(ins, IPOINT_BEFORE, AFUNPTR(Analyze. Mem. Write), IARG_FAST_ANALYSIS_CALL, IARG_MEMORYOP_EA, memop, IARG_MEMORYWRITE_SIZE, IARG_END); INS_Insert. Then. Call(ins, IPOINT_BEFORE, AFUNPTR(Memory. Over. Write. At), IARG_FAST_ANALYSIS_CALL, IARG_INST_PTR, IARG_MEMORYOP_EA, memop, IARG_MEMORYWRITE_SIZE, IARG_END); } } } Software & Services Group 83
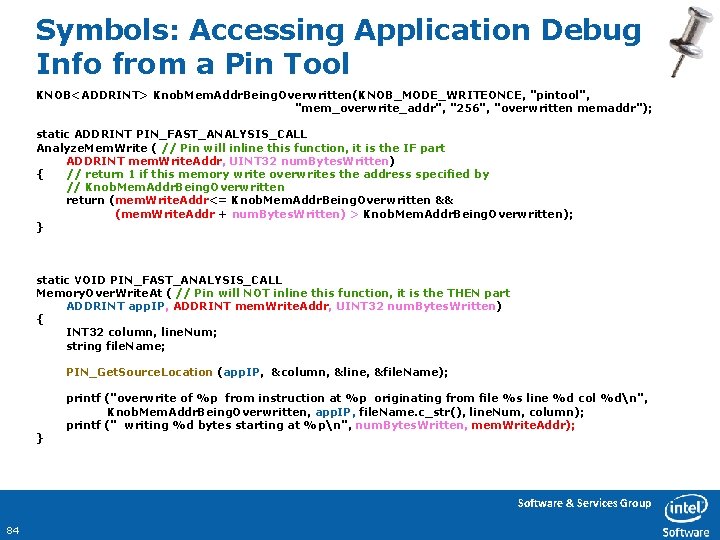
Symbols: Accessing Application Debug Info from a Pin Tool KNOB<ADDRINT> Knob. Mem. Addr. Being. Overwritten(KNOB_MODE_WRITEONCE, "pintool", "mem_overwrite_addr", "256", "overwritten memaddr"); static ADDRINT PIN_FAST_ANALYSIS_CALL Analyze. Mem. Write ( // Pin will inline this function, it is the IF part ADDRINT mem. Write. Addr, UINT 32 num. Bytes. Written) { // return 1 if this memory write overwrites the address specified by // Knob. Mem. Addr. Being. Overwritten return (mem. Write. Addr<= Knob. Mem. Addr. Being. Overwritten && (mem. Write. Addr + num. Bytes. Written) > Knob. Mem. Addr. Being. Overwritten); } static VOID PIN_FAST_ANALYSIS_CALL Memory. Over. Write. At ( // Pin will NOT inline this function, it is the THEN part ADDRINT app. IP, ADDRINT mem. Write. Addr, UINT 32 num. Bytes. Written) { INT 32 column, line. Num; string file. Name; PIN_Get. Source. Location (app. IP, &column, &line, &file. Name); } printf ("overwrite of %p from instruction at %p originating from file %s line %d col %dn", Knob. Mem. Addr. Being. Overwritten, app. IP, file. Name. c_str(), line. Num, column); printf (" writing %d bytes starting at %pn", num. Bytes. Written, mem. Write. Addr); Software & Services Group 84
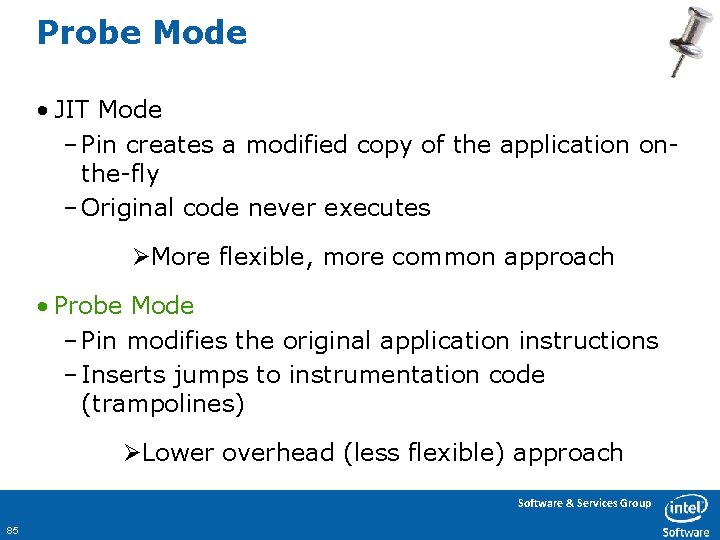
Probe Mode • JIT Mode – Pin creates a modified copy of the application onthe-fly – Original code never executes ØMore flexible, more common approach • Probe Mode – Pin modifies the original application instructions – Inserts jumps to instrumentation code (trampolines) ØLower overhead (less flexible) approach Software & Services Group 85
Pin Probe-Mode • Probe mode is a method of using Pin to wrap or replace application functions with functions in the tool. A jump instruction (probe), which redirects the flow of control to the replacement function is placed at the start of the specified function. • The bytes being overwritten are relocated, so that Pin can provide the replacement function with the address of the first relocated byte. This enables the replacement function to call the replaced (original) function. • In probe mode, the application and the replacement routine are run natively (not Jitted). This improves performance, but puts more responsibility on the tool writer. Probes can only be placed on RTN boundaries, and should inserted within the Image load callback. Pin will automatically remove the probes when an image is unloaded. • Many of the PIN APIs that are available in JIT mode are not available in Probe mode. Software & Services Group 86
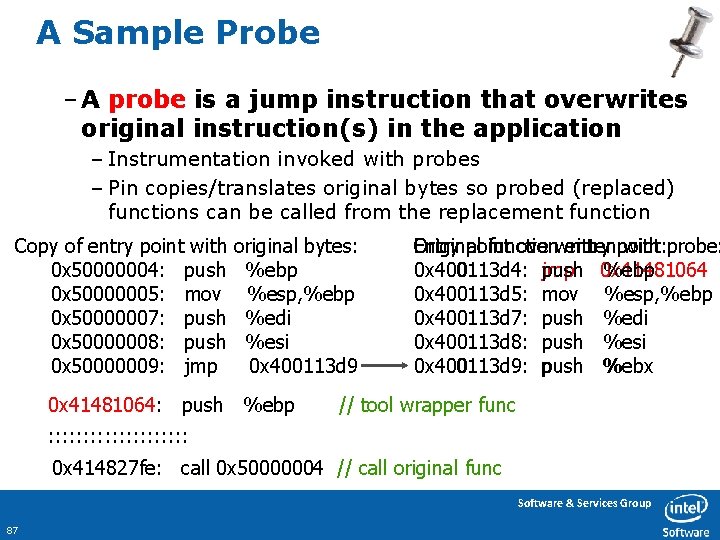
A Sample Probe – A probe is a jump instruction that overwrites original instruction(s) in the application – Instrumentation invoked with probes – Pin copies/translates original bytes so probed (replaced) functions can be called from the replacement function Copy of entry point with 0 x 50000004: push 0 x 50000005: mov 0 x 50000007: push 0 x 50000008: push 0 x 50000009: jmp original bytes: %ebp %esp, %ebp %edi %esi 0 x 400113 d 9 0 x 41481064: push %ebp Original function entry point: Entry point overwritten with probe: %ebp 0 x 400113 d 4: push jmp 0 x 41481064 0 x 400113 d 5: mov %esp, %ebp 0 x 400113 d 7: push %edi 0 x 400113 d 8: push %esi 0 x 400113 d 9: push %ebx // tool wrapper func : : : : : 0 x 414827 fe: call 0 x 50000004 // call original func Software & Services Group 87
Pin. Probes Instrumentation • Advantages: – Low overhead – few percent – Less intrusive – execute original code – Leverages Pin: – API – Instrumentation engine • Disadvantages: – More tool writer responsibility – Routine-level granularity (RTN) Software & Services Group 88
Using Probes to Replace/Wrap a Function • RTN_Replace. Signature. Probed() redirects all calls to application routine rtn to the specified replacement. Function – Can add IARG_* types to be passed to the replacement routine, including pointer to original function and IARG_CONTEXT. – Replacement function call original function. • To use: – Must use PIN_Start. Program. Probed() – Application prototype is required Software & Services Group 89
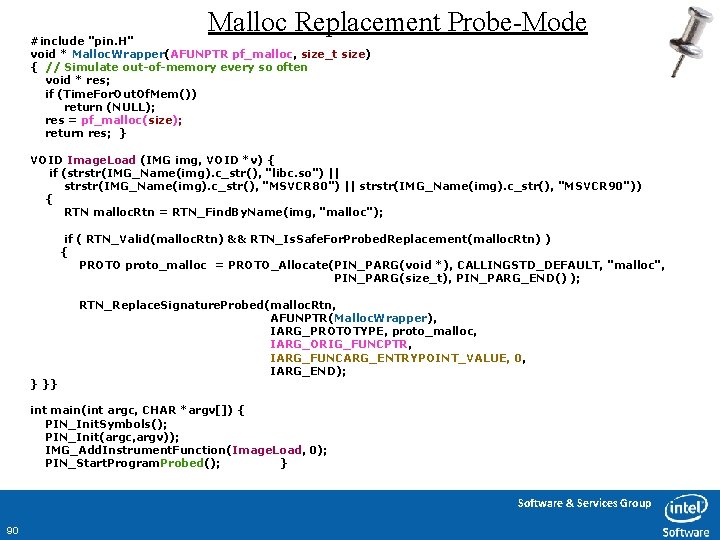
Malloc Replacement Probe-Mode #include "pin. H" void * Malloc. Wrapper(AFUNPTR pf_malloc, size_t size) { // Simulate out-of-memory every so often void * res; if (Time. For. Out. Of. Mem()) return (NULL); res = pf_malloc(size); return res; } VOID Image. Load (IMG img, VOID *v) { if (strstr(IMG_Name(img). c_str(), "libc. so") || strstr(IMG_Name(img). c_str(), "MSVCR 80") || strstr(IMG_Name(img). c_str(), "MSVCR 90")) { RTN malloc. Rtn = RTN_Find. By. Name(img, "malloc"); if ( RTN_Valid(malloc. Rtn) && RTN_Is. Safe. For. Probed. Replacement(malloc. Rtn) ) { PROTO proto_malloc = PROTO_Allocate(PIN_PARG(void *), CALLINGSTD_DEFAULT, "malloc", PIN_PARG(size_t), PIN_PARG_END() ); } }} RTN_Replace. Signature. Probed(malloc. Rtn, AFUNPTR(Malloc. Wrapper), IARG_PROTOTYPE, proto_malloc, IARG_ORIG_FUNCPTR, IARG_FUNCARG_ENTRYPOINT_VALUE, 0, IARG_END); int main(int argc, CHAR *argv[]) { PIN_Init. Symbols(); PIN_Init(argc, argv)); IMG_Add. Instrument. Function(Image. Load, 0); PIN_Start. Program. Probed(); } Software & Services Group 90
Using Probes to Call Analysis Functions • RTN_Insert. Call. Probed() invokes the analysis routine before or after the specified rtn – Use IPOINT_BEFORE or IPOINT_AFTER – Pin may NOT be able to find all AFTER points on the function when it is running in Probe-Mode – PIN IARG_TYPEs are used for arguments • To use: – Must use PIN_Start. Program. Probed() – Application prototype is required Software & Services Group 91
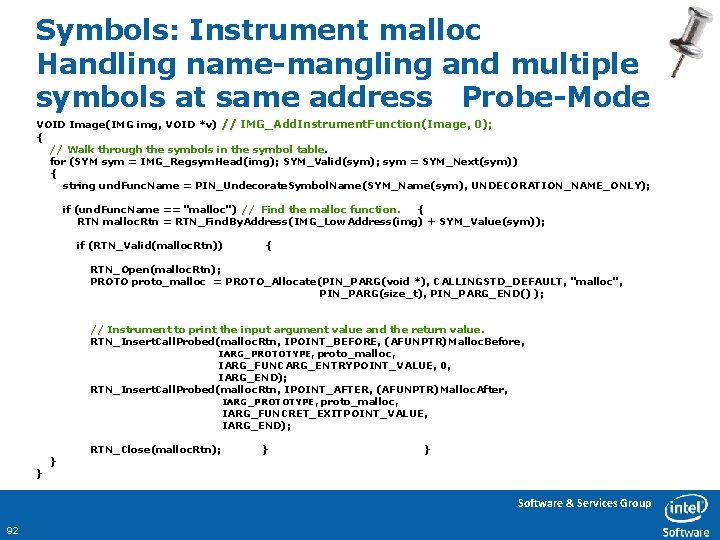
Symbols: Instrument malloc Handling name-mangling and multiple symbols at same address Probe-Mode VOID Image(IMG img, VOID *v) // IMG_Add. Instrument. Function(Image, 0); { // Walk through the symbols in the symbol table. for (SYM sym = IMG_Regsym. Head(img); SYM_Valid(sym); sym = SYM_Next(sym)) { string und. Func. Name = PIN_Undecorate. Symbol. Name(SYM_Name(sym), UNDECORATION_NAME_ONLY); if (und. Func. Name == "malloc") // Find the malloc function. { RTN malloc. Rtn = RTN_Find. By. Address(IMG_Low. Address(img) + SYM_Value(sym)); if (RTN_Valid(malloc. Rtn)) { RTN_Open(malloc. Rtn); PROTO proto_malloc = PROTO_Allocate(PIN_PARG(void *), CALLINGSTD_DEFAULT, "malloc", PIN_PARG(size_t), PIN_PARG_END() ); // Instrument to print the input argument value and the return value. RTN_Insert. Call. Probed(malloc. Rtn, IPOINT_BEFORE, (AFUNPTR)Malloc. Before, IARG_PROTOTYPE, proto_malloc, IARG_FUNCARG_ENTRYPOINT_VALUE, 0, IARG_END); RTN_Insert. Call. Probed(malloc. Rtn, IPOINT_AFTER, (AFUNPTR)Malloc. After, IARG_PROTOTYPE, proto_malloc, IARG_FUNCRET_EXITPOINT_VALUE, IARG_END); } } RTN_Close(malloc. Rtn); } } Software & Services Group 92
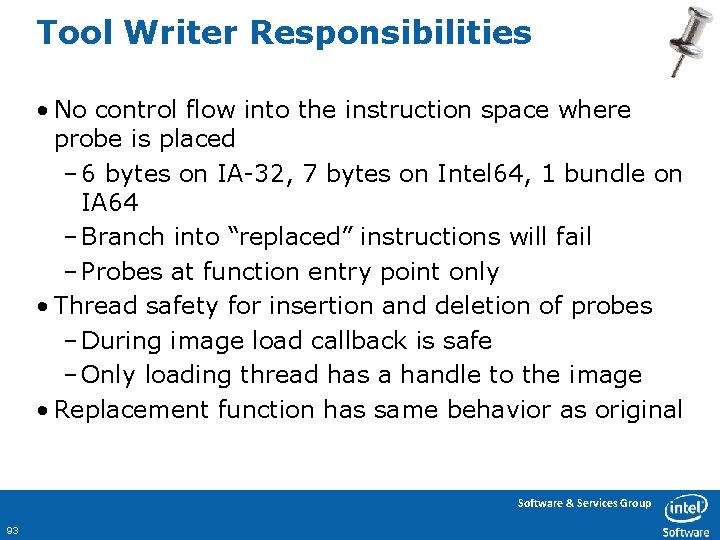
Tool Writer Responsibilities • No control flow into the instruction space where probe is placed – 6 bytes on IA-32, 7 bytes on Intel 64, 1 bundle on IA 64 – Branch into “replaced” instructions will fail – Probes at function entry point only • Thread safety for insertion and deletion of probes – During image load callback is safe – Only loading thread has a handle to the image • Replacement function has same behavior as original Software & Services Group 93
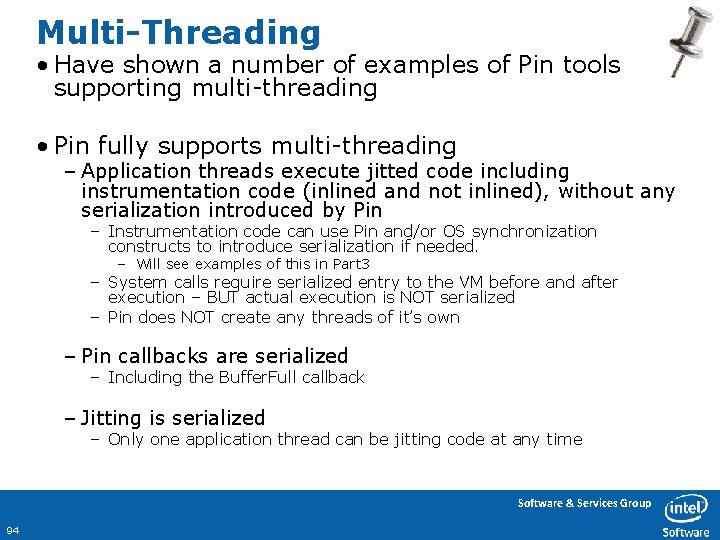
Multi-Threading • Have shown a number of examples of Pin tools supporting multi-threading • Pin fully supports multi-threading – Application threads execute jitted code including instrumentation code (inlined and not inlined), without any serialization introduced by Pin – Instrumentation code can use Pin and/or OS synchronization constructs to introduce serialization if needed. – Will see examples of this in Part 3 – System calls require serialized entry to the VM before and after execution – BUT actual execution is NOT serialized – Pin does NOT create any threads of it’s own – Pin callbacks are serialized – Including the Buffer. Full callback – Jitting is serialized – Only one application thread can be jitting code at any time Software & Services Group 94
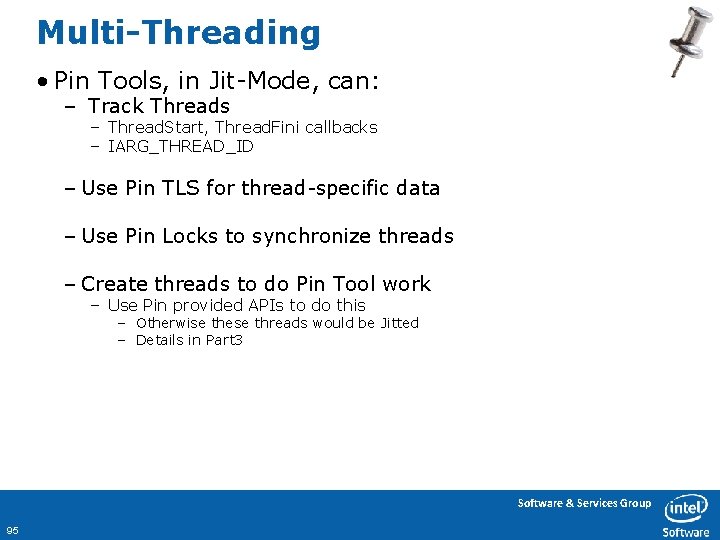
Multi-Threading • Pin Tools, in Jit-Mode, can: – Track Threads – Thread. Start, Thread. Fini callbacks – IARG_THREAD_ID – Use Pin TLS for thread-specific data – Use Pin Locks to synchronize threads – Create threads to do Pin Tool work – Use Pin provided APIs to do this – Otherwise these threads would be Jitted – Details in Part 3 Software & Services Group 95
Part 3 Summary • Saw Examples of – Allocating Pin Registers for Pin Tool Use – Pin IF-THEN instrumentation – Changing register values in instrumentation code – Changing register values in CONTEXT – Knobs – Pin TLS – Pin Buffering API – Using Symbol and Debug Info – Probe-Mode – Multi-Threading support Software & Services Group 96
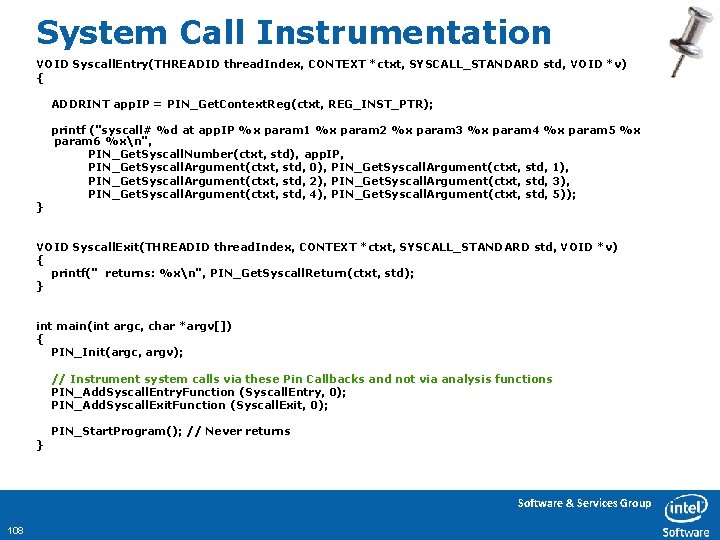
Part 4: Advanced Pin API “To boldly go where no Pin. Head has gone before…” • Agenda – membuffer_threadpool tool – Using multiple buffers in the Pin Buffering API – Using Pin Tool Threads – Using Pin and OS locks to synchronize threads – System call instrumentation – Instrumenting a process tree – CONTEXT* and IARG_CONTEXT – Managing Exceptions and Signals – Accessing Decode API – Pin Code-Cache API – Transparent debugging, and extending the debugger Software & Services Group 97
membuffer_threadpool • Recall membuffer_simple: – Uses Pin Buffering API – One buffer for each thread – Inlined call to INS_Insert. Fill. Buffer writes instrumentation data into the buffer – Application threads execute jitted application and instrumentation code – When buffer becomes full the Pin Tool defined Buffer. Full callback is called (by the application thread) – Process the data in the buffer – After the buffer is processed it is set to be re-filled from the top – Application thread continues executing jitted application and instrumentation code – All Pin callbacks are serialized – Only one buffer is being processed at any time Software & Services Group 98
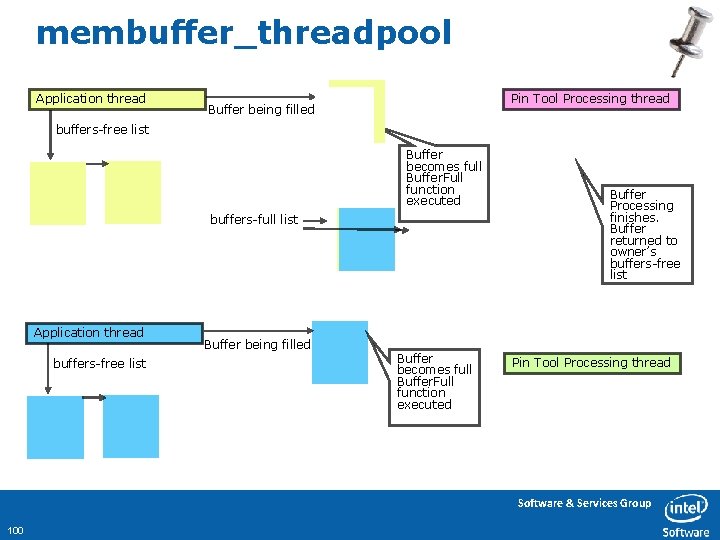
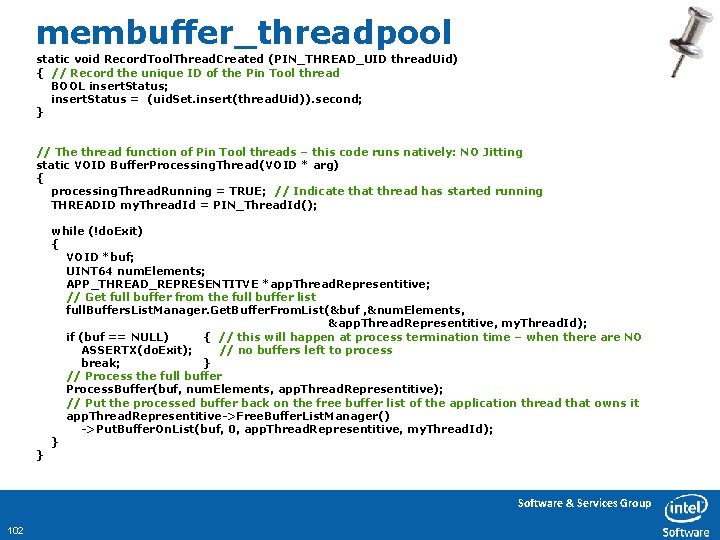
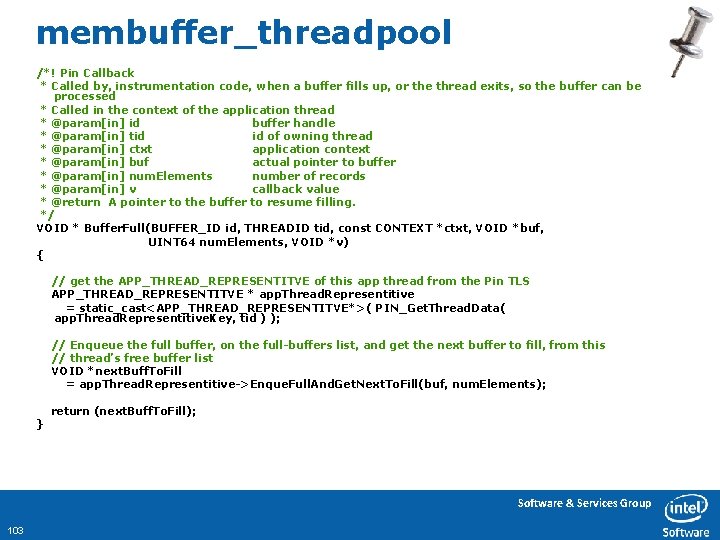
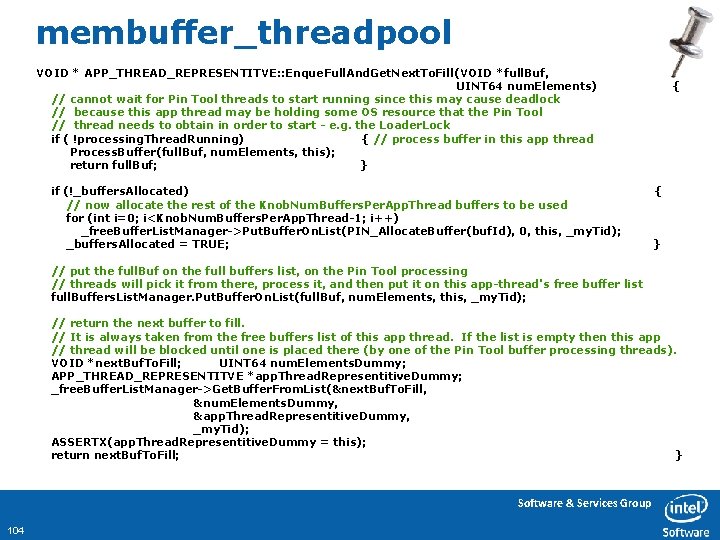
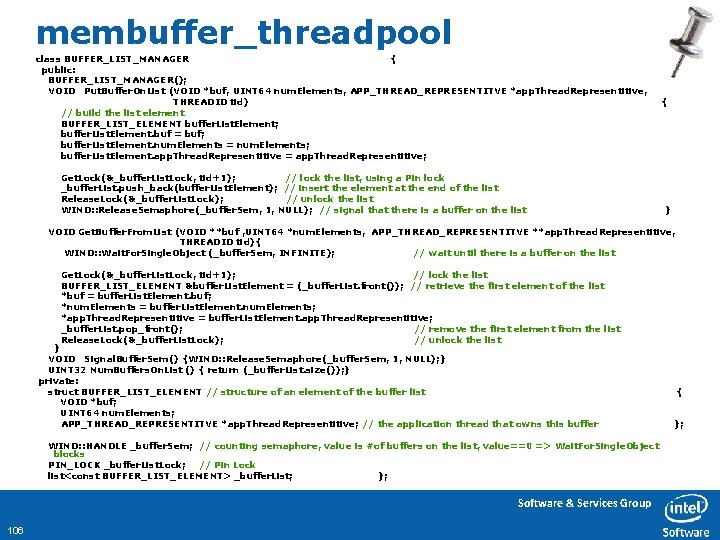
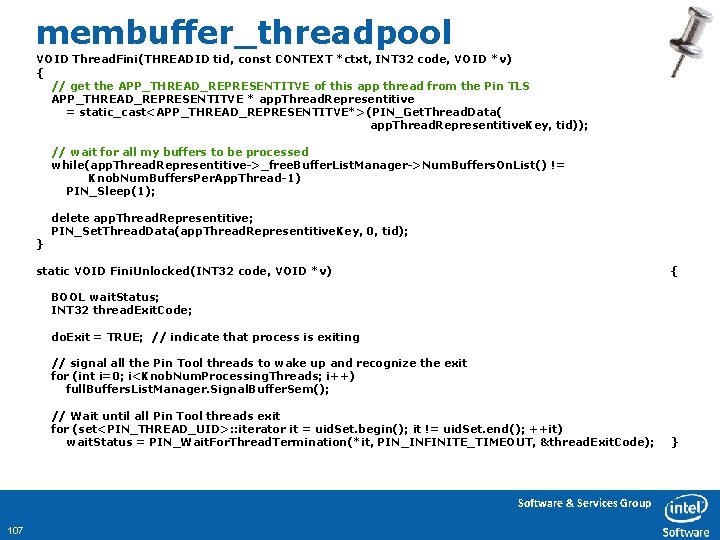
membuffer_threadpool • Improvement: Process buffers that become full asynchronously, allows application code to continue executing while buffers are being processed. – Pin Buffering API supports multiple buffers per-thread – Each application thread will allocate a number of buffers. – The buffers allocated by the thread can only be used by the allocating thread so: – Each application thread will have a buffers-free list, holding all buffers that are not currently full or being filled. – Pin supports creating Pin Tool threads, these are NOT jitted and can be used to do Pin Tool work asynchronously. – A number of these threads will be created, their job is: – – Process buffers that become full. These will be located on a global full-buffers list. After processing, return them to the buffers-free list of the application thread that filled them – Application threads execute jitted application code and instrumentation code – the instrumentation code writes data into the buffers and when it detects that the buffer is full calls the Buffer. Full callback. – The Buffer. Full callback function will NOT process the buffer – Remember it is executed by an application thread – It places the buffer on the global full-buffers list – It retrieves a free buffer from this application thread’s free buffer list and returns it as the next buffer to fill. Software & Services Group 99
membuffer_threadpool Application thread Pin Tool Processing thread Buffer being filled buffers-free list Buffer becomes full Buffer. Full function executed buffers-full list Application thread buffers-free list Buffer being filled Buffer becomes full Buffer. Full function executed Buffer Processing finishes. Buffer returned to owner’s buffers-free list Pin Tool Processing thread Software & Services Group 100
![membuffer_threadpool int main(int argc, char *argv[]) PIN_Init(argc, argv); { // Pin TLS slot for membuffer_threadpool int main(int argc, char *argv[]) PIN_Init(argc, argv); { // Pin TLS slot for](http://slidetodoc.com/presentation_image/769d3d5281931b8e30da2dc1ad2a3503/image-101.jpg)
membuffer_threadpool int main(int argc, char *argv[]) PIN_Init(argc, argv); { // Pin TLS slot for holding the object that represents an application thread app. Thread. Representitive. Key = PIN_Create. Thread. Data. Key(0); // Define the buffer that will be used – buf. Id = PIN_Define. Trace. Buffer(sizeof(struct MEMREF), Knob. Num. Pages. In. Buffer, Buffer. Full, // This Pin tool function will be called when buffer is full 0); TRACE_Add. Instrument. Function(Trace, 0); // add an instrumentation callback function // add callbacks PIN_Add. Thread. Start. Function(Thread. Start, 0); PIN_Add. Thread. Fini. Function(Thread. Fini, 0); PIN_Add. Fini. Function(Fini, 0); PIN_Add. Fini. Unlocked. Function(Fini. Unlocked, 0); // Used for Pin Tool thread termination /* It is safe to create internal threads in the tool's main procedure and spawn new * internal threads from existing ones. All other places, like Pin callbacks and * analysis routines in application threads, are not safe for creating internal threads. */ // NOTE: These threads are NOT jitted, Need to discuss when the threads actually start running for (int i=0; i<Knob. Num. Processing. Threads; i++) { THREADID thread. Id; PIN_THREAD_UID thread. Uid; thread. Id = PIN_Spawn. Internal. Thread (Buffer. Processing. Thread, NULL, 0, &thread. Uid); Record. Tool. Thread. Created(thread. Uid); /* Used for Pin Tool thread termination */ } PIN_Start. Program(); /* Start the program, never returns */ } Software & Services Group 101
membuffer_threadpool static void Record. Tool. Thread. Created (PIN_THREAD_UID thread. Uid) { // Record the unique ID of the Pin Tool thread BOOL insert. Status; insert. Status = (uid. Set. insert(thread. Uid)). second; } // The thread function of Pin Tool threads – this code runs natively: NO Jitting static VOID Buffer. Processing. Thread(VOID * arg) { processing. Thread. Running = TRUE; // Indicate that thread has started running THREADID my. Thread. Id = PIN_Thread. Id(); } while (!do. Exit) { VOID *buf; UINT 64 num. Elements; APP_THREAD_REPRESENTITVE *app. Thread. Representitive; // Get full buffer from the full buffer list full. Buffers. List. Manager. Get. Buffer. From. List(&buf , &num. Elements, &app. Thread. Representitive, my. Thread. Id); if (buf == NULL) { // this will happen at process termination time – when there are NO ASSERTX(do. Exit); // no buffers left to process break; } // Process the full buffer Process. Buffer(buf, num. Elements, app. Thread. Representitive); // Put the processed buffer back on the free buffer list of the application thread that owns it app. Thread. Representitive->Free. Buffer. List. Manager() ->Put. Buffer. On. List(buf, 0, app. Thread. Representitive, my. Thread. Id); } Software & Services Group 102
membuffer_threadpool /*! Pin Callback * Called by, instrumentation code, when a buffer fills up, or the thread exits, so the buffer can be processed * Called in the context of the application thread * @param[in] id buffer handle * @param[in] tid id of owning thread * @param[in] ctxt application context * @param[in] buf actual pointer to buffer * @param[in] num. Elements number of records * @param[in] v callback value * @return A pointer to the buffer to resume filling. */ VOID * Buffer. Full(BUFFER_ID id, THREADID tid, const CONTEXT *ctxt, VOID *buf, UINT 64 num. Elements, VOID *v) { // get the APP_THREAD_REPRESENTITVE of this app thread from the Pin TLS APP_THREAD_REPRESENTITVE * app. Thread. Representitive = static_cast<APP_THREAD_REPRESENTITVE*>( PIN_Get. Thread. Data( app. Thread. Representitive. Key, tid ) ); // Enqueue the full buffer, on the full-buffers list, and get the next buffer to fill, from this // thread’s free buffer list VOID *next. Buff. To. Fill = app. Thread. Representitive->Enque. Full. And. Get. Next. To. Fill(buf, num. Elements); } return (next. Buff. To. Fill); Software & Services Group 103
membuffer_threadpool VOID * APP_THREAD_REPRESENTITVE: : Enque. Full. And. Get. Next. To. Fill(VOID *full. Buf, UINT 64 num. Elements) // cannot wait for Pin Tool threads to start running since this may cause deadlock // because this app thread may be holding some OS resource that the Pin Tool // thread needs to obtain in order to start - e. g. the Loader. Lock if ( !processing. Thread. Running) { // process buffer in this app thread Process. Buffer(full. Buf, num. Elements, this); return full. Buf; } if (!_buffers. Allocated) // now allocate the rest of the Knob. Num. Buffers. Per. App. Thread buffers to be used for (int i=0; i<Knob. Num. Buffers. Per. App. Thread-1; i++) _free. Buffer. List. Manager->Put. Buffer. On. List(PIN_Allocate. Buffer(buf. Id), 0, this, _my. Tid); _buffers. Allocated = TRUE; { { } // put the full. Buf on the full buffers list, on the Pin Tool processing // threads will pick it from there, process it, and then put it on this app-thread's free buffer list full. Buffers. List. Manager. Put. Buffer. On. List(full. Buf, num. Elements, this, _my. Tid); // return the next buffer to fill. // It is always taken from the free buffers list of this app thread. If the list is empty then this app // thread will be blocked until one is placed there (by one of the Pin Tool buffer processing threads). VOID *next. Buf. To. Fill; UINT 64 num. Elements. Dummy; APP_THREAD_REPRESENTITVE *app. Thread. Representitive. Dummy; _free. Buffer. List. Manager->Get. Buffer. From. List(&next. Buf. To. Fill, &num. Elements. Dummy, &app. Thread. Representitive. Dummy, _my. Tid); ASSERTX(app. Thread. Representitive. Dummy = this); return next. Buf. To. Fill; } Software & Services Group 104
membuffer_threadpool VOID Instruction (INS ins, VOID *v) { UINT 32 num. Mem. Operands = INS_Memory. Operand. Count(ins); // Iterate over each memory operand of the instruction. for (UINT 32 mem. Op = 0; mem. Op < num. Mem. Operands ; mem. Op++) { // Add the instrumentation code to write the app. IP and mem. Addr // of this memory operand into the buffer // Pin will inline the code that writes to the buffer INS_Insert. Fill. Buffer(ins, IPOINT_BEFORE, buf. Id, IARG_INST_PTR, offsetof(struct MEMREF, app. IP), IARG_MEMORYOP_EA, mem. Op, offsetof(struct MEMREF, mem. Addr), IARG_END); } } Software & Services Group 105
membuffer_threadpool class BUFFER_LIST_MANAGER { public: BUFFER_LIST_MANAGER(); VOID Put. Buffer. On. List (VOID *buf, UINT 64 num. Elements, APP_THREAD_REPRESENTITVE *app. Thread. Representitive, THREADID tid) // build the list element BUFFER_LIST_ELEMENT buffer. List. Element; buffer. List. Element. buf = buf; buffer. List. Element. num. Elements = num. Elements; buffer. List. Element. app. Thread. Representitive = app. Thread. Representitive; Get. Lock(&_buffer. List. Lock, tid+1); // lock the list, using a Pin lock _buffer. List. push_back(buffer. List. Element); // insert the element at the end of the list Release. Lock(&_buffer. List. Lock); // unlock the list WIND: : Release. Semaphore(_buffer. Sem, 1, NULL); // signal that there is a buffer on the list { } VOID Get. Buffer. From. List (VOID **buf , UINT 64 *num. Elements, APP_THREAD_REPRESENTITVE **app. Thread. Representitive, THREADID tid){ WIND: : Wait. For. Single. Object (_buffer. Sem, INFINITE); // wait until there is a buffer on the list Get. Lock(&_buffer. List. Lock, tid+1); // lock the list BUFFER_LIST_ELEMENT &buffer. List. Element = (_buffer. List. front()); // retrieve the first element of the list *buf = buffer. List. Element. buf; *num. Elements = buffer. List. Element. num. Elements; *app. Thread. Representitive = buffer. List. Element. app. Thread. Representitive; _buffer. List. pop_front(); // remove the first element from the list Release. Lock(&_buffer. List. Lock); // unlock the list } VOID Signal. Buffer. Sem() {WIND: : Release. Semaphore(_buffer. Sem, 1, NULL); } UINT 32 Num. Buffers. On. List () { return (_buffer. List. size()); } private: struct BUFFER_LIST_ELEMENT // structure of an element of the buffer list VOID *buf; UINT 64 num. Elements; APP_THREAD_REPRESENTITVE *app. Thread. Representitive; // the application thread that owns this buffer WIND: : HANDLE _buffer. Sem; // counting semaphore, value is #of buffers on the list, value==0 => Wait. For. Single. Object blocks PIN_LOCK _buffer. List. Lock; // Pin Lock list<const BUFFER_LIST_ELEMENT> _buffer. List; }; Software & Services Group 106 { };
membuffer_threadpool VOID Thread. Fini(THREADID tid, const CONTEXT *ctxt, INT 32 code, VOID *v) { // get the APP_THREAD_REPRESENTITVE of this app thread from the Pin TLS APP_THREAD_REPRESENTITVE * app. Thread. Representitive = static_cast<APP_THREAD_REPRESENTITVE*>(PIN_Get. Thread. Data( app. Thread. Representitive. Key, tid)); // wait for all my buffers to be processed while(app. Thread. Representitive->_free. Buffer. List. Manager->Num. Buffers. On. List() != Knob. Num. Buffers. Per. App. Thread-1) PIN_Sleep(1); } delete app. Thread. Representitive; PIN_Set. Thread. Data(app. Thread. Representitive. Key, 0, tid); static VOID Fini. Unlocked(INT 32 code, VOID *v) { BOOL wait. Status; INT 32 thread. Exit. Code; do. Exit = TRUE; // indicate that process is exiting // signal all the Pin Tool threads to wake up and recognize the exit for (int i=0; i<Knob. Num. Processing. Threads; i++) full. Buffers. List. Manager. Signal. Buffer. Sem(); // Wait until all Pin Tool threads exit for (set<PIN_THREAD_UID>: : iterator it = uid. Set. begin(); it != uid. Set. end(); ++it) wait. Status = PIN_Wait. For. Thread. Termination(*it, PIN_INFINITE_TIMEOUT, &thread. Exit. Code); Software & Services Group 107 }
System Call Instrumentation VOID Syscall. Entry(THREADID thread. Index, CONTEXT *ctxt, SYSCALL_STANDARD std, VOID *v) { ADDRINT app. IP = PIN_Get. Context. Reg(ctxt, REG_INST_PTR); } printf ("syscall# %d at app. IP %x param 1 %x param 2 %x param 3 %x param 4 %x param 5 %x param 6 %xn", PIN_Get. Syscall. Number(ctxt, std), app. IP, PIN_Get. Syscall. Argument(ctxt, std, 0), PIN_Get. Syscall. Argument(ctxt, std, 1), PIN_Get. Syscall. Argument(ctxt, std, 2), PIN_Get. Syscall. Argument(ctxt, std, 3), PIN_Get. Syscall. Argument(ctxt, std, 4), PIN_Get. Syscall. Argument(ctxt, std, 5)); VOID Syscall. Exit(THREADID thread. Index, CONTEXT *ctxt, SYSCALL_STANDARD std, VOID *v) { printf(" returns: %xn", PIN_Get. Syscall. Return(ctxt, std); } int main(int argc, char *argv[]) { PIN_Init(argc, argv); // Instrument system calls via these Pin Callbacks and not via analysis functions PIN_Add. Syscall. Entry. Function (Syscall. Entry, 0); PIN_Add. Syscall. Exit. Function (Syscall. Exit, 0); } PIN_Start. Program(); // Never returns Software & Services Group 108
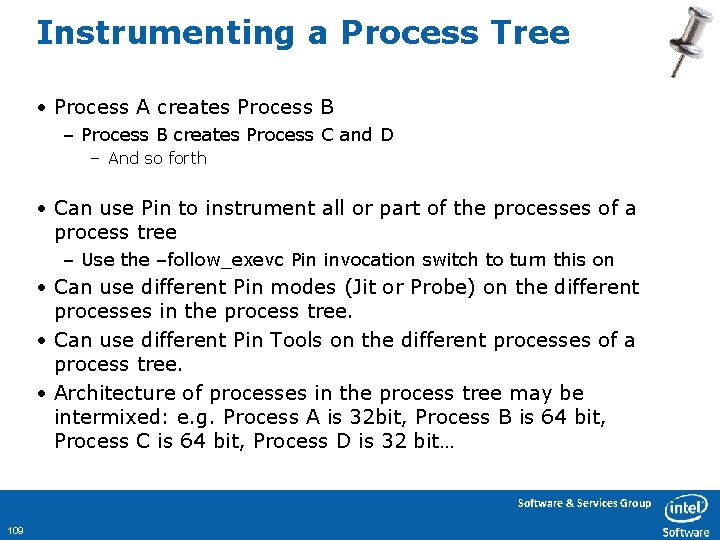
Instrumenting a Process Tree • Process A creates Process B – Process B creates Process C and D – And so forth • Can use Pin to instrument all or part of the processes of a process tree – Use the –follow_exevc Pin invocation switch to turn this on • Can use different Pin modes (Jit or Probe) on the different processes in the process tree. • Can use different Pin Tools on the different processes of a process tree. • Architecture of processes in the process tree may be intermixed: e. g. Process A is 32 bit, Process B is 64 bit, Process C is 64 bit, Process D is 32 bit… Software & Services Group 109
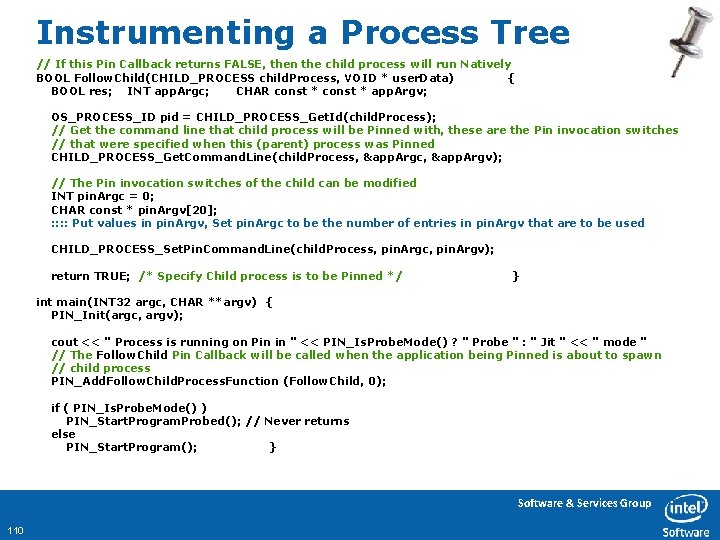
Instrumenting a Process Tree // If this Pin Callback returns FALSE, then the child process will run Natively BOOL Follow. Child(CHILD_PROCESS child. Process, VOID * user. Data) { BOOL res; INT app. Argc; CHAR const * app. Argv; OS_PROCESS_ID pid = CHILD_PROCESS_Get. Id(child. Process); // Get the command line that child process will be Pinned with, these are the Pin invocation switches // that were specified when this (parent) process was Pinned CHILD_PROCESS_Get. Command. Line(child. Process, &app. Argc, &app. Argv); // The Pin invocation switches of the child can be modified INT pin. Argc = 0; CHAR const * pin. Argv[20]; : : Put values in pin. Argv, Set pin. Argc to be the number of entries in pin. Argv that are to be used CHILD_PROCESS_Set. Pin. Command. Line(child. Process, pin. Argc, pin. Argv); return TRUE; /* Specify Child process is to be Pinned */ } int main(INT 32 argc, CHAR **argv) { PIN_Init(argc, argv); cout << " Process is running on Pin in " << PIN_Is. Probe. Mode() ? " Probe " : " Jit " << " mode " // The Follow. Child Pin Callback will be called when the application being Pinned is about to spawn // child process PIN_Add. Follow. Child. Process. Function (Follow. Child, 0); if ( PIN_Is. Probe. Mode() ) PIN_Start. Program. Probed(); // Never returns else PIN_Start. Program(); } Software & Services Group 110
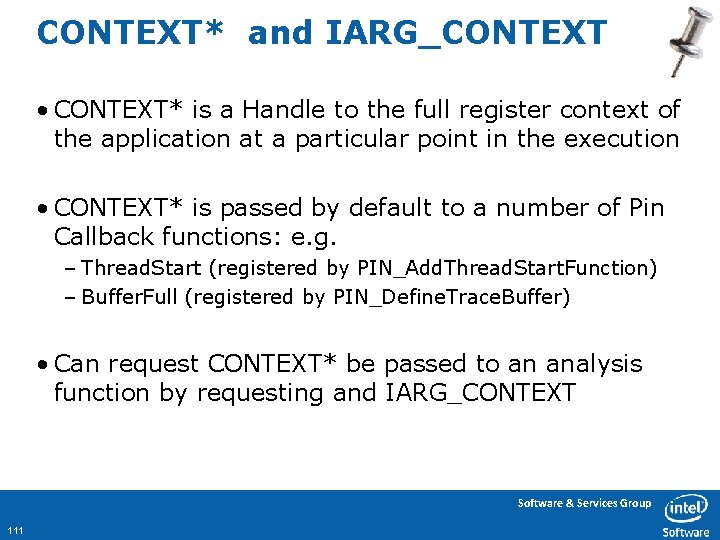
CONTEXT* and IARG_CONTEXT • CONTEXT* is a Handle to the full register context of the application at a particular point in the execution • CONTEXT* is passed by default to a number of Pin Callback functions: e. g. – Thread. Start (registered by PIN_Add. Thread. Start. Function) – Buffer. Full (registered by PIN_Define. Trace. Buffer) • Can request CONTEXT* be passed to an analysis function by requesting and IARG_CONTEXT Software & Services Group 111
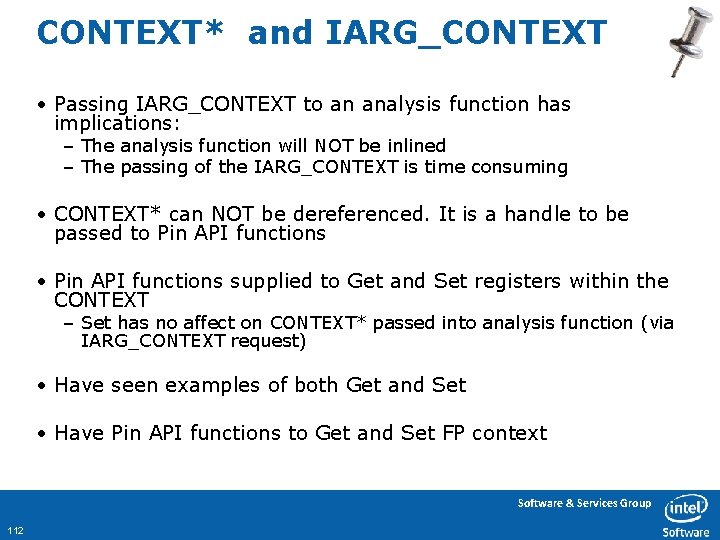
CONTEXT* and IARG_CONTEXT • Passing IARG_CONTEXT to an analysis function has implications: – The analysis function will NOT be inlined – The passing of the IARG_CONTEXT is time consuming • CONTEXT* can NOT be dereferenced. It is a handle to be passed to Pin API functions • Pin API functions supplied to Get and Set registers within the CONTEXT – Set has no affect on CONTEXT* passed into analysis function (via IARG_CONTEXT request) • Have seen examples of both Get and Set • Have Pin API functions to Get and Set FP context Software & Services Group 112
Managing Exceptions and Signals Software & Services Group 113
Exceptions • Catch Exceptions that occur in Pin Tool code – Global exception handler – PIN_Add. Internal. Exception. Handler – Guard code section with exception handler – PIN_Try. Start – PIN_Try. End Software & Services Group 114
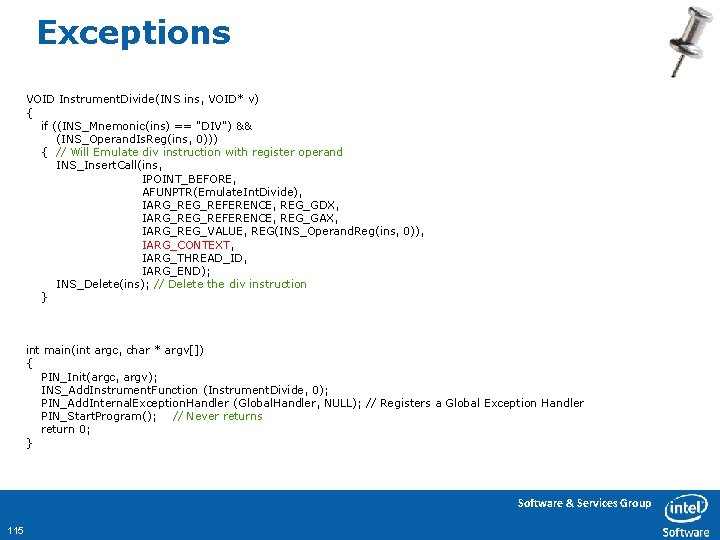
Exceptions VOID Instrument. Divide(INS ins, VOID* v) { if ((INS_Mnemonic(ins) == "DIV") && (INS_Operand. Is. Reg(ins, 0))) { // Will Emulate div instruction with register operand INS_Insert. Call(ins, IPOINT_BEFORE, AFUNPTR(Emulate. Int. Divide), IARG_REFERENCE, REG_GDX, IARG_REFERENCE, REG_GAX, IARG_REG_VALUE, REG(INS_Operand. Reg(ins, 0)), IARG_CONTEXT, IARG_THREAD_ID, IARG_END); INS_Delete(ins); // Delete the div instruction } int main(int argc, char * argv[]) { PIN_Init(argc, argv); INS_Add. Instrument. Function (Instrument. Divide, 0); PIN_Add. Internal. Exception. Handler (Global. Handler, NULL); // Registers a Global Exception Handler PIN_Start. Program(); // Never returns return 0; } Software & Services Group 115
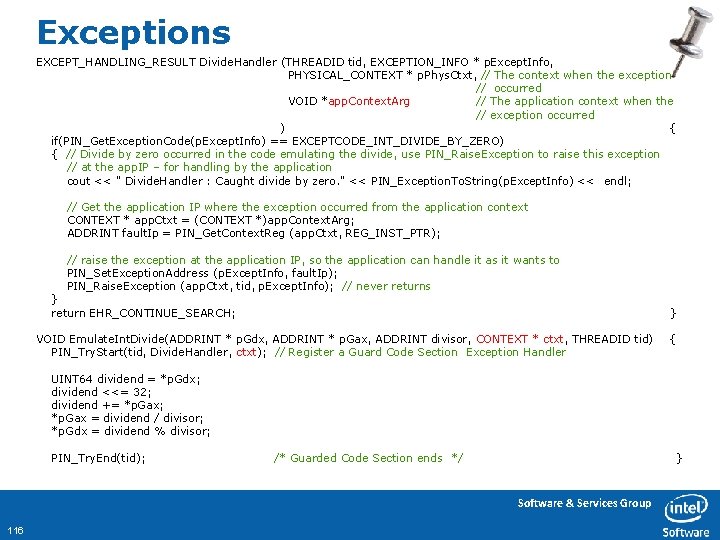
Exceptions EXCEPT_HANDLING_RESULT Divide. Handler (THREADID tid, EXCEPTION_INFO * p. Except. Info, PHYSICAL_CONTEXT * p. Phys. Ctxt, // The context when the exception // occurred VOID *app. Context. Arg // The application context when the // exception occurred ) { if(PIN_Get. Exception. Code(p. Except. Info) == EXCEPTCODE_INT_DIVIDE_BY_ZERO) { // Divide by zero occurred in the code emulating the divide, use PIN_Raise. Exception to raise this exception // at the app. IP – for handling by the application cout << " Divide. Handler : Caught divide by zero. " << PIN_Exception. To. String(p. Except. Info) << endl; // Get the application IP where the exception occurred from the application context CONTEXT * app. Ctxt = (CONTEXT *)app. Context. Arg; ADDRINT fault. Ip = PIN_Get. Context. Reg (app. Ctxt, REG_INST_PTR); // raise the exception at the application IP, so the application can handle it as it wants to PIN_Set. Exception. Address (p. Except. Info, fault. Ip); PIN_Raise. Exception (app. Ctxt, tid, p. Except. Info); // never returns } return EHR_CONTINUE_SEARCH; } VOID Emulate. Int. Divide(ADDRINT * p. Gdx, ADDRINT * p. Gax, ADDRINT divisor, CONTEXT * ctxt, THREADID tid) PIN_Try. Start(tid, Divide. Handler, ctxt); // Register a Guard Code Section Exception Handler { UINT 64 dividend = *p. Gdx; dividend <<= 32; dividend += *p. Gax; *p. Gax = dividend / divisor; *p. Gdx = dividend % divisor; PIN_Try. End(tid); /* Guarded Code Section ends */ } Software & Services Group 116
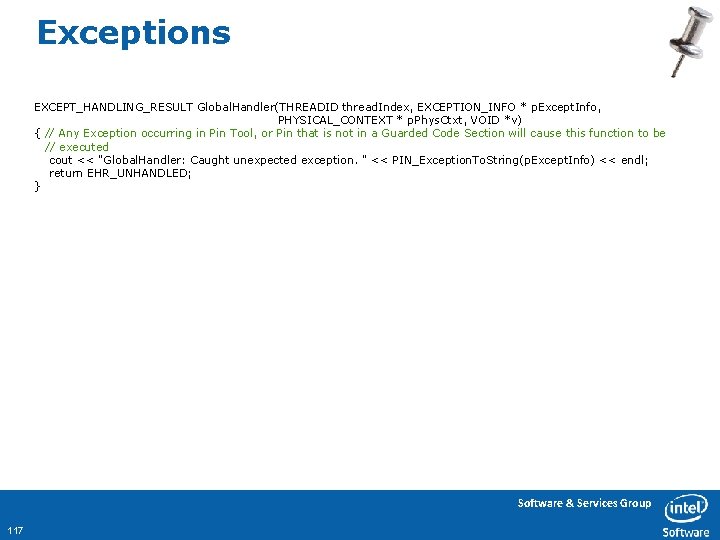
Exceptions EXCEPT_HANDLING_RESULT Global. Handler(THREADID thread. Index, EXCEPTION_INFO * p. Except. Info, PHYSICAL_CONTEXT * p. Phys. Ctxt, VOID *v) { // Any Exception occurring in Pin Tool, or Pin that is not in a Guarded Code Section will cause this function to be // executed cout << "Global. Handler: Caught unexpected exception. " << PIN_Exception. To. String(p. Except. Info) << endl; return EHR_UNHANDLED; } Software & Services Group 117
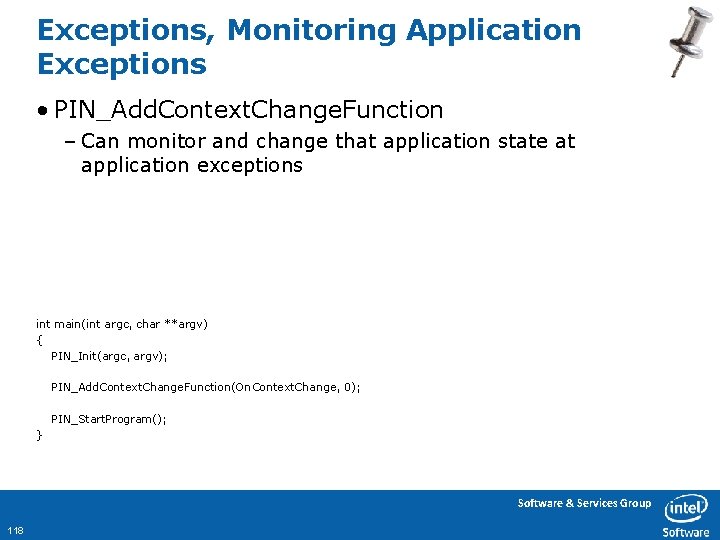
Exceptions, Monitoring Application Exceptions • PIN_Add. Context. Change. Function – Can monitor and change that application state at application exceptions int main(int argc, char **argv) { PIN_Init(argc, argv); PIN_Add. Context. Change. Function(On. Context. Change, 0); PIN_Start. Program(); } Software & Services Group 118
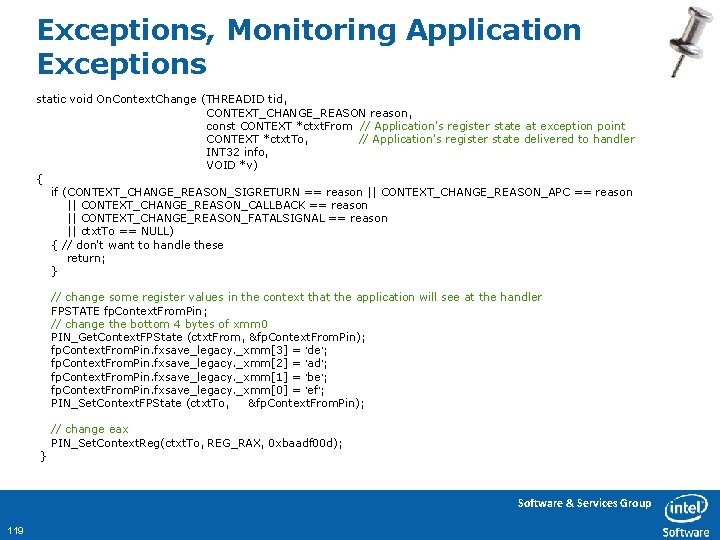
Exceptions, Monitoring Application Exceptions static void On. Context. Change (THREADID tid, CONTEXT_CHANGE_REASON reason, const CONTEXT *ctxt. From // Application's register state at exception point CONTEXT *ctxt. To, // Application's register state delivered to handler INT 32 info, VOID *v) { if (CONTEXT_CHANGE_REASON_SIGRETURN == reason || CONTEXT_CHANGE_REASON_APC == reason || CONTEXT_CHANGE_REASON_CALLBACK == reason || CONTEXT_CHANGE_REASON_FATALSIGNAL == reason || ctxt. To == NULL) { // don't want to handle these return; } // change some register values in the context that the application will see at the handler FPSTATE fp. Context. From. Pin; // change the bottom 4 bytes of xmm 0 PIN_Get. Context. FPState (ctxt. From, &fp. Context. From. Pin); fp. Context. From. Pin. fxsave_legacy. _xmm[3] = 'de'; fp. Context. From. Pin. fxsave_legacy. _xmm[2] = 'ad'; fp. Context. From. Pin. fxsave_legacy. _xmm[1] = 'be'; fp. Context. From. Pin. fxsave_legacy. _xmm[0] = 'ef'; PIN_Set. Context. FPState (ctxt. To, &fp. Context. From. Pin); } // change eax PIN_Set. Context. Reg(ctxt. To, REG_RAX, 0 xbaadf 00 d); Software & Services Group 119
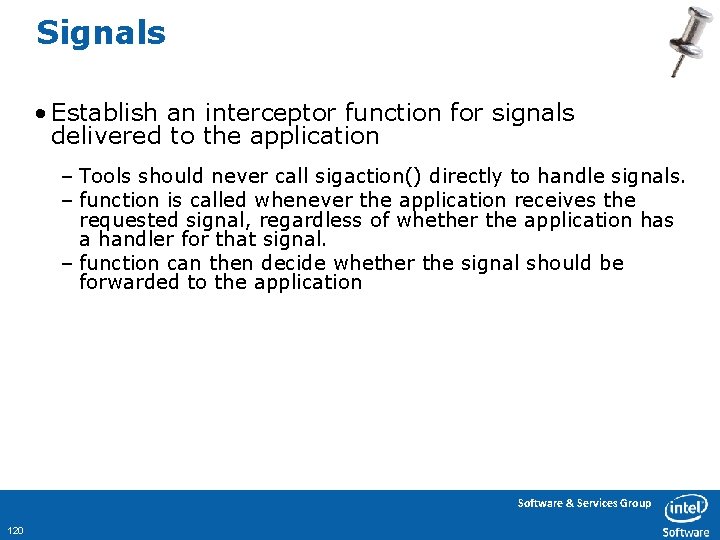
Signals • Establish an interceptor function for signals delivered to the application – Tools should never call sigaction() directly to handle signals. – function is called whenever the application receives the requested signal, regardless of whether the application has a handler for that signal. – function can then decide whether the signal should be forwarded to the application Software & Services Group 120
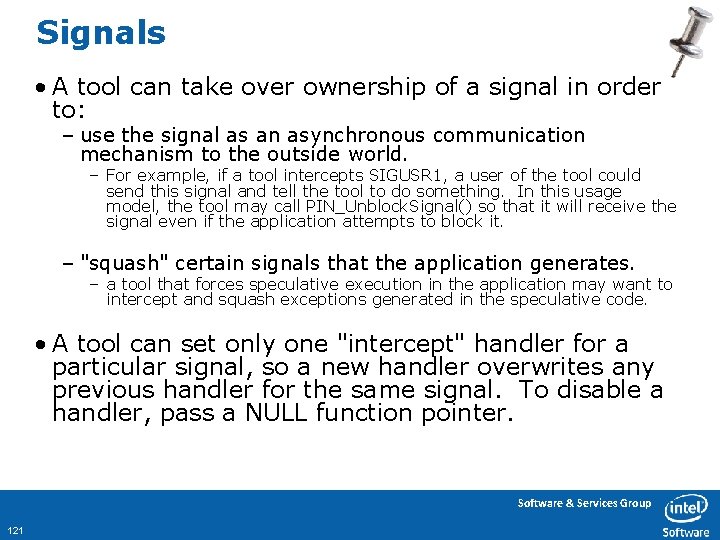
Signals • A tool can take over ownership of a signal in order to: – use the signal as an asynchronous communication mechanism to the outside world. – For example, if a tool intercepts SIGUSR 1, a user of the tool could send this signal and tell the tool to do something. In this usage model, the tool may call PIN_Unblock. Signal() so that it will receive the signal even if the application attempts to block it. – "squash" certain signals that the application generates. – a tool that forces speculative execution in the application may want to intercept and squash exceptions generated in the speculative code. • A tool can set only one "intercept" handler for a particular signal, so a new handler overwrites any previous handler for the same signal. To disable a handler, pass a NULL function pointer. Software & Services Group 121
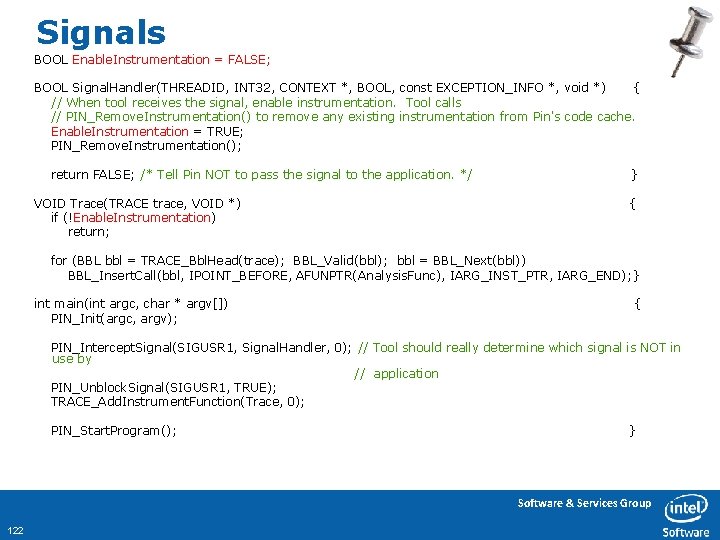
Signals BOOL Enable. Instrumentation = FALSE; BOOL Signal. Handler(THREADID, INT 32, CONTEXT *, BOOL, const EXCEPTION_INFO *, void *) { // When tool receives the signal, enable instrumentation. Tool calls // PIN_Remove. Instrumentation() to remove any existing instrumentation from Pin's code cache. Enable. Instrumentation = TRUE; PIN_Remove. Instrumentation(); return FALSE; /* Tell Pin NOT to pass the signal to the application. */ VOID Trace(TRACE trace, VOID *) if (!Enable. Instrumentation) return; } { for (BBL bbl = TRACE_Bbl. Head(trace); BBL_Valid(bbl); bbl = BBL_Next(bbl)) BBL_Insert. Call(bbl, IPOINT_BEFORE, AFUNPTR(Analysis. Func), IARG_INST_PTR, IARG_END); } int main(int argc, char * argv[]) PIN_Init(argc, argv); { PIN_Intercept. Signal(SIGUSR 1, Signal. Handler, 0); // Tool should really determine which signal is NOT in use by // application PIN_Unblock. Signal(SIGUSR 1, TRUE); TRACE_Add. Instrument. Function(Trace, 0); PIN_Start. Program(); } Software & Services Group 122
Accessing the Decode API • The decoder/encoder used is called XED – http: //www. pintool. org/docs/24110/Xed/html/ • Tool code can use the XED API – E. g. decode an instruction inside an analysis routine. Software & Services Group 123
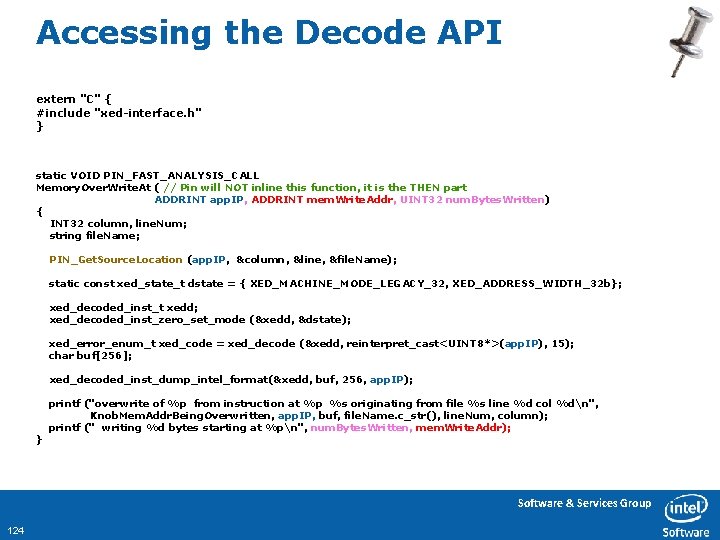
Accessing the Decode API extern "C" { #include "xed-interface. h" } static VOID PIN_FAST_ANALYSIS_CALL Memory. Over. Write. At ( // Pin will NOT inline this function, it is the THEN part ADDRINT app. IP, ADDRINT mem. Write. Addr, UINT 32 num. Bytes. Written) { INT 32 column, line. Num; string file. Name; PIN_Get. Source. Location (app. IP, &column, &line, &file. Name); static const xed_state_t dstate = { XED_MACHINE_MODE_LEGACY_32, XED_ADDRESS_WIDTH_32 b}; xed_decoded_inst_t xedd; xed_decoded_inst_zero_set_mode (&xedd, &dstate); xed_error_enum_t xed_code = xed_decode (&xedd, reinterpret_cast<UINT 8*>(app. IP), 15); char buf[256]; xed_decoded_inst_dump_intel_format(&xedd, buf, 256, app. IP); } printf ("overwrite of %p from instruction at %p %s originating from file %s line %d col %dn", Knob. Mem. Addr. Being. Overwritten, app. IP, buf, file. Name. c_str(), line. Num, column); printf (" writing %d bytes starting at %pn", num. Bytes. Written, mem. Write. Addr); Software & Services Group 124
Pin Code-Cache API • The Code-Cache API allows a Pin Tool to: – Inspect Pin's code cache and/or alter the code cache replacement policy – Assume full control of the code cache – Remove all or selected traces from the code cache – Monitor code cache activity, including start/end of execution of code in the code cache Software & Services Group 125
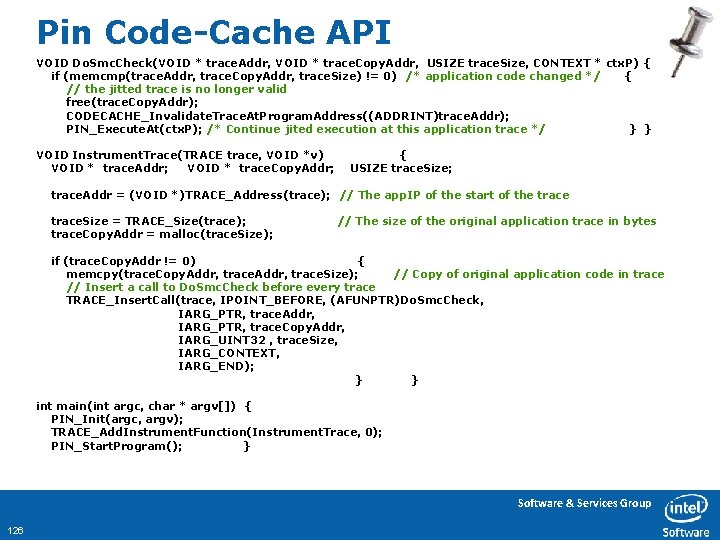
Pin Code-Cache API VOID Do. Smc. Check(VOID * trace. Addr, VOID * trace. Copy. Addr, USIZE trace. Size, CONTEXT * ctx. P) { if (memcmp(trace. Addr, trace. Copy. Addr, trace. Size) != 0) /* application code changed */ { // the jitted trace is no longer valid free(trace. Copy. Addr); CODECACHE_Invalidate. Trace. At. Program. Address((ADDRINT)trace. Addr); PIN_Execute. At(ctx. P); /* Continue jited execution at this application trace */ } } VOID Instrument. Trace(TRACE trace, VOID *v) VOID * trace. Addr; VOID * trace. Copy. Addr; { USIZE trace. Size; trace. Addr = (VOID *)TRACE_Address(trace); // The app. IP of the start of the trace. Size = TRACE_Size(trace); trace. Copy. Addr = malloc(trace. Size); // The size of the original application trace in bytes if (trace. Copy. Addr != 0) { memcpy(trace. Copy. Addr, trace. Size); // Copy of original application code in trace // Insert a call to Do. Smc. Check before every trace TRACE_Insert. Call(trace, IPOINT_BEFORE, (AFUNPTR)Do. Smc. Check, IARG_PTR, trace. Addr, IARG_PTR, trace. Copy. Addr, IARG_UINT 32 , trace. Size, IARG_CONTEXT, IARG_END); } } int main(int argc, char * argv[]) { PIN_Init(argc, argv); TRACE_Add. Instrument. Function(Instrument. Trace, 0); PIN_Start. Program(); } Software & Services Group 126
Transparent debugging, and extending the debugger • Transparently debug the application while it is running on Pin + Pin Tool – Have detailed explanation in the Pin User Manual • Use Pin Tool to enhance/extend the debugger capabilities – Watchpoint: Is order of magnitude faster when implemented using Pin Tool – See previous “Symbols: Accessing Application Debug Info from a Pin Tool” – Which branch is branching to address 0 – Easy to write a Pin Tool that implements this Software & Services Group 127
Part 4 Summary • Boldly went where no pin head has gone before… – Lived to tell the tail – membuffer_threadpool tool – Using multiple buffers in the Pin Buffering API – Using Pin Tool Threads – Using Pin and OS locks to synchronize threads – System call instrumentation – Instrumenting a process tree – CONTEXT* and IARG_CONTEXT – Managing Exceptions and Signals – Decode API – Pin Code-Cache API – Transparent debugging, and extending the debugger Software & Services Group 128
Part 5 Performance #s Software & Services Group 129
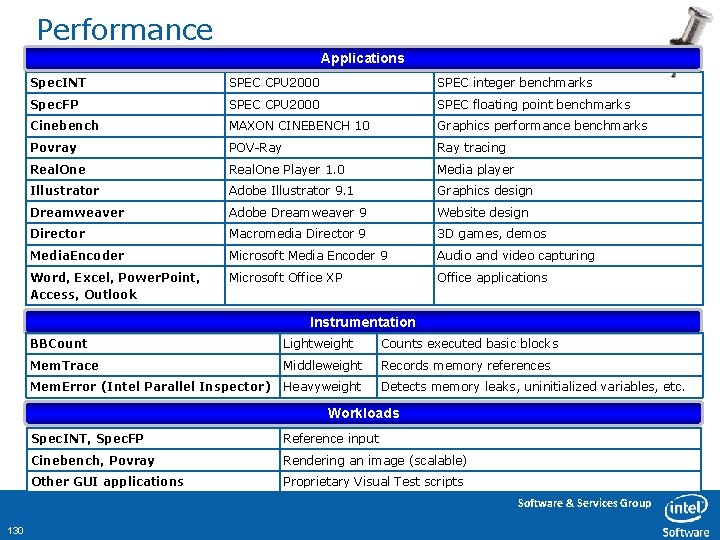
Performance Applications Spec. INT SPEC CPU 2000 SPEC integer benchmarks Spec. FP SPEC CPU 2000 SPEC floating point benchmarks Cinebench MAXON CINEBENCH 10 Graphics performance benchmarks Povray POV-Ray tracing Real. One Player 1. 0 Media player Illustrator Adobe Illustrator 9. 1 Graphics design Dreamweaver Adobe Dreamweaver 9 Website design Director Macromedia Director 9 3 D games, demos Media. Encoder Microsoft Media Encoder 9 Audio and video capturing Word, Excel, Power. Point, Access, Outlook Microsoft Office XP Office applications Instrumentation BBCount Lightweight Counts executed basic blocks Mem. Trace Middleweight Records memory references Mem. Error (Intel Parallel Inspector) Heavyweight Detects memory leaks, uninitialized variables, etc. Workloads Spec. INT, Spec. FP Reference input Cinebench, Povray Rendering an image (scalable) Other GUI applications Proprietary Visual Test scripts Software & Services Group 130
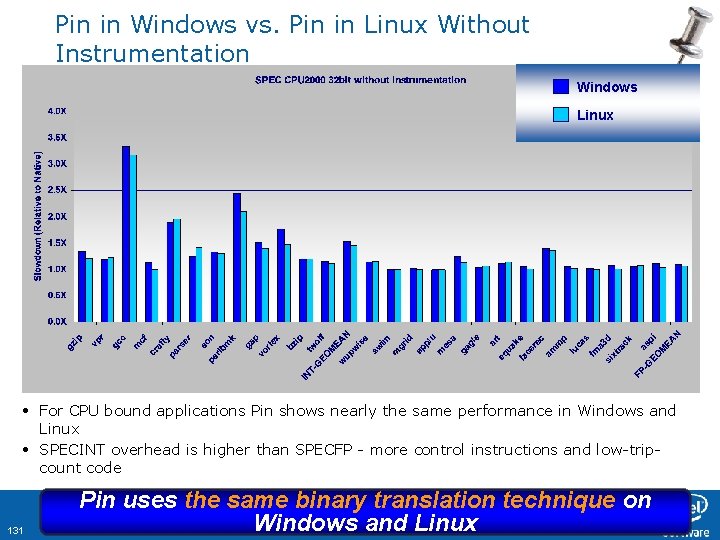
Pin in Windows vs. Pin in Linux Without Instrumentation Windows Linux • For CPU bound applications Pin shows nearly the same performance in Windows and Linux • SPECINT overhead is higher than SPECFP - more control instructions and low-tripcount code 131 Software & Services Group Pin uses the same binary translation technique on Windows and Linux
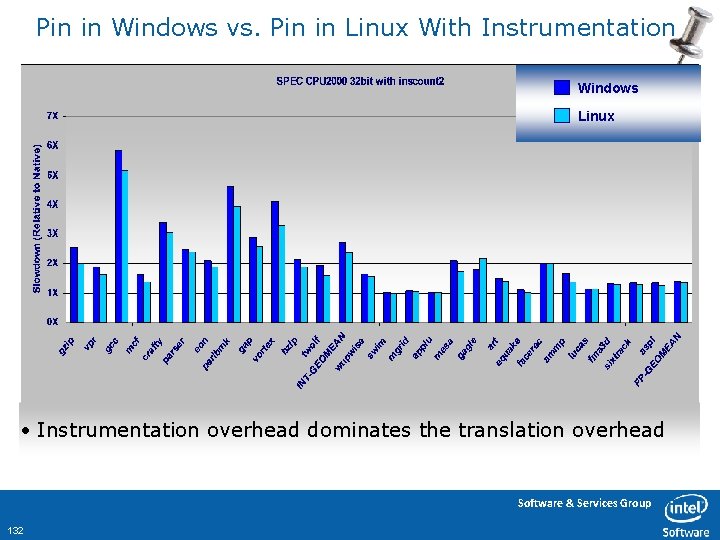
Pin in Windows vs. Pin in Linux With Instrumentation Windows Linux • Instrumentation overhead dominates the translation overhead Software & Services Group 132
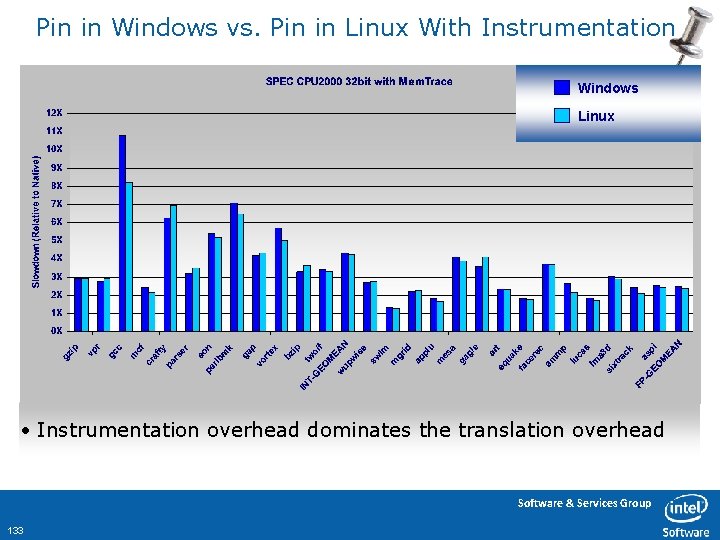
Pin in Windows vs. Pin in Linux With Instrumentation Windows Linux • Instrumentation overhead dominates the translation overhead Software & Services Group 133
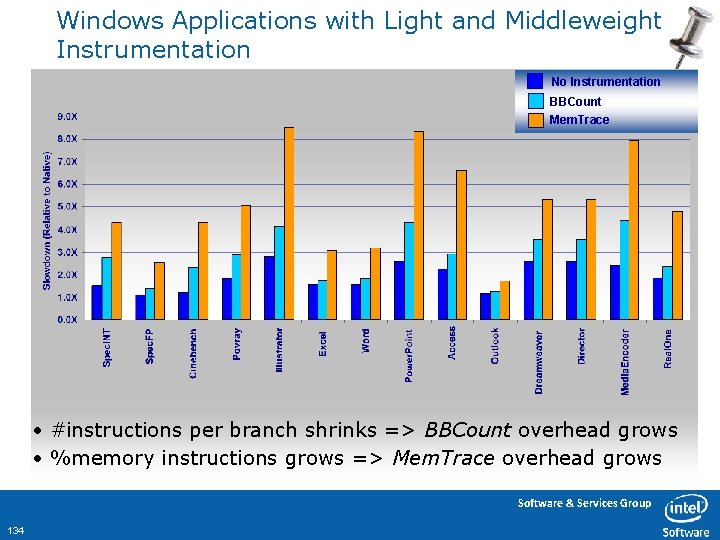
Windows Applications with Light and Middleweight Instrumentation No Instrumentation BBCount Mem. Trace • #instructions per branch shrinks => BBCount overhead grows • %memory instructions grows => Mem. Trace overhead grows Software & Services Group 134
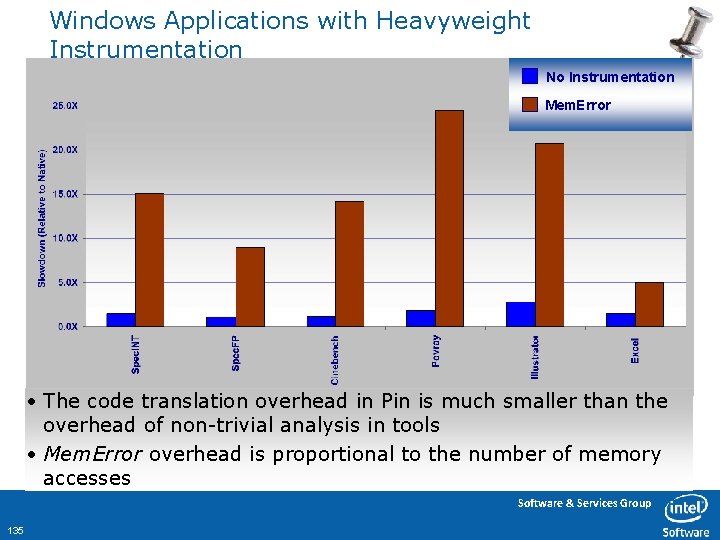
Windows Applications with Heavyweight Instrumentation No Instrumentation Mem. Error • The code translation overhead in Pin is much smaller than the overhead of non-trivial analysis in tools • Mem. Error overhead is proportional to the number of memory accesses Software & Services Group 135
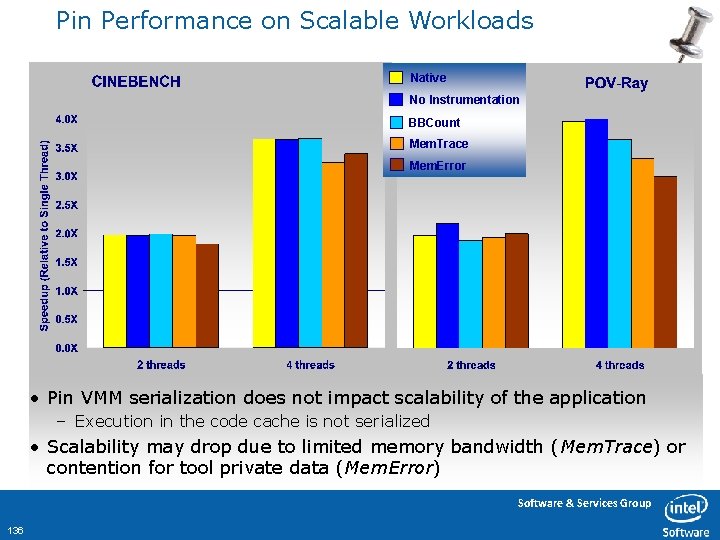
Pin Performance on Scalable Workloads Native No Instrumentation BBCount Mem. Trace Mem. Error • Pin VMM serialization does not impact scalability of the application – Execution in the code cache is not serialized • Scalability may drop due to limited memory bandwidth (Mem. Trace) or contention for tool private data (Mem. Error) Software & Services Group 136
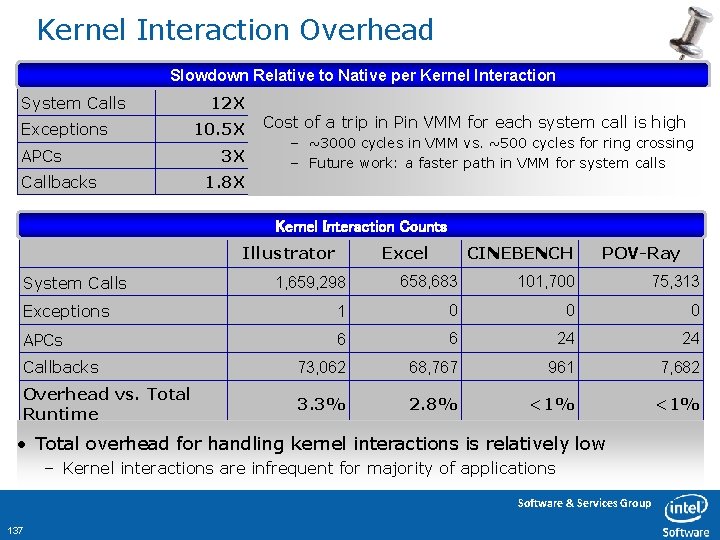
Kernel Interaction Overhead Slowdown Relative to Native per Kernel Interaction System Calls • assa Exceptions APCs Callbacks 12 X 10. 5 X 3 X Cost of a trip in Pin VMM for each system call is high – ~3000 cycles in VMM vs. ~500 cycles for ring crossing – Future work: a faster path in VMM for system calls 1. 8 X Kernel Interaction Counts Illustrator System Calls Excel CINEBENCH POV-Ray 1, 659, 298 658, 683 101, 700 75, 313 Exceptions 1 0 0 0 APCs 6 6 24 24 Callbacks 73, 062 68, 767 961 7, 682 Overhead vs. Total Runtime 3. 3% 2. 8% <1% • Total overhead for handling kernel interactions is relatively low – Kernel interactions are infrequent for majority of applications Software & Services Group 137
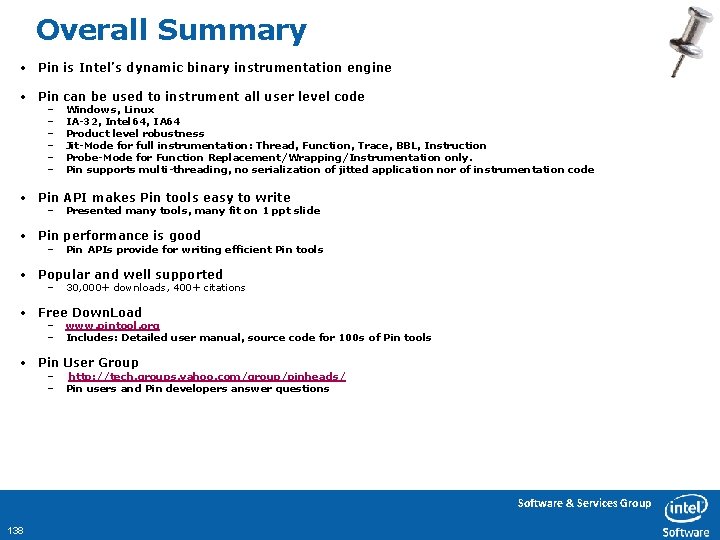
Overall Summary • Pin is Intel’s dynamic binary instrumentation engine • Pin can be used to instrument all user level code – – – Windows, Linux IA-32, Intel 64, IA 64 Product level robustness Jit-Mode for full instrumentation: Thread, Function, Trace, BBL, Instruction Probe-Mode for Function Replacement/Wrapping/Instrumentation only. Pin supports multi-threading, no serialization of jitted application nor of instrumentation code • Pin API makes Pin tools easy to write – Presented many tools, many fit on 1 ppt slide • Pin performance is good – Pin APIs provide for writing efficient Pin tools • Popular and well supported – 30, 000+ downloads, 400+ citations • Free Down. Load – – www. pintool. org Includes: Detailed user manual, source code for 100 s of Pin tools • Pin User Group – – http: //tech. groups. yahoo. com/group/pinheads/ Pin users and Pin developers answer questions Software & Services Group 138
- Slides: 138