PIFSC Commercial Fisheries and Market Research Pacific Islands


- Slides: 33

PIFSC Commercial Fisheries and Market Research Pacific Islands Fisheries Science Center Justin Hospital 2017 PIFSC External Review: Economics and Human Dimensions August 1, 2017

Commercial Fisheries in Hawaii U. S. Department of Commerce | National Oceanic and Atmospheric Administration | NOAA Fisheries | Page 2

Commercial Fisheries in Hawaii Honolulu Commercial Fisheries in 2015 32 million pounds 6 th in value: $97 million 27 th in landings: Fisheries of the United States 2015 U. S. Department of Commerce | National Oceanic and Atmospheric Administration | NOAA Fisheries | Page 3

Commercial Fisheries in Hawaii In 2015, the State of Hawaii commercial fishing and seafood industry generated: $814 million: Sales Impacts $247 million: Income Impacts $362 million: Value-Added Impacts 9, 000 full- and part-time jobs Fisheries of the United States 2015 U. S. Department of Commerce | National Oceanic and Atmospheric Administration | NOAA Fisheries | Page 4

Commercial Fisheries in Hawaii U. S. Department of Commerce | National Oceanic and Atmospheric Administration | NOAA Fisheries | Page 5

Commercial Fisheries in Hawaii-permitted Longline Limited entry: 164 permits Deep-set targeting Bigeye Tuna Shallow-set targeting Swordfish 2016: 32 million pounds, $99 million, 142 active Originally (early 1990 s) a swordfishery, now overwhelmingly targeting bigeye tuna U. S. Department of Commerce | National Oceanic and Atmospheric Administration | NOAA Fisheries | Page 6

Commercial Fisheries in Hawaii Recent Trends More active vessels More High Seas Fishing U. S. Department of Commerce | National Oceanic and Atmospheric Administration | NOAA Fisheries | Page 7

Commercial Fisheries in the Western Pacific Management Trends Traditionally managed by protected species take limits (stay tuned for spotlight talks) U. S. Department of Commerce | National Oceanic and Atmospheric Administration | NOAA Fisheries | Page 8

Commercial Fisheries in the Western Pacific Management Trends Traditionally managed by protected species take limits (stay tuned for spotlight talks) Bigeye tuna quotas are potentially becoming a constraint Recent closures* in the WCPO 2009: 4 days 2010: 40 days 2015: 68 days 2016: 49 days U. S. Department of Commerce | National Oceanic and Atmospheric Administration | NOAA Fisheries | Page 9

Commercial Fisheries in the Western Pacific Management Trends Traditionally managed by protected species take limits (stay tuned for spotlight talks) Bigeye tuna quotas are potentially becoming a constraint U. S. Department of Commerce | National Oceanic and Atmospheric Administration | NOAA Fisheries | Page 10

Commercial Fisheries in the Western Pacific American Samoa Longline Primarily targets albacore Consistent decline in revenues recent years High rates of attrition: (a) declining CPUE, (b) low prices (c) high costs ~13 active vessels U. S. Department of Commerce | National Oceanic and Atmospheric Administration | NOAA Fisheries | Page 11

Commercial Fisheries in the Western Pacific Hawaii Bottomfish (Deep 7) • • Artisanal commercial small boat fishery Lands high value, culturally significant species Small group of commercial fishery highliners Strong demand during holidays 2012 – 2016 averages Number of fishers: 428 Number of fishers with sales: 345 Fishery Landings: 237, 000 pounds Fishery Revenues: $1. 6 million Average price: $6. 97 / pound U. S. Department of Commerce | National Oceanic and Atmospheric Administration | NOAA Fisheries | Page 12

Mandates and Stakeholder Needs MSA – National Standards Regulatory Requirements • • • National Environmental Policy Act Regulatory Impact Reviews Regulatory Flexibility Act E. O. 12866 (Costs and Benefits; Distribution) E. O. 12898 (Environmental Justice) U. S. Department of Commerce | National Oceanic and Atmospheric Administration | NOAA Fisheries | Page 13

Research Drivers and Initiatives Stakeholder Research Priorities and Recommendations • Analysis of management alternatives and economic data needs for regulatory requirements • We have tried to adapt our research portfolio to meet the changing needs of our fisheries Economic Data Collection Contributions to National Economic Assessment Indicators U. S. Department of Commerce | National Oceanic and Atmospheric Administration | NOAA Fisheries | Page 14

Key Research Themes • Economic Data Collection Programs • Economic Performance Indicators • Economic Analysis of Management Options • Market Dynamics and Consumer Preferences U. S. Department of Commerce | National Oceanic and Atmospheric Administration | NOAA Fisheries | Page 15

U. S. Department of Commerce | National Oceanic and Atmospheric Administration | NOAA Fisheries | Page 16

Economic Performance Indicators Trends in trip costs and net revenues (Pan, in draft) HI Longline, AS Longline U. S. Department of Commerce | National Oceanic and Atmospheric Administration | NOAA Fisheries | Page 17

Economic Performance Indicators Tier 1 indicators HI Longline, AS Longline, MHI Bottomfish Revenues per vessel, trip, day-at-sea Gini Coefficient U. S. Department of Commerce | National Oceanic and Atmospheric Administration | NOAA Fisheries | Page 18

Economic Performance Indicators Fisheries Productivity (Pan and Walden, 2015) Biomass Index Lowe Productivity Index • Unadjusted productivity measures suggest declines • Adjusted productivity measures show increases for tuna fishing after 2009 • Tuna fishing seems more efficient than swordfishing U. S. Department of Commerce | National Oceanic and Atmospheric Administration | NOAA Fisheries | Page 19

Economic Analysis of Management Options Hawaii fisheries Input-output model Catch Share Programs for Pacific Islands Fisheries Spotlight Talks – stay tuned U. S. Department of Commerce | National Oceanic and Atmospheric Administration | NOAA Fisheries | Page 20

Hawaii Fisheries Input-Output Model Hawaii Fisheries Input-Output (I/O) Model has been updated in 1998, 2005, and again in 2011 Used to analyze fishery regulations and economic impacts to support sectors. U. S. Department of Commerce | National Oceanic and Atmospheric Administration | NOAA Fisheries | Page 21

Catch Share Programs for Pacific Islands Fisheries 2010 Workshop 4 days at University of Hawaii 30 participants, 20 expert speakers U. S. Department of Commerce | National Oceanic and Atmospheric Administration | NOAA Fisheries | Page 22

Catch Share Programs Special Issue in Marine Policy (2014) 44 3 PIFSC contributions Regional Assessment of Catch Shares (Allen, 2014) Hawaii Longline (Pan, 2014) Hawaii Bottomfish (Hospital and Beavers, 2014) U. S. Department of Commerce | National Oceanic and Atmospheric Administration | NOAA Fisheries | Page 23

Market Dynamics and Consumer Preferences Hawaii Bottomfish Demand Modeling Bigeye Tuna Closures Hawaii Retail Monitoring Program – stay tuned Consumer Preferences – stay tuned Conjoint Analysis CO-treated tuna Aquaculture and Wild capture fish U. S. Department of Commerce | National Oceanic and Atmospheric Administration | NOAA Fisheries | Page 24

Market Dynamics Hawaii Bottomfish Demand Modeling • Economic and culturally significant insular fishery • First insular fishery to move to Total Allowable Catch (quota) management (1) Estimated price flexibilities to understand potential economic implications of quota management (2) Understand market relationships between MHI, NWHI, and imported bottomfish U. S. Department of Commerce | National Oceanic and Atmospheric Administration | NOAA Fisheries | Page 25

Market Dynamics Bigeye Tuna Closure Analyses (2010) • 40 day fishery closure in 2010 • Mixed methods approach • Fish Dealers among those most affected U. S. Department of Commerce | National Oceanic and Atmospheric Administration | NOAA Fisheries | Page 26

Market Dynamics Bigeye Tuna Closure Analyses (2015) • 68 -day closure in West Central Pacific • Semi-structured interviews conducted during closure • Misaligned incentives, fishing fleet heterogeneity and different regulations across the Pacific complicates domestic conservation and management efforts Ayers et al. , in prep U. S. Department of Commerce | National Oceanic and Atmospheric Administration | NOAA Fisheries | Page 27

Key Partnerships and Collaborations Support from the Fishing Industry – all primary data collection is voluntary University of Hawaii – a lot of innovative fisheries economics work has come from UH • Long history of PIFSC mentorship supporting graduate students NMFS Economists – contributions to National Working Groups and National Research Initiatives (Tier 1 Indicators, Productivity, Economic Returns, etc…) U. S. Department of Commerce | National Oceanic and Atmospheric Administration | NOAA Fisheries | Page 28

Strengths: Robust time series of economic operating cost data and good quality socioeconomic cost-earnings survey for commercial fisheries in the region. Tailored research to management needs Opportunities: New Fed economist starting in mid. September. New organizational structure – ecosystem pursuits (climate) Aspirations: provide more timely quantitative advice to support management – data support tools Restraints: Low staffing levels and high cost (time) for collecting and maintaining economic data collection programs U. S. Department of Commerce | National Oceanic and Atmospheric Administration | NOAA Fisheries | Page 29

Next Steps Maintain ongoing data collection programs Implement 2018 Marianas small boat cost earnings survey Collaborations with NMFS Economists: Safety at Sea research initiative (NWFSC-lead) Physics and Fisheries (SWFSC-lead) Economic Returns Working Group Trace ownership linkages in HI LL to re-examine economic performance measures U. S. Department of Commerce | National Oceanic and Atmospheric Administration | NOAA Fisheries | Page 30

Future Directions Understand drivers of fishers behavior and location choice for considering economic costs of management and/or climate change • Integrate Hawaii fisheries data with Fish. SET U. S. Department of Commerce | National Oceanic and Atmospheric Administration | NOAA Fisheries | Page 31

Future Directions Opportunities at PIFSC to expand economic applications to ecosystem enterprise Atlantis, West Hawaii IEA, Climate Ecosystem Theme Tomrrow U. S. Department of Commerce | National Oceanic and Atmospheric Administration | NOAA Fisheries | Page 32

Mahalo U. S. Department of Commerce | National Oceanic and Atmospheric Administration | NOAA Fisheries | Page 33
 Pifsc
Pifsc Piccap
 Commercial and non commercial food service
 Market segmentation target and positioning
 Leader challenger follower nicher
 Split institute of oceanography and fisheries
 Agriculture fisheries and food authority
 Institute of oceanography and fisheries
 Ministry of food agriculture and fisheries denmark
 Rules of natural justice
 Dg fisheries
 399
399 Jupyterhub ucsd
 Intermix
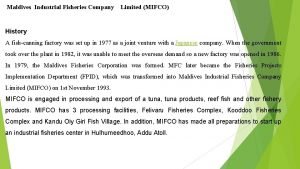
 Mifco logo
 Frafra v boakye
 American fisheries society certification
 Southeast fisheries science center
 Small-scale fisheries
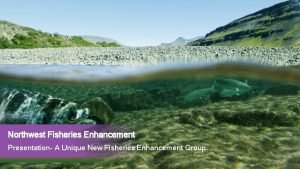
 Northwest fisheries
 Handling and transportation of fish
 Ocean fisheries
 Ocean fisheries
 Ocean fisheries
 Alaska fisheries development foundation
 General fisheries commission for the mediterranean
 National fisheries service
 Star fisheries
 Apex fisheries
 Fisheries management
 Atlantic fisheries fund
 Deforestation
 Negative impact of logging
 Gaps and islands


