Pie Charts Worksheet A Worksheets increase in difficulty


 40 people were asked to name their favourite exercise. The results")
 40 people were asked to name their favourite exercise. The results")
 144 people were asked to name their favourite exercise. The results")
 40 people were asked to name their favourite exercise. The results")
 144 people were asked to name their favourite exercise. The results")

- Slides: 10
Pie Charts – Worksheet A Worksheets increase in difficulty and are in 2 sizes.
Printing To print handouts from slides Select the slide from the left. Then click: File > Print > ‘Print Current Slide’ To print multiple slides Click on a section title to highlight all those slides, or press ‘Ctrl’ at the same time as selecting slides to highlight more than one. Then click: File > Print > ‘Print Selection’ To print double-sided handouts Highlight both slides before using ‘Print Selection’. Choose ‘Print on Both Sides’ and ‘Flip on Short Edge’.
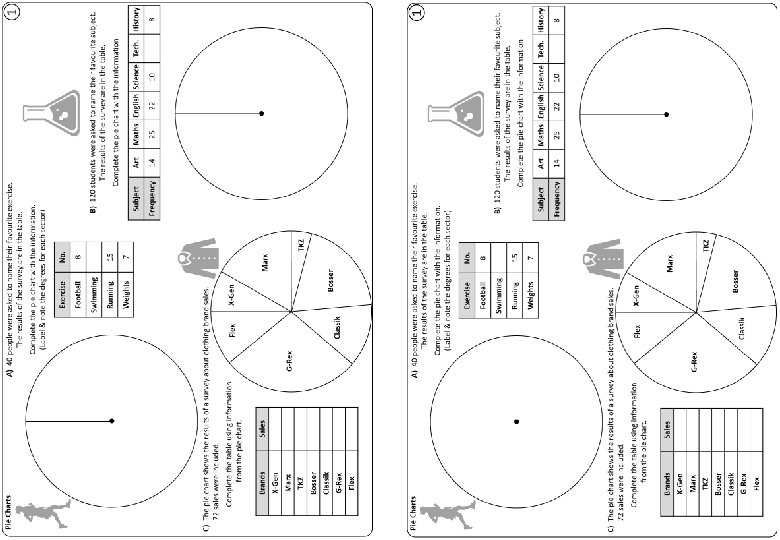
Pie Charts A) 40 people were asked to name their favourite exercise. The results of the survey are in the table. Complete the pie chart with the information. (Label & note the degrees for each sector) Exercise No. Football 8 B) 120 students were asked to name their favourite subject. The results of the survey are in the table. Swimming Running 15 Weights 7 Complete the pie chart with the information C) The pie chart shows the results of a survey about clothing brand sales. 72 sales were included. Complete the table using information from the pie chart. Brands Flex Sales Marx X-Gen G-Rex TKZ Bosser Classik G-Rex Flex Classik Bosser Subject Art Frequency 14 Maths English Science Tech. History 25 22 10 8
Pie Charts A) 40 people were asked to name their favourite exercise. The results of the survey are in the table. Use a protractor to check your partner's accuracy! Complete the pie chart with the information. (Label & note the degrees for each sector) Weights Football 63° 72° 135° 90° Swimming Running Exercise No. Football 8 Swimming 10 Running 15 Weights 7 B) 120 students were asked to name their favourite subject. The results of the survey are in the table. Complete the pie chart with the information Subject Art Frequency 14 Maths English Science Tech. History 25 22 10 41 History 24° C) The pie chart shows the results of a survey about clothing brand sales. 72 sales were included. Complete the table using information from the pie chart. Brands Sales X-Gen 6 Marx 12 TKZ 3 Bosser 14 Classik 9 G-Rex 20 Flex 8 Flex 40° G-Rex 100° 45° Classik 42° X-Gen Tech. 30° Marx 60° 70° Art 15° TKZ 123° 75° Maths 66° 30° English Bosser Science 8
Pie Charts A) 144 people were asked to name their favourite exercise. The results of the survey are in the table. Use a protractor to check your partner's accuracy! Complete the pie chart with the information. (Label & note the degrees for each sector) Weights Football 60° Running 50° 165° 85° Exercise No. Football 66 Swimming 34 Running 20 Weights 24 Swimming Complete the table using information from the pie chart. Sales X-Gen 60 Marx 100 TKZ 40 Bosser 20 Classik 80 G-Rex 36 Flex 144 Complete the pie chart with the information Subject Art Frequency 30 Maths English Science Tech. History 150 60 45 135 Art C) The pie chart shows the results of a survey about clothing brand sales. Brands B) 540 students were asked to name their favourite subject. The results of the survey are in the table. History X-Gen 60 Flex 45° 108° 27° 60° 75° Marx 30° G-Rex Classik 15° 20° Maths 80° 100° 90° 40° Tech. 30° English TKZ 480 Bosser Science 120
Pie Charts A) 40 people were asked to name their favourite exercise. The results of the survey are in the table. Complete the pie chart with the information. (Label & note the degrees for each sector) Exercise No. Football 8 B) 120 students were asked to name their favourite subject. The results of the survey are in the table. Swimming Running 15 Weights 7 Complete the pie chart with the information C) The pie chart shows the results of a survey about clothing brand sales. 72 sales were included. Complete the table using information from the pie chart. Brands Flex Sales Marx X-Gen G-Rex TKZ Bosser Classik G-Rex Flex Classik Bosser Subject Art Frequency 14 Maths English Science Tech. History 25 22 10 8
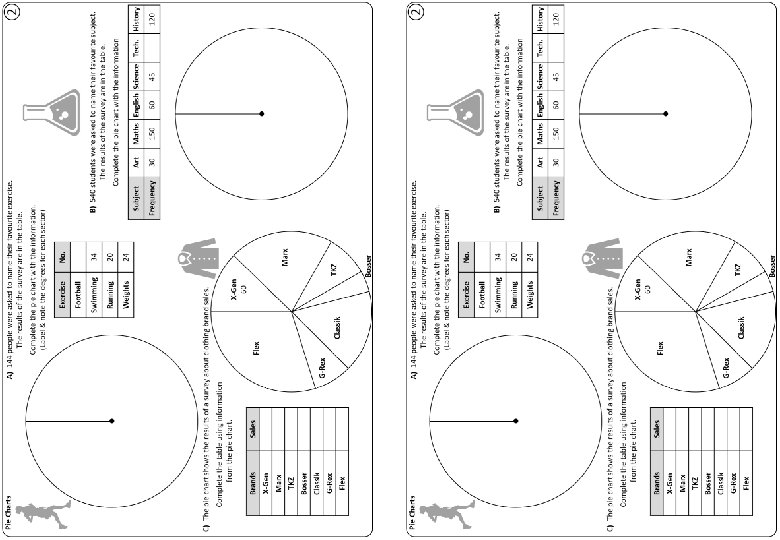
Pie Charts A) 144 people were asked to name their favourite exercise. The results of the survey are in the table. Complete the pie chart with the information. (Label & note the degrees for each sector) Exercise No. Football Swimming 34 Running 20 Weights 24 C) The pie chart shows the results of a survey about clothing brand sales. Complete the table using information from the pie chart. Brands X-Gen 60 Sales Flex X-Gen Marx TKZ Bosser Classik G-Rex Flex G-Rex Classik TKZ Bosser B) 540 students were asked to name their favourite subject. The results of the survey are in the table. Complete the pie chart with the information Subject Art Frequency 30 Maths English Science Tech. History 150 60 45 120
Questions? Comments? Suggestions? …or have you found a mistake!? Any feedback would be appreciated . Please feel free to email: tom@goteachmaths. co. uk