PIE CHARTS Lets warm up your brains first

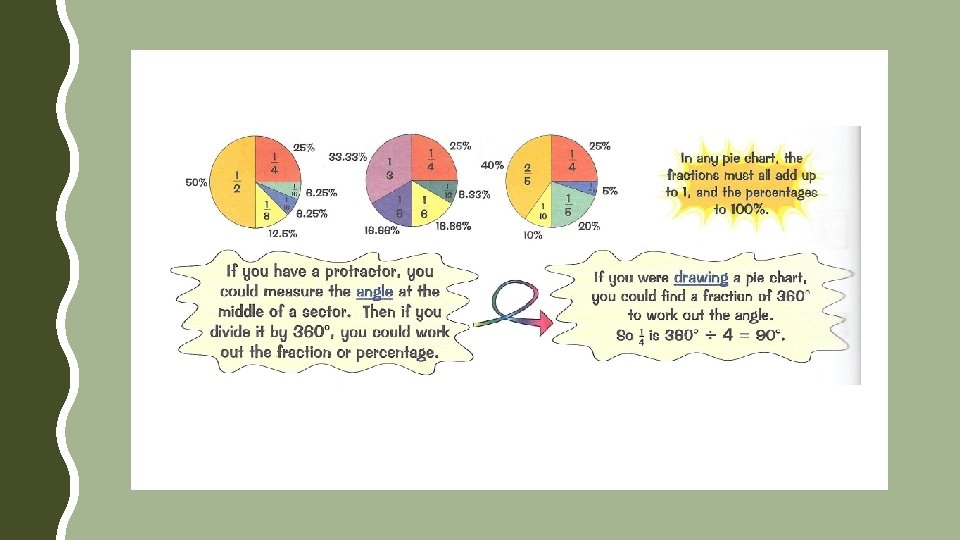
PIE CHARTS

Let’s warm up your brains first. What is … 10% of 140? 25% of 140? Two thirds of £ 2. 40? A quarter of 460 m? 35% of 100? 45% of 360 g? 14 (140 ÷ 10) 28 (double the 10% value) 35 (a quarter of 140) £ 1. 60 (one third is £ 2. 40 ÷ 3, which is 80 p) 115 m (460 m ÷ 4) 35 162 g (10% of 360 is 36; 5% is 18; 40% is 36 x 4 = 144) OR you could find 50% of 360 by halving, to give 180, then take of the 5% value (half of 10%, as above) Did you remember to include the unit of measurement in your answers? (Where needed. )

LO: To interpret pie charts.

How many people are represented by each sector if the whole amount represents 32 people? All sectors are the same size, so how will you find the value of one sector? There are 8 sectors, so simply divide 32 by 8. 4 What about: 88 people 160 people 120 people 11 20 15

If the pie chart indicates that 90 children like skipping, how many children like each of the activities? Complete the table. Which row can we complete first? The number of children that like skipping is in the question. 90. Activities Number of children Hopscotch Climbing frame 90 Skipping Trim trail

If the pie chart indicates that 90 children like skipping, how many children like each of the activities? How could you approach the remaining activities? What do you notice about the sectors? The trim trail sector is a quarter of the pie, the same as skipping, so 90 children like the trim trail. Activities Number of children Hopscotch Climbing frame Skipping 90 90 Trim trail

If the pie chart indicates that 90 children like skipping, how many children like each of the activities? What about the hopscotch and climbing frame sectors? Together, they take up half of the pie, the same as the trim trail and skipping, so 180 children (90 + 90) like these two activities. Activities Number of children Hopscotch Climbing frame Skipping 90 Trim trail 90

If the pie chart indicates that 90 children like skipping, how many children like each of the activities? What proportion of that half, does each activity take up? Hopscotch is one third of the half, and the climbing frame is two thirds. One third of 180 is … 60 Activities Number of children Hopscotch 60 Climbing frame Skipping 90 Trim trail 90

If the pie chart indicates that 90 children like skipping, how many children like each of the activities? So now you can calculate how many children like the climbing frame. The climbing frame sector is twice the size of hopscotch. 2 x 60 equals … 120 Activities Number of children Hopscotch 60 120 Climbing frame Skipping 90 Trim trail 90

If the pie chart indicates that 90 children like skipping, how many children like each of the activities? The table is now complete. Activities Number of children Hopscotch Climbing frame Skipping 60 120 90 Trim trail 90

This pie chart shows the favourite colour of 180 toddlers. How many toddlers selected each colour? Which colours are the easiest to find? It’s easy to find 10% of a value: simply divide by 10. 180 ÷ 10 is … 18 So 18 toddlers chose red, and 18 also chose orange. 18 18

This pie chart shows the favourite colour of 180 toddlers. How many toddlers selected each colour? You can find 5% by halving the value of 10%. 9 18 ÷ 2 is … 9 18 So 9 toddlers chose grey. 18

This pie chart shows the favourite colour of 180 toddlers. How many toddlers selected each colour? 5% add 10% is 15%, so to find the number of children that chose purple, you can add together the 5% and 10% values. 27 9 18 + 9 is … 27 18 So 27 toddlers chose purple. Can you think of another way of finding 15% of 180? You could multiply the 5% value by 3: 9 x 3 = 27 18

Feel ready to try some questions yourself? Try a range of the questions from PDF ‘Maths on Target pages 26 -27’. Remember to read questions carefully and to give answers in the correct format, i. e. as a number, not a percentage. If you attempt Section C, when dealing with 2 pies (Q 2), you need to consider the total value for each separate chart. Take care!
- Slides: 16