Pictograms Worksheet A The worksheet is in 2


- Slides: 9
Pictograms – Worksheet A The worksheet is in 2 sizes.
Printing To print handouts from slides Select the slide from the left. Then click: File > Print > ‘Print Current Slide’ To print multiple slides Click on a section title to highlight all those slides, or press ‘Ctrl’ at the same time as selecting slides to highlight more than one. Then click: File > Print > ‘Print Selection’ To print double-sided handouts Highlight both slides before using ‘Print Selection’. Choose ‘Print on Both Sides’ and ‘Flip on Short Edge’.
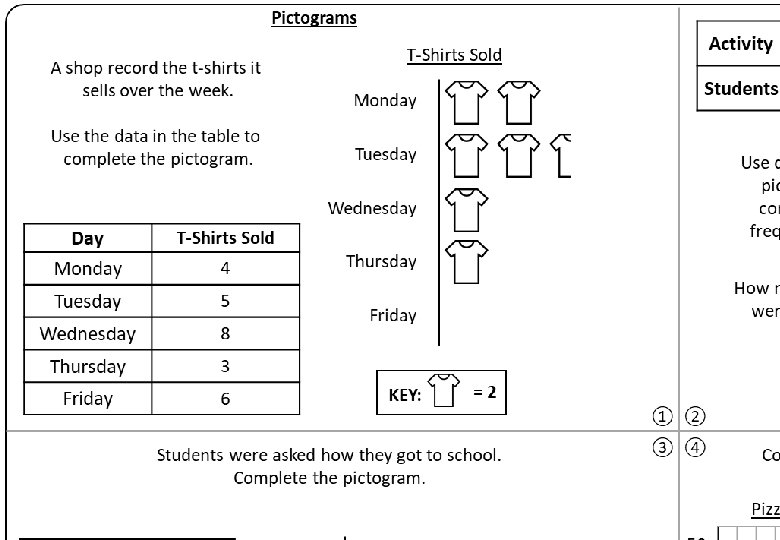
Pictograms Activity T-Shirts Sold A shop record the t-shirts it sells over the week. Use data from the pictogram to complete the frequency table. Wednesday T-Shirts Sold Tuesday 5 Wednesday 8 Thursday 3 Friday 6 Friday KEY: =2 =4 KEY: ① ② ③ ④ 10 Car 5 Cycling 30 20 Bus Did you remember a key & a title for the pictogram? 10 0 Thursday Bus 40 Wednesday 15 50 Tuesday Cycling Walking Art Convert the bar chart into a pictogram. Monday 18 Dance Drama Pizzas Sold Walking Netball How many students were surveyed? Students were asked how they got to school. Complete the pictogram. Frequency Football Thursday 4 Method Dance Drama Favourite Hobby Tuesday Day Monday Netball Students Monday Use the data in the table to complete the pictogram. Football Art
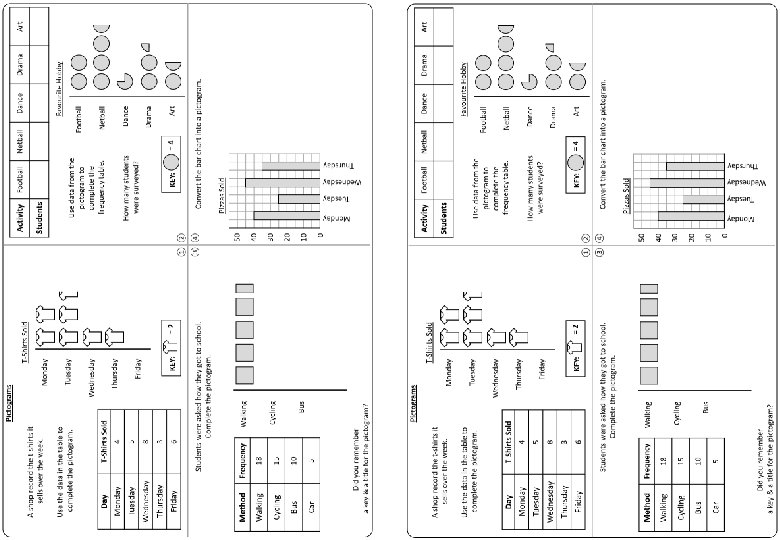
Pictograms A shop record the t-shirts it sells over the week. Use the data in the table to complete the pictogram. Activity Football Netball Dance Drama Art Students 8 14 3 9 6 T-Shirts Sold Monday Favourite Hobby Tuesday Use data from the pictogram to complete the frequency table. Wednesday Day Monday T-Shirts Sold Tuesday 5 Wednesday 8 Thursday 3 Friday 6 4 Football Netball Thursday Friday KEY: =2 ① ② How many students were surveyed? Dance 40 Drama KEY: =4 Art Half Answers
Pictograms Activity Football Netball Dance Drama Art Students 8 14 3 9 6 T-Shirts Sold A shop record the t-shirts it sells over the week. Monday Use the data in the table to complete the pictogram. Favourite Hobby Tuesday Use data from the pictogram to complete the frequency table. Wednesday Day Monday T-Shirts Sold Tuesday 5 Wednesday 8 Thursday 3 Friday 6 Friday KEY: How many students were surveyed? Dance 40 Drama =2 ① ② ③ ④ Pizzas Sold Bus 10 Car 5 30 Cycling Tuesday 20 Bus 0 Car Did you remember a key & a title for the pictogram? Wednesday 10 KEY: =4 Thursday 15 Wednesday Cycling Monday 40 Tuesday 18 Pizzas Sold 50 Walking Art Convert the bar chart into a pictogram. Monday Walking =4 KEY: How Students Travel to School Frequency Netball Thursday 4 Students were asked how they got to school. Complete the table & the pictogram. Method Football KEY: = 10
Pictograms Activity T-Shirts Sold A shop record the t-shirts it sells over the week. Use data from the pictogram to complete the frequency table. Wednesday T-Shirts Sold Tuesday 5 Wednesday 8 Thursday 3 Friday 6 Friday KEY: =2 =4 KEY: ① ② ③ ④ 10 Car 5 Cycling 30 20 Bus Did you remember a key & a title for the pictogram? 10 0 Thursday Bus 40 Wednesday 15 50 Tuesday Cycling Walking Art Convert the bar chart into a pictogram. Monday 18 Dance Drama Pizzas Sold Walking Netball How many students were surveyed? Students were asked how they got to school. Complete the pictogram. Frequency Football Thursday 4 Method Dance Drama Favourite Hobby Tuesday Day Monday Netball Students Monday Use the data in the table to complete the pictogram. Football Art
Questions? Comments? Suggestions? …or have you found a mistake!? Any feedback would be appreciated . Please feel free to email: tom@goteachmaths. co. uk