PhysicsBased Risk Assessment Why we need to bring

Physics-Based Risk Assessment Why we need to bring physics to bear on estimating natural hazard risk Kerry Emanuel Lorenz Center Massachusetts Institute of technology

Flawed Basis of Current Risk Modeling Almost all current risk assessments are based on historical statistics Historical records are flawed and short, particularly outside North America Moreover, the past 50 -150 years is a poor guide to the present owing to climate change that has already occurred Risk modelers have been slow to migrate to a physics-based approach

The quiet revolutions in numerical weather prediction and climate simulation The first computational weather forecasts were made in the mid 1950 s Today, virtually every weather forecast beyond 6 hours is based wholly or heavily on numerical weather prediction models Three-day forecasts today are as accurate as 1 -day forecasts were 40 years ago Climate models are becoming increasingly reliable in simulating such phenomena as severe winter storms, large-scale floods, droughts, and heatwaves

Evolution of forecast skill of a global numerical weather prediction model

Satellite Image Global Model

Tropical Cyclone Risk

What Are Historical Records Based On? Pre-1943: Anecdotal accounts from coastal cities and ships 1943: Introduction of routine aircraft reconnaissance in Atlantic, western North Pacific 1958: Inertial navigation permits direct measurement of wind speed at flight level 1970: Complete global detection by satellites 1978: Introduction of satellite scatterometry 1987: Termination of airborne reconnaissance in western North Pacific

Historical Records: Prior to 1970, Many Storms Were Missed Major hurricanes in the North Atlantic, 1851 -2016, smoothed using a 10 year running average. Shown in blue are storms that either passed through the chain of Lesser Antilles or made landfall in the continental U. S. ; all other major hurricanes are shown in red. The dashed lines show the best fit trend lines for each data set.

The Heart of the Problem: Societies are usually well adapted to frequent events (> 1/100 yr) Societies are often poorly adapted to rare events (< 1/100 yr) Robust estimates of the character of ~100 yr events require ~1, 000 years of data We do not have ~1, 000 years of meteorological observations

Is Hurricane Risk Changing?

Trends in Global TC Frequency Over Threshold Intensities, from Historical TC Data, 1980 -2016. Trends Shown Only When p < 0. 05.

Hurricanes are reaching peak intensity at higher latitudes Time series of the latitudes at which tropical cyclones reach maximum intensity. From Kossin et al. (2014)

Climate models cannot yet be used to make direct estimates of hurricane risk Category 3 Modeled Observed Wind Speed (meters per second) Histograms of Tropical Cyclone Intensity as Simulated by a Global Model with 30 mile grid point spacing. (Courtesy Isaac Held, GFDL) Global models do not simulate the storms that cause destruction

Using Physics to Assess Hurricane Risk Reliable, global records of coarse-scale climate are robust and widely available Cull from these datasets the key statistics known to control tropical cyclone generation, movement, and intensity evolution Bootstrap these key statistic to create unlimited synthetic time series of the hurricane-relevant environmental variables Use these to drive specialized, very high resolution physical hurricane models Extensively validate the results against historical hurricane data Exact same method can be applied to output of climate models


Cumulative Distribution of Storm Lifetime Peak Wind Speed, with Sample of 1755 Synthetic Tracks 90% confidence bounds

Atlantic Annual Cycle

Atlantic Interannual Variability Frequency Power Dissipation
")
Captures effects of regional climate phenomena (e. g. ENSO, AMM)

Example: Top 100 out of 2000 TCs Affecting Kyoto, 1981 -2000

Same, but with top 20 historical tracks

Comparison of Wind Risk Derived from Physically Modeled Events to Historical Data

Sample Kyoto track


Model produced wind fields are used to drive hydrodynamic storm surge models to estimate surge risk Model produced rain can be used to drive flood models to estimate flood risk

Storm total rainfall

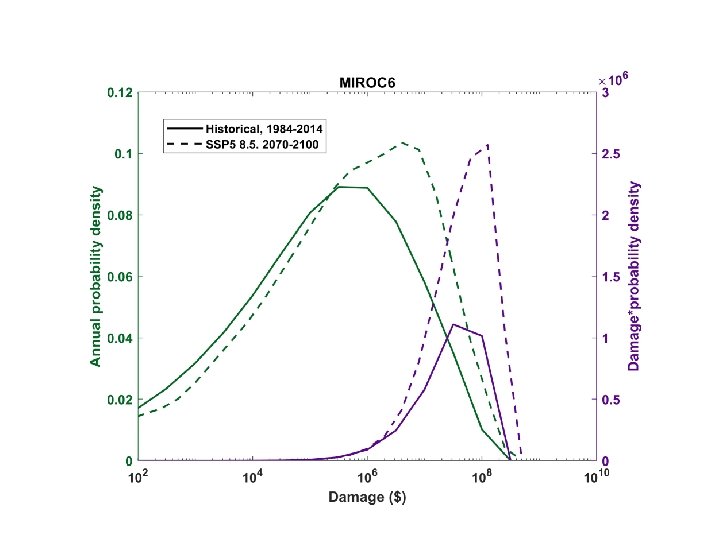
Taking Climate Change Into Account Downscale 5 CMIP 6 models for the historical period, 19842014, and for the period 2070 -2100 under Shared Socioeconomic Pathway 5 (business as usual, heavy reliance on fossil fuels, no serious attempt at mitigation. The 5 models used were • • • Canadian Ensemble Climate Model (CAN-ESM 5) GFDL-ESM 4 MIROC-6 MRI-ESM 2 -0 UKMO UKESM 1 -0 -LL Two other models that produced excessively large climate responses were downscaled but discarded for the analyses presented here

Probability of Storm Accumulated Rainfall in Harris County, from 6 Climate models, 1981 -2000, 2008 -2027, and 2081 -2100, Based on 2000 Events Each, and Using RCP 8. 5. Shading Shows Spread Among the Models.

Take-Away Points We need to move away from sole dependence on flawed historical data in assessing natural hazard risk and embrace advanced modeling techniques We can no longer regard climate change as a problem for the future; it has already tangibly affected important risks, e. g. Harvey’s rainfall was ~3 times more likely in 2017 than in 1970 Insurance industry could help catalyze insurance-relevant research in universities and government labs by creating a demand for graduates with backgrounds in physics-based risk assessment

Satellite Image Climate Model
- Slides: 32