Physics of Volatiles on the Moon Oded 1


 of Moon leads to permanent shadow in craters")
 Clementine photos taken over 1 lunar day")


 q q q Ice")


,")
 energy and gravitational (potential) energy; H")


")
")
 showed polar volatiles must be")
 Present day: 1. 5 8 4 12 Siegler et al.")


 of the North Pole. Fresh, “normal”")
 equipped with a suite of remote")
 Artifical impact in permanently shaded area")
 abundance by mass ● Many other")


 The strongest detected 3 -μm")


")
")
 Hibbitts et al. (2011):")


- Slides: 47
Physics of Volatiles on the Moon Oded 1, 2 Aharonson 1 Weizmann Institute of Science 2 California Institute of Technology With contributions from N. Schorghofer / P. Hayne
W ts ind lar me So Co Moon Asteroids I s P D M Gia ol nt ec ul ar Cl ou ds
Water Delivery to the Moon Water delivery over the age of the Solar System, before any loss processes take place (from Moses et al. , 1999) Source Interplanetary Dust Particles Meteoroids and Asteroids Jupiter-family Comets Halley-type Comets Main Belt Comets Amount Delivered to Surface 3 to 60 x 1013 kg 0. 4 to 20 x 1013 kg 0. 1 to 200 x 1013 kg 0. 2 to 200 x 1013 kg ? (potentially very large)
Lunar Orbit Low obliquity (axis tilt) of Moon leads to permanent shadow in craters at high latitude. In the past, obliquity was higher after transition between two Cassini states. The permanently shaded areas have not seen the sun for ~2 billion years.
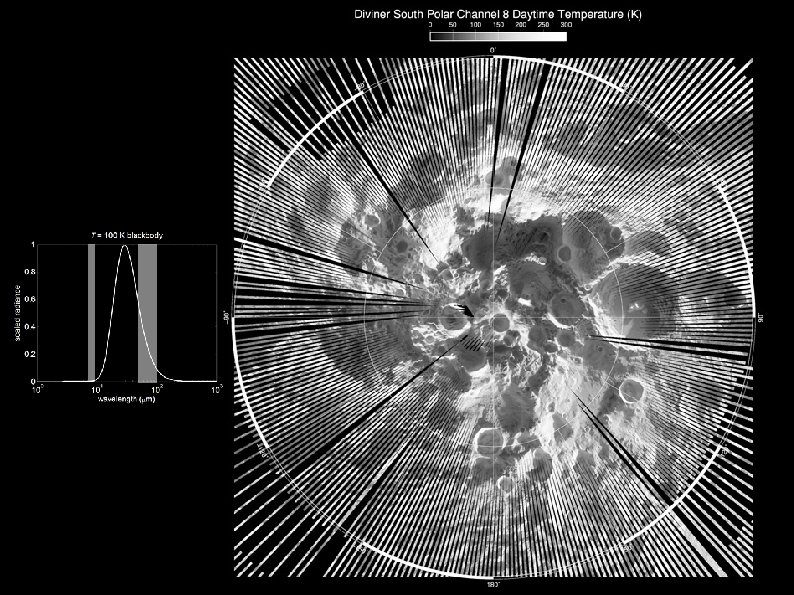
Mazarico et al. (2011) Clementine photos taken over 1 lunar day
Cold Trapping q Sublimation rates highly non-linear with temperature q Loss from sunlit areas extremely fast; shadowed areas, extremely slow
Inefficiency of Jeans Escape Maxwell-Boltzmann velocity distribution: Gravitational escape Water strongly bound to the Moon by gravity, < 10 -6 molecules escape per hop
Ice Sublimation and Lag Formation solar H 2 O (g) q q q Ice table moves downward as ice sublimates and diffuses through desiccated regolith layer Quasi-steady state can result if sources balance sinks, or if sublimation slow Depth of ice table depends on insolation, regolith composition and porosity IR emission to space conduction
Stability of Buried Ice Schorghofer, 2008
Of Snowlines Conventional Snowline: Condensation temperature of H 2 O in protoplanetary disk (145– 170 K) “Buried Snowline”: Below a mean surface temperature of about 145 K, water ice will remain within the top few meters of the surface over the age of the solar system. A variation of ± 10 K (135– 155 K) captures a large range of soil layer properties. Neither conventional nor buried snowline corresponds to an exact temperature. Also note, that buried T < conventional T.
Terminology Adsorbed water: Binding between water and another substance • Physisorption (= physical adsorption), weakly bound, van der Waals forces • Chemisorption (= chemical adsorption), strongly bound, covalent bonding, can be dissociative i. e. breaks molecule apart q Hydration (water added to crystal structure) q Ice • Crystalline, all the ice you have ever seen is in this form • Amorphous, forms only at low temperature (<~140 K) q
Classic Picture Energy is partitioned between thermal (kinetic) energy and gravitational (potential) energy; H is the height of a typical bounce of a single molecule: ½mvz 2 = ½k. T = mg. H H = k. T/(2 mg) ≈ 50 km g = surface acceleration (1. 62 m/s 2) Ballistic flights are typically ~300 km long and last ~1 minute Watson-Murray-Brown (1961) Molecules move on the day side, stop on the night side.
Lunar Water Cycle David Everett--LRO Overview 13
1. Incoming water molecules are trapped in surface defects ? Lunar Surface 2. Some are released thermally, others super -thermally by Lyman-α Non-thermal (Ly α) 3. Some super-thermal molecules are slowed down by diffusion between grains 4. Hopping with thermal and super-thermal speeds
Monte Carlo Model: Spread of initial source t=0 t=1 month t=24 hours • H 2 O molecules launched in random direction, with Maxwellian velocity components • Destruction rate 0. 4%/hop ≈ lifetime 105 s • Residence time is calculated from T and θ • Scheduling algorithm (event-driven code), processed in time order • Temperature model, 1 -D at every longitudelatitude point, time step 1 hour • Follows past models (e. g. Butler 1997, . . . ) • Initially: 1 kmol of H 2 O • Average of 100 hops until cold trapping
Dusk-Dawn Asymmetry Continuous production of H 2 O molecules at noon (by recombination of OH (Orlando et al. 2012)) More molecules at morning terminator than at evening terminator diurnal H 2 O variations would be asymmetric, contrary to observations Such an asymmetry is known for other volatiles: 20 Ne, 40 Ar (Hodges et al. 1973)
Ceres, Transport Effeciency Fraction of initially 18 t of ice that ends up at cold traps covering 0. 5% of the surface area Transport Efficiency The Moon 16% Mercury 17% Ceres 13% Like the Moon and Mercury, Ceres is able to concentrate H 2 O molecules globally into cold traps, if coldtraps exist.
Mean annual temperature Paige et al. (2010)
Paige et al. (2010)
Obliquity Effects unstable time ● Siegler et al. (2011) showed polar volatiles must be younger than the Cassini state transition (precise timing unknown), when Moon’s obliquity reached nearly 90
Mean Annual Temperature (Obliquity) Present day: 1. 5 8 4 12 Siegler et al. (2011)
OBSERVATIONS: Neutrons, Radars, and Impact 1. 2. 3. 4. 5. Neutron Spectroscopy (Lunar Prospector & LRO) Earth-based radar Bistatic radar experiment by Clementine Mini. SAR (radar on LRO) LCROSS Impact
Lunar Prospector Neutron Spectrometer maps show small enhancements in hydrogen abundance in both polar regions (Maurice et al, 2004) The weak neutron signal implies a the presence of small quantities of near-surface hydrogen mixed with soil, or the presence of abundant deep hydrogen at > 1 meter depths; 1. 5± 0. 8% H 2 O-equivalent hydrogen by weight (Feldman et al. 2000, Lawrence et al. 2006) David Everett--LRO Overview 26
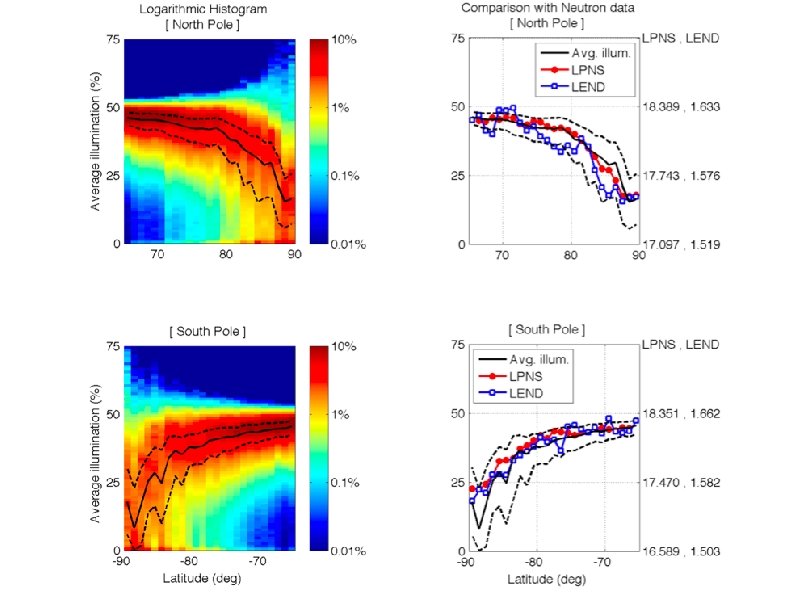
The locations of polar hydrogen enhancements are associated with the locations of suspected cold traps North Pole South Pole Cabeus U 1 Shackelton • Not all suspected cold traps are associated with enhanced hydrogen • Aside from permanent shade, the most important parameter for lunar ice stability is the flux of indirect solar radiation and direct thermal radiation David Everett--LRO Overview 28
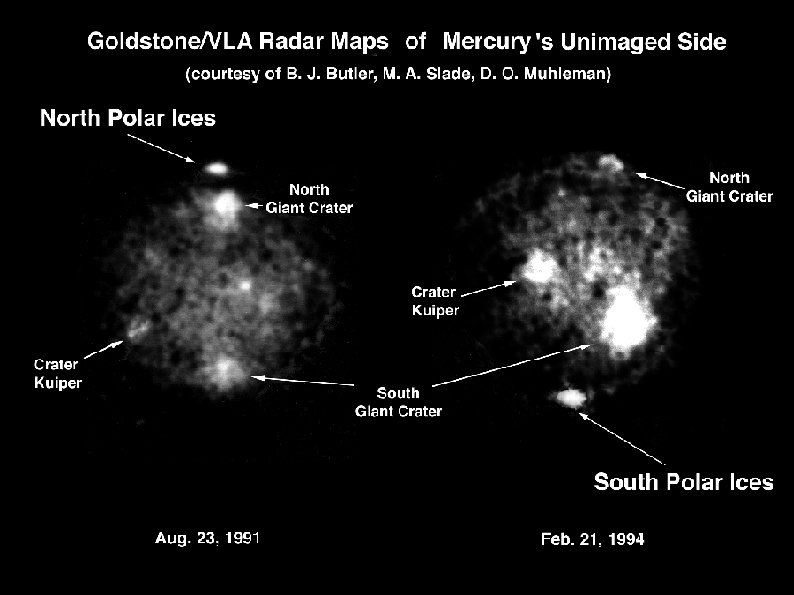
No radar evidence for the Moon
Mini-SAR map of the Circular Polarization Ratio (CPR) of the North Pole. Fresh, “normal” craters (red circles): high CPR inside and outside their rims. The “anomalous” craters (green circles) have high CPR within, but not outside their rims. Their interiors are also in permanent sun shadow. These relations are consistent with the high CPR in this case being caused by water ice.
The LCROSS Mission • LCROSS Shepherding Spacecraft (SSc) equipped with a suite of remote sensing instruments, including UV/VIS and NIR spectrometers 32
LCROSS Impact (Lunar Crater Observation and Sensing Satellite) Artifical impact in permanently shaded area (Cabeus crater); spectral observation of ejecta; Oct 9, 2009 5. 6± 2. 9% H 2 O by mass (Colaprete et al. , 2010) Also found (in order of abundance): H 2 S, NH 3, SO 2, CH 3 OH, C 2 H 4, CO 2, CH 3 OH, CH 4, OH
LCROSS Results ● Water ice ~6% ( 3%) abundance by mass ● Many other volatiles: Ca, Mg, Na ● Also mercury (don’t drink the water!), and silver (Ag, � )
LCROSS Results ● ?
Summary of Polar H 2 O Observations • Excess of 1. 5± 0. 8% H 2 O-equivalent hydrogen by weight (Feldman et al. 2000) - Lunar Prospector Neutron Spectrometer • Several % H 2 O confirmed by LEND (Mitrofanov et al, 2010) • Bistatic radar experiment by Clementine also suggested the presence of water ice (Nozette et al. , 1996). • Radar evidence for ice on both poles of Mercury; none on the Moon (thus <<100%) • LCROSS Impact: 5. 6± 2. 9% H 2 O by mass (Colaprete et al. , 2010) • Evidence from Mini. SAR
ADSORBED H 2 O AND OH Observed spectroscopically by three spacecraft 1. M 3 (Moon Minearalogy Mapper Spectrometer) on Chandrayaan-1 (Pieters et al. , 2009) 2. EPOXI flyby (Sunshine et al. , 2009) 3. Cassini flyby (Clark 2009) H 2 O = Water OH = Hydroxyl (Has also been suggested a long time ago. )
Scaled reflectance spectra for M 3 image strip (A) The strongest detected 3 -μm feature (~10%) occurs at cool, high latitudes, and the measured strength gradually decreases to zero toward mid-latitudes. At lower latitudes (18°), the additional thermal emission component becomes evident at wavelengths above ~2200 nm. (B) Model near-infrared reflectance spectra of H 2 O and OH. These spectra are highly dependent on physical state. The shaded area extends beyond the spectral range of M 3. (Pieters et al. , 2009)
Map of Water and Hydroxyl from M 3 Red = 2 -micron pyroxene absorption band depth Green = 2. 4 -micron apparent reflectance Blue = absorptions due to water and hydroxyl. (Clark et al. , 2010)
Summary ● ● ● Volatiles hop along ballistic trajectories, and H 2 O may be able to survive in cold (<110 K) permanently shaded areas near the lunar poles Significant observational evidence for ice in permanently shaded areas near both poles of the Moon; ~ several weight percent Hydroxyl and water, probably adsorbed, in polar latitudes, but— Water mobile on a timescale of a lunar day is difficult to reconcile with theory/observations
Mazarico (pers. comm. )
Mazarico (pers. comm. )
Desorption Experiments Fe-rich lunar analog glass JSC-1 A albite (feldspar) Hibbitts et al. (2011): glass is hydrophobic; other materials can chemisorb even at high temperatures
Paul G. Lucey
Diviner typically operates in “pushbroom” mode m k 4 ~ int r p t f oo Diviner Spectral Channels: • 2 solar channels: 0. 35 – 2. 8 mm • 7 infrared channels: Ø 7. 80 mm Ø 8. 25 mm Ø 8. 55 mm Ø 13 -23 mm Ø 25 -41 mm Ø 50 -100 mm Ø 100 -400 mm Diviner’s independent two -axis actuators allow targeting independent of the spacecraft 47
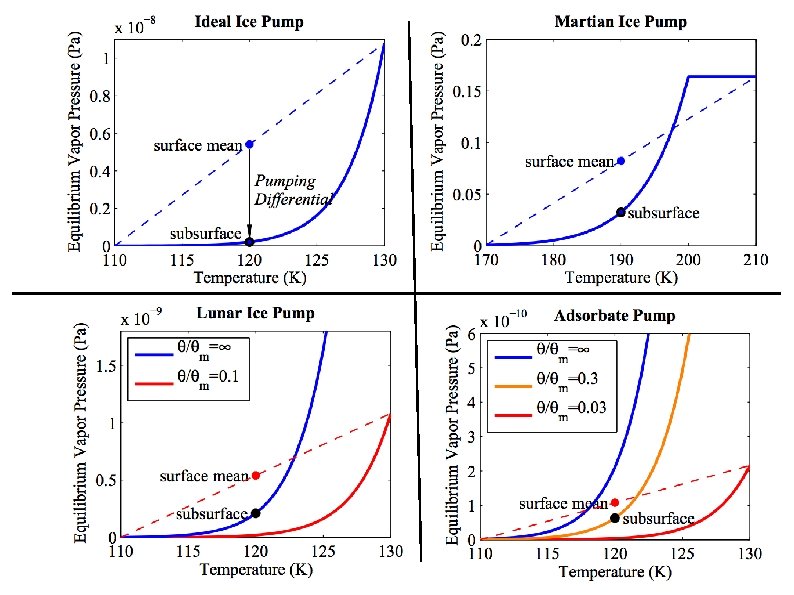
Adsorption Isotherm 15°C, lunar sample approximately reversible adsorption rate = desorption rate
Adsorption Isotherm Desorption Rate Sublimation rate of ice into vacuum: Desorption rate of adsorbed water: P 0. . . saturation vapor pressure of ice P 0(T) m. . . mass of molecule k. . . Boltzmann constant T. . . temperature θ. . . adsorbate coverage