Physical Models Used and Not Used in GNSS


- Slides: 142

Physical Models Used (and Not Used) in GNSS Data Processing Dr. Mark Schenewerk Mark. Schenewerk@noaa. gov 816 -994 -3009

Who is this guy? I am Mark Schenewerk with National Geodetic Survey (NGS). B. S. from the University of Missouri at Rolla. Ph. D. from the University of Illinois at Champaign-Urbana. The NGS calls me a geodesist, but I’m actually an astronomer who happens to do things that look like geodesy. I am the “father” of the PAGES processing software. I’ve been (very) indirectly involved in OPUS since its inception and directly involved in some of the new development for the last few years. 2011 -11 -03 2

Workshop Outline • • • • Introduction Reference frames Clock Errors PPP, DGNSS and Double-differencing Correlations Antenna Phase Center Variations Phase Wrapping Observation Elevation Weighting Charged and Neutral Atmospheric Delays Solid Earth Tide Ocean Tide, Atmosphere and Other Surface Loading Subsidence and Rebound Data Span Versus Accuracy When Good Data Goes Bad 2011 -11 -03 3

The effect on “real” data? I wanted to compliment these discussions with processing results using real data. For this, I needed a test network that: • provides a reasonable representation of the GPS hardware. • provides at some commonly encountered baseline lengths. • is reliable so that I can create time series of results sufficient for identifying problems and characteristics of the included sites and their data. • is sufficiently small thereby permitting me to process its data quickly and in a variety of ways. 2011 -11 -03 4

The Test Network I opted for 2002 -090 through 2002 -103 data from a subset of the Ohio CORS. A few other sites will be used for special cases. This network can be used to make baselines 23. 4 to 428 km. Even thousands of kilometers if the “other” sites are considered. 2011 -11 -03 5

The Test Network’s Hardware These are the site designations and antennas identifiers. SITE algo aoml nlib colb defi erla freo galb gust leba mcon pktn sidn stkr tiff woos ANTENNA -"AOAD/M_T -"TRM 29659. 00 -"ASH 700936 C_M -"TRM 29659. 00 -"LEIAT 303 -"TRM 29659. 00 -"ASH 700718 B -"TRM 29659. 00 2011 -11 -03 "; "; "; " " "; " LEIC"; " " " " IERS ITRF 2000 IERS ITRF 2000 6

Linearization Bear in mind that almost all data processing assumes that, in some regime, data can be approximated by a straight line. If the data can not be approximated in this way, the modelling error intrudes corrupting the results. 2011 -11 -03 7

Global Navigation Satellite System GNSS, the acronym for Global Navigation Satellite System(s), is a sweeping term for Global Positioning System or GPS (USA), GLONASS (Russia), Galileo (EU), Compass (China) and others to come. All these systems are broadly very similar although they differ in detail. Organizations build and launch satellites broadcasting signals that small, light, rugged, inexpensive receivers can freely use 24/7. You don’t have to do anything! That’s a great deal so it’s no surprise that GNSS technology has permeating so many aspects of our culture. 2011 -11 -03 8

GNSS Past and Future GPS and GLONASS began development in the 1970 s. Launches began in the 1980 s with at least one complete system in operation since the early 1990 s. The U. S. Department of Commerce estimates that billions of dollars of GNSS equipment are sold annual and that the total value of these systems to the users is tens of billions of dollars. www. pnt. gov/public/1997 -2004/2003 -12. . . /csis 2003 -bogosian. ppt geodesy. noaa. gov/PUBS_LIB/Socio-Economic. Benefitsof. CORSand. GRAV-D. pdf Next generation GPS and GLONASS satellites are being tested, as is Galileo and Compass technology. GNSS will be available for the foreseeable future. 2011 -11 -03 9

Let’s test the waters. As simple to use and great a value as GNSS is, if you’re willing to know a bit more, you can get better results making it a better value. That’s why we’re here, so let’s dip a toe in. Here’s how GNSS positioning works in six slides. 2011 -11 -03 10

How GNSS works in 6 slides. (1/6) A GNSS satellite passes overhead broadcasting a signal: I’m SV 1 at XYZ 1 (1) at Time 1(1). I’m SV 1 at XYZ 1 (2) at Time 1(2). I’m SV 1 at XYZ 1 (3) at Time 1(3). • • • 2011 -11 -03 11

How GNSS works in 6 slides. (2/6) At the same time, other satellites are saying: I’m SV 2 at XYZ 2 (1) at Time 2(1). I’m SV 2 at XYZ 2 (2) at Time 2(2). I’m SV 2 at XYZ 2 (3) at Time 2(3). • • • 2011 -11 -03 I’m SV 3 at XYZ 3 (1) at Time 3(1). I’m SV 3 at XYZ 3 (1) at Time 3(2). I’m SV 3 at XYZ 3 (1) at Time 3(3). • • • 12

How GNSS works in 6 slides. (3/6) Your receiver hears all this just a fraction of a second later: SV 1 said its at XYZ 1 (1) at Time 1(1), but I think it is Time. A(1). SV 2 said its at XYZ 2 (1) at Time 2(1), but I think it is Time. A(1). SV 3 said its at XYZ 3 (1) at Time 3(1), but I think it is Time. A(1). • • • 2011 -11 -03 13

How GNSS works in 6 slides. (4/6) Your receiver knows that these signals are travelling at the speed of light, c, so it starts doing a some math: c × (Time. A(1) – Time 1(1)) means I’m Range. A 1(1) from XYZ 1(1). c × (Time. A (1) – Time 2(1)) means I’m Range. A 2(1) from XYZ 2(1). c × (Time. A (1) – Time 3(1)) means I’m Range. A 3(1) from XYZ 3(1). • • • 2011 -11 -03 14

How GNSS works in 6 slides. (5/6) If your receiver has enough ranges, then it can compute its position: XYZA(1) at time Time. A(1). Repeat ad nauseum. 2011 -11 -03 15

How GNSS works in 6 slides. (6/6) Now you have a choice. You can have the receiver report is position moment by moment, i. e. kinematic, or average its results over time, static, giving a more accurate position. 2011 -11 -03 16

It’s simple, but not quite that simple. We all know that it is not quite that simple, but that covers the basics: 1) Satellites carrying clocks orbit the Earth broadcasting their positions with a time tag. 2) A specially designed receiver with a clock captures the time-tagged positions from some or all satellites. 3) Using these observations and some knowledge about physical world, the receiver can compute its position instantaneously or as a time-averaged mean. If that didn’t scare you off, then let’s jump into the deep end and get some important, but boring stuff out of the way. 2011 -11 -03 17

GNSS Carrier Frequencies Focusing on the two operating systems for the time being: GPS and GLONASS. Both broadcast on two carrier frequencies GPS: 1575. 42 MHz (19. 03 cm wavelength) 1227. 60 MHz (24. 42 cm wavelength) GLONASS: 1602. 00 MHz (18. 71 cm wavelength) 1246. 00 MHz (24. 06 cm wavelength) Common jargon identifies these as the L 1 and L 2 GPS and GLONASS frequencies. 2011 -11 -03 18

GNSS Signals The carrier frequencies carry information. GPS: A digital signal that identifies the satellite, Course Acquisition and Precise time information plus other information about the positions of and clock corrections for itself and sister satellites. GLONASS: A slight frequency shift that identifies the satellite and a digital signal containing Course Acquisition and Precise time signals, and other information about the frequency offsets, positions of and clock corrections for itself and sister satellites. 2011 -11 -03 19

Pseudoranges The Course/Acquisition or C/A code offers low precision, but is a quick way to begin interpreting the Precision or P code. Correctly interpreting these codes gives the time the signal was transmitted. Knowing the transmit and receipt times means the receiver can compute a range to the satellite. Range = c × (Time(receipt) – Time(transmit)) But these ranges still contain unmodelled clock errors (we’ll talk about this in a bit) and so are called pseudoranges to help distinguish their character. 2011 -11 -03 20

Broadcast Message The satellite positions, clock corrections and a few other items are also encoded on the GNSS signal. Collectively, these are called the broadcast message. As we’ve seen with our simple example, the time signals plus the broadcast message are everything a receiver needs to compute ranges to the satellites and determine its position. 2011 -11 -03 21

Phases The receiver also tracks the phase of the carrier signal. Measuring the phase of the carrier frequency can be done at a small fraction of a wavelength. This means that phase measurements have the potential to be significantly more precise than pseudorange measurements. 2011 -11 -03 22

Integers But the receiver doesn’t know how many wavelengths can “fit” in the distance between itself and the broadcasting satellite. It only knows how many have passed since it began tracking. Without knowing these integer wavelength counts, or more simply integers, the receiver can’t use the phase directly for ranging to the satellites. Determining the integers requires external information, time spent continuously observing a satellite or both. 2011 -11 -03 23

How do I get all these observations? Folks don’t need to in most cases, but it is possible to use this information after the fact to compute positions even more accurately. This is called post-processing. To facilitate post-processing, receivers can produce files with this observation information. There are numerous formats for this information. The one most commonly used for highprecision post-processing and the only one mentioned here is called the RINEX or Receiver INdependent EXchange format. igscb. jpl. nasa. gov/igscb/data/format/ 2011 -11 -03 24

A Quick Summary The satellites broadcast L 1 and L 2 signals. From these signals, the receiver can compute or measure the L 1 and L 2 pseudoranges and phases. With the pseudoranges and the broadcast message, a receiver can determine its position with limited accuracy. With other information it can compute its position more accurately or you can do so after the fact in post-processing. With the phases, integers and the broadcast message or other information, the receiver can compute its position still more accurately or you can do so after the fact in postprocessing. 2011 -11 -03 25

The Celestial and Terrestrial Frames Because GNSS involves satellites tracked by ground stations, GNSS data processing must be expressible and consistent in two spatial frames: ● the celestial or inertial frame, and ● the terrestrial or Earth-centered, fixed (ECF) frame. But what does this jargon really mean? 2011 -11 -03 26

The Celestial Frame The celestial frame describes the Earth as it looks from far above. In this frame we, the observers, watch our world rotate as it orbits around the Sun. The Moon travels with the Earth and completes its orbit in a little less than a month. Likewise, the GNSS satellites travel with the Earth orbiting it twice per day. The equations describing the motions and interactions of these bodies are much simpler in this frame. nssdc. gsfc. nasa. gov/image/planetary/earth/gal_earth_moon. jpg 2011 -11 -03 27

The Terrestrial Frame The terrestrial frame describes the Earth as looks to an observer on the Earth’s surface. In this frame, the Earth appears stationary while the Sun, Moon and satellites pass overhead. This is in the frame that we “see” every day. And it is in this frame we ask questions like what are the coordinates of this point? What are the distances and directions to other points? How fast is this point moving relative to other points? apod. nasa. gov/apod/image/0906/moonrise_sisman_orig. jpg 2011 -11 -03 28

Celestial and Terrestrial Link The connection between these two frames is dominated by stable processes. The Sun, Earth, Moon and satellites seem to move in the same way day after day. But if we look more closely, other processes are involved too. Our irregular, slightly flattened Earth suffers ● Precession. ● Nutation. ● Changes in its rate of spin. ● Changes in the orientation of its spin axis. These motions are expressed as 6 x 6 rotation matrices (position and velocity) and are the link between the terrestrial and celestial frames. 2011 -11 -03 29

Celestial and Terrestrial Frames The connection between these two frames is dominated by stable processes. The Sun, Earth, Moon and satellites seem to move in the same way day after day. But if we look more closely, other processes are involved too. Our irregular, slightly flattened Earth suffers ● The gravitational attraction of the Sun, Moon and planets cause the Precession. ● spinning top that is the Earth to precess, or slowly wobble, just as a Nutation. ● toy top does under the influence of the Earth's gravity. The Changes in its rate of spin. ● magnitude of this change is about 20 arcsec (620 meters) per year, Changes in the orientation of the its spin axis. but very stable and very accurately modelled. These motions are expressed as 6 x 6 rotation matrices (position and velocity) and are the link between the terrestrial and celestial frames. 2011 -11 -03 30

Celestial and Terrestrial Frames The connection between these two frames is dominated by stable processes. The Sun, Earth, Moon and satellites seem to move in the same way day after day. But if we look more closely, other processes are involved too. Our irregular, slightly flattened Earth suffers ● Precession. ● The gravitational attraction of the Sun also slowly precesses the Nutation. ● Moon's orbit. This variation in the Moon's orbit in turn causes a Changes in its rate of spin. ● variation in the orientation of the rotation axis of the Earth. This Changes in the orientation of the its spin axis. variation is called nutation and has an amplitude of about 9 arcsec (270 meters). Nutation is very accurately modelled. These motions are expressed as 6 x 6 rotation matrices (position and velocity) and are the link between the terrestrial and celestial frames. 2011 -11 -03 31

Celestial and Terrestrial Frames The connection between these two frames is dominated by stable processes. The Sun, Earth, Moon and satellites seem to move in the same way day after day. But if we look more closely, other processes are involved too. Our irregular, slightly flattened Earth suffers ● Precession. ● Nutation. ● The Earth's rate of spin, the largest of these effects, is slowing down Changes in its rate of spin. ● because of tidal friction. Think about this for a moment and you’ll Changes in the orientation of the its spin axis. realize this implies our Length Of Day (LOD) is slowly increasing, but the effect is so small that, at worst, we might notice the These motions are expressed as 6 x 6 rotation matrices (position occasional news stories about leap seconds inserted into Universal and velocity) and are the link between the terrestrial and celestial Coordinated Time (UTC). Broadly, the rate of change is a constant, frames. but slight and unpredictable variations occur (the definition of mathematical chaos). 2011 -11 -03 32

Celestial and Terrestrial Frames The connection between these two frames is dominated by stable processes. The Sun, Earth, Moon and satellites seem to move in the same way day after day. But if we look more closely, other processes are involved too. Our irregular, slightly flattened Earth suffers ● Precession. ● Nutation. ● Changes in its rate of spin. ● Terms describing other variations in the orientation of the spin axis of Changes in the orientation of the its spin axis. the Earth are called Earth Orientation Parameters (EOP). EOP is now known to be a "catch all" for several physical phenomena These motions are expressed as 6 x 6 rotation matrices (position including ocean and atmospheric currents, seasonal movement of and velocity) and are the link between the terrestrial and celestial water between the northern and southern hemispheres, changes in frames. surface water reservoirs, etc. . These variations are typically about 0. 5 arcsec (15 meters) or less, but change chaotically from day to day. 2011 -11 -03 33

Where do we get this information? The International Astronomical Union (IAU) defines the connection between the celestial and terrestrial frames. For GNSS processing, the IAU precession and nutation models are more than adequate, but because of those pesky chaotic variations, the EOP and LOD require actual measurements. Formally, the U. S. Naval Observatory (USNO) is responsible for EOP and LOD measurements for the United States. In turn, the USNO collaborates with a global community represented by the International Earth Rotation and Reference Systems Service (IERS). The IERS and its contributing members provide “first look” EOP and LOD daily, and refined parameters several times per week. 2011 -11 -03 34

Terrestrial Reference Frames As we all know, there are many terrestrial reference frame definitions. Although each is valid in its context, accuracies can vary and there may be inconsistencies between frame definitions. We’ll briefly discuss five: ITRF and IGS, WGS 84, PZ-90 and NAD 83. One point to keep in mind is that the definition of any terrestrial frame is inherently a bootstrapping process. Repeated observations from a point are necessary for accurate coordinates and years of observations from a point are necessary to determine a velocity comparable in accuracy to the coordinates. 2011 -11 -03 35

International Terrestrial Reference The ITRF, produced by the IERS, is the “gold standard” of terrestrial Frame reference frames. It is the most internally consistent and accurate. As we’ll see, it also is effectively the reference frame of GNSS. Contributing sources include: ● Very Long Baseline Interferometry (VLBI) ● Satellite Laser Ranging (SLR) ● GNSS ● DORIS ● Conventional surveys for connections between techniques. ● Historically, others have been included. The latest realization, the ITRF 2008, was released in May 2011. Information about, lists of coordinates and velocities, and transformations to previous realizations can be found at www. iers. org. 2011 -11 -03 36

The ITRF And The IGS The sources contributing to the IERS products are communities unto themselves with their own bureaucracy and products. The International GNSS Service (IGS) is the organization for the GNSS community. The IGS operates mail and informational services, format standards, models and so forth. The IGS has also organized a global GNSS tracking network. From this, it produces satellite ephemerides, EOP and reference frames. In conjunction with the release of the ITRF 2008, the IGS released the IGS 08, a GNSS-only expression of the ITRF 2008. All IGS products have been recreated so as to be consistent with the IGS 08 including GNSS ephemerides and antenna models. Information about the IGS 08 can be found at the IGS igscb. jpl. nasa. gov. I would suggest starting with IGSMAIL‐ 6354, ‐ 6355 and ‐ 6356, all dated 2011‐ 03‐ 07. 2011 -11 -03 37

World Geodetic System 1984 The WGS 84 was developed to provide accurate geodetic data for the Department of Defense (Do. D). The WGS 84 remains the formal reference system for GPS. Around 1988, the WGS 84 reference frame was redefined to be consistent with the ITRF. Although some fundamental differences between the WGS 84 and the International Terrestrial Reference System (ITRS): gravity field representation and reference ellipsoid are examples, the associated reference frames are very similar. A technical report describing the WGS 84 can be found at earth‐info. nga. mil/Gand. G/publications/ 2011 -11 -03 38

Parametrop Zemp 1990 PZ-90 is the datum for Russian geodetic activities, including the reference frame for GLONASS products. Essentially it is the WGS 84 of Russia. Historically, there have been non-trivial differences between PZ-90 and ITRF or ITRF. In 2007, however, the definition was updated bringing PZ-90. 02 into much closer agreement with the ITRF. Like WGS 84, fundamental differences remain between the systems, but for crude, hand-held uses, these PZ-90. 02 should adequately similar to ITRF and WGS 84. The IGS produces GLONASS products similar to its products for GPS. These IGS GLONASS products are in the IGS frame thereby eliminating many of the inconsistencies that would plague postprocessing. 2011 -11 -03 39

North American Datums The North American Datums are expressions of a terrestrial frame fixed to the North American plate defined and maintained by NGS. Beginning with the North American Datum of 1983, or NAD 83, space geodetic observations, e. g. VLBI, SLR, GPS, etc. , have been included in the definition of the frame much like the ITRF. Therefore, there is good agreement between the NAD 83 and ITRF. These coordinates and velocities, tools for transforming between frames and much more available at the NGS web site: geodesy. noaa. gov. 2011 -11 -03 40

NAD 83 (2011) NGS used its contribution to the IGS 08 plus additional processing to produce IGS 08 coordinates and velocities for the Continuously Operating Reference Station (CORS) network. From this, improved CORS coordinates and velocities in the NAD 83 frame were defined. To distinguish this from earlier realizations, this reference frame is called the NAD 83 (2011). This is not a new datum: the origin, scale and orientation are the same as in the previous realization. In September 2011, NGS formally released IGS 08 and NAD 83 (2011) coordinates and velocities for the CORS. Information about the IGS 08 and NAD 83 (2011) can be found at geodesy. noaa. gov/CORS/coords. shtml. 2011 -11 -03 41

Horizontal Differences In CORS Positions Horizontal difference in positions of NAD 83(2011) epoch 2002. 00 minus NAD 83(CORS 96) epoch 2002. 00. 2011 -11 -03 42

Vertical Differences In CORS Positions Vertical difference in positions of NAD 83(2011) epoch 2002. 00 minus NAD 83(CORS 96) epoch 2002. 00. 2011 -11 -03 43

NAD 83 (2011) And OPUS The Online Positioning User Service (OPUS) also began offering results in the IGS 08 and NAD 83(2011) reference frames in September 2011. Although the NAD 83 (2011) is not a new datum, the CORS coordinates used by OPUS in generating its results are different. NGS recognizes that this change poses a challenge for some. To help those users confidently switch to the new references frames, OPUS users can choose to have their results reported in the IGS 08 and NAD 83(2011) or in the previous ITRF 2000 and NAD 83 (CORS 96). But users are strongly encouraged to switch to the improved datum as soon as possible. This transition period will end after a few months. A short FAQ about this change can be found on the OPUS page: geodesy. noaa. gov/OPUS/. 2011 -11 -03 44

NAD 83 (2011) And Passive Control Marks In addition, 80, 000+ passive control marks are being readjusted to provide the best possible consistency with the improved CORS coordinates and velocities. Known as the National Adjustment of 2011 (NA 2011), these results will be released by the end of 2011. A new hybrid geoid model (likely named GEOID 12) is being produced too and will be released shortly after or in conjunction with the NA 2011 results. For more information, visit geodesy. noaa. gov/web/news/NA 2011_Project. shtml geodesy. noaa. gov/web/surveys/NA 2011_FAQ. shtml 2011 -11 -03 45

Time Systems There are several related time systems specific to the celestial or terrestrial frame used in GNSS processing. Fortunately, these are effectively buried in the physical models implemented in the software and will not be discussed here. But two are readily visible and warrant definitions at least. GPS time (GPST), the time system of GPS, is defined by the Do. D’s space control segment and USNO. Its connections to other time systems are defined by documents on the Do. D and USNO web sites. GLONASS time, effectively UTC(SU), is the time system of GLONASS as defined by their Federal Space Agency. 2011 -11 -03 46

Clock Errors We’ve seen that all GNSS data are, essentially, timing data. Let’s think about this for a moment. We’re talking about measuring distances based upon timing signals travelling at the speed of light: 3 × 10⁸ m/s. This means that clock errors become position errors. 1 nanosecond = 1 ns 1 microsecond = 1 μs 1 millisecond = 1 ms = 1 × 10 -9 s = 1 × 10 -6 s = 1 × 10 -3 s = 30 cm error. = 300 km error. All clocks have errors so they are unavoidable, but hardware and data processing techniques and can mitigate their effect. 2011 -11 -03 47

Good Clocks And Not‐so‐good Clocks The best clocks are called atomic clocks. They are wellbehaved with slow, linear drift. Unfortunately, these clocks are expensive, require monitoring and power. That’s OK for a few specialized uses like the GNSS satellites, but they are not practical for day-to-day activities. There are intermediate quality clocks and clock systems that improved themselves based upon a “connection” to a good clock, but these mean more hardware to carry around or require a wireless or Internet connection to function. So most receivers rely on hardy, inexpensive crystal clocks. These demonstrate stability over short time spans making them more than adequate for basic positioning, but lack the stability required for high-precision. 2011 -11 -03 48

Satellite Clocks The GNSS satellites carry high quality atomic clocks that are carefully monitored and controlled. Under normal circumstances, satellite clock errors are small (nanosecond) and well behaved. The GNSS signal carries information about the satellite clock errors derived from data taken at dedicated ground tracking sites. This information can be used to further reduce these errors. The most common corrective technique is differencing (we’ll discuss this in few more slides), but some organizations do provide satellite clock corrections suitable for some applications. 2011 -11 -03 49

Receiver Clock Errors As we’ve mentioned, almost all receivers use internal crystal clocks. These are more than adequate for their primary purpose of stand-alone positioning, but almost always the largest error source in higher accuracy positioning. To improve a receiver clock’s performance, many types of receivers can be instructed to steer their clocks to better match the time provided by the GNSS. And there are techniques like differencing (almost there) to remove receiver clock errors. 2011 -11 -03 50

Receiver Clock Errors In The Wild This figure the shows the drifts of several receiver clocks. The drao and rbut clocks are well behaved. gtrg is adequate, but data from the end of the day might need to be discarded because clock drift has the become large. ahid is usable but with caution because of its non-linear drift. A receiver clock with greater variability than ahid should probably be considered unusable. 2011 -11 -03 51

Differencing To end the discussion of clock errors, we’ll introduce differencing and its advantage in removing clock or any common mode errors. A crude algebraic argument shows the benefits of this technique. The following equation describes a GNSS observation. It could be pseudorange or phase. O 1 A = D 1 A + OE 1 A + ce 1 where O 1 A D 1 A is the observation of satellite 1 from receiver A. is the uncorrupted data. OE 1 A is other effects not considered here. ce 1 is the satellite 1 clock error. ce. A is the receiver A clock error. 2011 -11 -03 52

Single‐Differencing If another satellite is observed at that same epoch. . . O 1 A = D 1 A + OE 1 A + ce 1 O 2 A = D 2 A + OE 2 A + ce 2. . . then we can subtract one observation from the other creating a single-difference. (O 1 A − O 2 A) = (D 1 A − D 2 A) + (OE 1 A − OE 2 A) + (ce. A − ce. A) + (ce 1 − ce 2) 2011 -11 -03 53

Single‐Differencing Because the observations were taken at the same time from the same receiver, the receiver clock error must be identical. (O 1 A − O 2 A) = (D 1 A − D 2 A) + (OE 1 A − OE 2 A) + (ce. A − ce. A) + (ce 1 − ce 2) Thus, the receiver clock error, probably the largest error, can be eliminated with a little math. Before we move on, let’s simplify the symbology a little bit. O 1 -2 A = D 1 -2 A + OE 1 -2 A + ce 1 -2 The 1 -2 superscript indicates this is a between-satellite difference. 2011 -11 -03 54

Where to from here? Oα-βA = Dα-βA + OEα-βA + ceα-β Now that the receiver clock error has been removed, several viable methods for computing positions are open to us: • Point Positioning or Precise Point Positioning (PPP). • Differential GNSS (DGNSS). • Double-differencing. 2011 -11 -03 55

PPP Most of the other effects, OEα-βA, have very good models. And organization like the IGS distribute satellite clock corrections. With this information we can turn this into this Oα-βA = Dα-βA + OEα-βA + ceα-β small zero Oα-βA = Dα-βA + (OEα-βA – MODELα-βA)+ (ceα-β – MEASUREDα-β ) Rewriting Oα-βA = Dα-βA + oeα-βA 2011 -11 -03 56

PPP Oα-βA = Dα-βA + oeα-βA Now we essentially have uncorrupted data, Dα-βA, with a few nagging but small, unmodelled effects, oeα-βA, that can be ignored or averaged away or estimated as part of the position solution. 2011 -11 -03 57

PPP Pros and Cons Pros: • Can produce centimeter accuracies. • Can work with a single receiver. • Can work with kinematic or static data. Cons: • Requires external information for higher accuracies. • Requires really good and complete models for centimeter accuracy. • Requires at least a short period of time to initialize the unmodelled effects and integers for higher accuracies. 2011 -11 -03 58

DGNSS Suppose you have two receivers sort of close to each other: one at an unknown location we’ll identify as A, and one at a very well known location identified as R. Of course that means if you have two sets of data Oα-βA = Dα-βA + OEα-βA + ceα-β and 2011 -11 -03 Oα-βR = Dα-βR + OEα-βR + ceα-β 59

DGNSS We know R’s position so we can turn the problem around for that receiver. We can compute what the value of the uncorrupted data should be, we’ll call this computed data value Cα-βR, then use Cα-βR to compute the other effects and errors every epoch. zero Oα-βR − Cα-βR = Dα-βR − Cα-βR + OEα-βR + ceα-β or Oα-βR − Cα-βR = OEα-βR + ceα-β Rewriting correctionα-βR = OEα-βR + ceα-β 2011 -11 -03 60

DGNSS If we can do the computations for receiver R fast enough and get those results to receiver A, we have Oα-βA − correctionα-βR = Dα-βA + (OEα-βA − OEα-βR) + (ceα-β − ceα-β) Now, remember that in our original hypothesis we stated that the receivers were “sort of close. ” We can demonstrate (we won’t but I don’t think it’s too hard to believe) that receivers that are “sort of” close suffer effects that are “sort of” similar. So small zero Oα-βA − correctionα-βR = Dα-βA + (OEα-βA − OEα-βR) + (ceα-β − ceα-β) or Oα-βR − correction α-βR = Dα-βA + oeα-βA-R 2011 -11 -03 61

DGNSS Here again, we essentially have uncorrupted data, Dα-βA, with a few nagging but small, unmodelled effects, oeα-βA-R , that can be ignored or averaged away or estimated as part of the position solution. Oα-βR − correction α-βR = Dα-βA + oeα-βA-R Graphically, this looks something like: REFERENCE UNKNOWN − 2011 -11 -03 DGNSS = 62

DGNSS Pros and Cons Pros: • For the person in the field, it is simple. • Can produce centimeter accuracies. • Can work with kinematic or static data. Cons: • Requires a reference receiver or network of receivers. • Requires a communication link to the reference. • Errors in the reference propagate into the other’s position. • The purely local effects are often but not always minimized. 2011 -11 -03 63

Double‐Differencing Double-differencing development should seem a little familiar now. In this case, assume we have one receiver at an unknown location we’ll designate A, and a second receiver, designated B, is observing at the same time from a known or knowable location. Again, we’ll have two data sets. Oα-βA = Dα-βA + OEα-βA + ceα-β and Oα-βB = Dα-βB + OEα-βB + ceα-β We’ll create a second difference, or double-difference by subtracting single-differenced observations from B from the corresponding single-differenced observations from A. In this case, B is often called the reference. (Oα-βA- Oα-βB) = (Dα-βA − Dα-βB) + (OEα-βA − OEα-βB) + (ceα-β − ceα-β) 2011 -11 -03 64

Double‐Differencing Now the satellite clock errors must be identical because they are from the same two satellites observed at the same time. zero (Oα-βA- Oα-βB) = (Dα-βA − Dα-βB) + (OEα-βA − OEα-βB) + (ceα-β − ceα-β) or (Oα-βA- Oα-βB) = (Dα-βA − Dα-βB) + (OEα-βA − OEα-βB) Again combining terms: Oα-βA-B = Dα-βA-B + oeα-βA-B where A-B identifies the between-receiver difference and α-β identifies the between-satellite difference. 2011 -11 -03 65

Double‐Differencing Pros And Cons Pros: • Simple. • Clock errors are removed completely. • Can work with kinematic or static data. • All common mode signals are removed. Cons: • Requires a second receiver. • Invariably done in post-processing. • The remaining errors result in a noisier observable. • All common mode signals are removed. 2011 -11 -03 66

Correlations I doubt the concept of correlations is a new to you. When we say two things are correlated we mean that something affecting one will also affect the other. From data processing or some other form of evaluation, we can give a correlation a numerical value from +1 to − 1 where: +1 means they are perfectly positively correlated. 0 means there is no correlation between them. − 1 means they are perfectly negatively correlated. 2011 -11 -03 67

Correlations Thinking broadly about GNSS data processing and correlations we can make some reasonable assumptions. • The computed position for our site is probably correlated to the satellite positions. • Single-differencing probably introduces correlations between satellites. • DGNSS and double-differencing probably introduces correlations between sites. • In some specialized cases, these correlations may be negligible, but they are not generally. 2011 -11 -03 68

Correlations Looking at our demonstration network, let’s say we’re going to compute the positions of the rest of the network relative to colb. In other words, we’re using colb as the reference in our processing. Then all observations used to compute positions also contain data from colb and anything affecting the data from colb could affect all the positions computed. 2011 -11 -03 colb leba galb erla 69

Correlations Looking at the network more closely, we might guess that leba, galb and erla might be more strongly correlated because they are relatively closely spaced and all are similarly oriented with respect to colb leba galb erla 2011 -11 -03 70

Correlations In fact, all of our previous assumptions are true including our assumption that correlations introduced by how we process the data are significant. Fortunately, there are numerical techniques to account for correlations. In PAGES for example, the double-difference processing software used by NGS, Milbert (Bull. Geod. , 59(1), 71 -80) designed a software process to correct for these doubledifference correlations. We call this double-difference decorrelation. 2011 -11 -03 71

Correlation Effects Upon Positions This double-difference decorrelation is always used in PAGES by default, but was designed so that it could be turned off for testing purposes. Taking advantage of this option, we can see the impact of correlations in our demonstration network. The table below summarizes the repeatabilities (how closely the computed position for a site repeat with multiple occupations) on average for the entire network. 3 hours HOR VER 0. 85 1. 37 1. 04 1. 91 2011 -11 -03 24 hours HOR VER DESCRIPTION 0. 23 0. 42 decorrelation on 0. 30 0. 56 decorrelation off 72

Correlation Effects Upon Positions These values are the population standard deviation. All values are in centimeters. “ 3 hours” indicates that only three hours of data were used to compute the positions. Note: • The scatter in the vertical is larger than the horizontal. • More data helps (more on data span versus repeatability later). 3 hours 24 hours HOR VER DESCRIPTION 0. 85 1. 37 0. 23 0. 42 decorrelation on 1. 04 1. 91 0. 30 0. 56 decorrelation off 2011 -11 -03 73

Antenna Models We want GNSS to be simple. Part of that simplicity is the GNSS antenna’s ability to view the “whole sky” at once. Fortunately, very simple antennas like small patches of a conductive material, give a “whole sky” view. Unfortunately, such antennas respond differently to signals coming face-on than to those coming from the side. 2011 -11 -03 74

Antenna Models If the projection of the shape of the antenna can make the antenna act less than perfect, so too can physical effects like variations in material and manufacture, and the necessary physical contact of the antenna to its mount. Perfect 2011 -11 -03 Ideal Real 75

Antenna Models This variation in antenna response will corrupt a GNSS position measurement. Most often, it corrupts the height component of that measurement. If we do not correct for this effect or use a specialized processing strategy, we effectively insure systematic errors in our results. Repeatable errors as large as 10 cm have been seen in these cases. Fortunately, antenna phase center variations (PCVs) are repeatable and measurable. Using the appropriate PCV model can make an antenna seem as if it were nearly perfect. 2011 -11 -03 76

Measuring Antenna Model PCOs And PCVs NGS has measured the PCVs of dozens of antennas with respect to a standard AOA Dorne Margolin T antenna (top). geodesy. noaa. gov/ANTCAL/ More recently, NGS an other groups, such as Geo++, have used a robotic arm to rapidly change the orientation of the antenna resulting in absolute PCVs (bottom). www. geopp. de/ 2011 -11 -03 77

Measuring Antenna Model PCOs And PCVs These measurements reference an agreed upon point on the antenna, the antenna reference point or ARP, to which the offset from a benchmark or other monument can be made. They include the phase center offsets, or PCOs, a mythical point at which a perfect version of this antenna would seem to rest, and the associated PCVs. geodesy. noaa. gov/ANTCAL/Files/summary. html 2011 -11 -03 78

Where do we get the antenna models? The NGS web site, geodesy. noaa. gov/ANTCAL/, contains information about completed and on-going antenna measurements. This site mentions an older format, but the ANTEX format (igscb. jpl. noaa. gov/igscb/station/general) is the current standard for distributing PCOs and PCVs. Many of these measurements are include in the IGS antenna model file that can be found at igscb. jpl. nasa. gov/igscb/station/general/. 2011 -11 -03 79

Final Thoughts About Antenna Models The current generation of antennas have elevation dependence but little azimuth dependence in their PCVs. Even so, it is important to follow the antenna orientation recommendations of the manufacturer. The PCOs and PCVs of a given antenna design are unique to that design, but repeatable across all manufactures of that design. For example, all T-type choke ring antennas behave very similarly regardless of manufacturer. 2011 -11 -03 80

Final Thoughts About Antenna Models Results do degrade when using relative PCVs, but large (continent spanning) distances between receivers are necessary to detect this. Worst-case-errors ≤ 1 cm is the rule in typical circumstances (Gendt, IGSMAIL-5438). For a typical survey, choosing to use absolute or relative antenna model won't matter provided only relative or only absolute corrections are used consistently within a project. Any errors are essentially common mode errors and will “difference away” when measuring one point relative to another. 2011 -11 -03 81

Final Thoughts About Antenna Models Remember that the Earth is the ultimate groundplane. If one sets their GNSS antenna too close to the surface of the Earth, the Earth and antenna interact changing the E-M character of the antenna. In other words, mount your antenna to close to the ground and the antenna model won’t be right. Fortunately, this effect appears to be negligible when the antenna is more than a meter above the ground, so this is not a serious consideration for most surveys. 2011 -11 -03 82

Phase Wrap Electro-magnetic (EM) radiation, including radio, does act like a wave. We draw it like ocean waves (black line), but it actually oscillates between an electric field (purple) and a magnetic field (green). E 2011 -11 -03 M 83

Phase Wrap As the EM radiation interacts with your antenna, it appears to rotate from one orientation to the next. Almost as if the wave were spiralling down to your antenna. This makes possible a quirky effect. If you rotate your antenna, it will seem as if it is “screwing” itself into the signal changing the apparent integer number of wavelengths between the antenna and changine the computed position of the antenna. E 2011 -11 -03 M 84

Phase Wrap Effects Upon Positions Neat, but why mention it? As the satellites move during observation, they can appear to “rotate” around your equipment introducing phase wrap. If this is not corrected, it introduces a time dependent offset in your computed position. Rarely is it more than a partial wavelength, but can amount to several centimeters. 2011 -11 -03 85

The Ionosphere The GNSS signal is changed as it traverses the atmosphere. We'll discuss two atmospheric layers for which corrections are applied: the charged and neutral atmosphere. The charged atmosphere is comprised of the upper layers of the atmosphere. As a group, we call these the ionosphere. These layers are ionized by exposure to solar radiation and wind. Their height above the Earth’s surface can vary depending upon, solar activity, variations in the Earth's magnetic field and mass motions in the atmosphere. www. windows. ucar. edu/spaceweather/images/atmos_layers_new_gif_image. html 2011 -11 -03 86

The Ionosphere There are several patterns of variability in the ionosphere. • There is an 11 year cycle driven by our Sun's natural variability. We are now moving into a solar maximum. www. sec. noaa. gov 2011 -11 -03 87

The Ionosphere • There is a diurnal cycle driven by direct radiation from the Sun. Diurnal activity peaks near and follows the sub-solar point on the Earth. These figures show the total electron count at about 2: 30 AM and 2: 00 PM CDT on April 2, 2002. geodesy. noaa. gov/GRD/GPS/Projects/TEC/ 2011 -11 -03 88

The Ionosphere • There are winds and, as a result, clumping crudely analogous to clouds. These structures can occur anywhere on the globe but tend to occur most frequently at high latitudes where the ionosphere impinges more upon lower layers of the atmosphere. The ionospheric activity during the January, 1997 storm are shown here. Note the "lumpiness" of the electron density count in the upper left figure. isr. sri. com/iono/event_jan 97/ 2011 -11 -03 89

The Ionosphere • There are small, rapid variations called scintillation. Again using a crude analogy, scintillation affects radio signals much like the twinkling of a star. Scintillations occur everywhere but are often severe in the auroral zone and along the (geomagnetic) equator. www. windows. ucar. edu/spaceweather/scintillations_facts. ht m 2011 -11 -03 90

Ionospheric Effects Upon Positions These three plots show the effect of the ionosphere on L 1 -only double-difference observations from sites separate by increasing distances. The first plot shows that the ionospheric effects are removed by differencing over short distances. So if the ionosphere behaves and our sites are close together we can compute good positions using L 1 -only data. But what if the ionosphere is noisy or the distances are long? 2011 -11 -03 91

Ionospheric Correction Electromagnetic signals are "delayed" as they pass through this or any charged environment. More importantly for GNSS, this medium is dispersive meaning the delay depends upon the frequency of the signal. Functionally, the ionospheric delay is: d(ν)ion = f(Ne) ν 2 Where ν is signal frequency and f(Ne) is an unknown function dependent upon the unknown total electron count along the line of sight. www. windows. ucar. edu/spaceweather/images/atmos_layers_new_gif_image. html 2011 -11 -03 92

Ionospheric Correction Because f(Ne) is unknown, we’d be stuck, but fortunately, GNSS broadcasts at two frequencies. We can use these dual frequency observations to account for the of the ionosphere. Consider these equations where Dist λ P N OE d(ν)ion 2011 -11 -03 Dist = λL 1 × (PL 1 + NL 1) + OEL 1 − d(νL 1)ion and Dist = λL 2 × (PL 2 + NL 2) + OEL 2 − d(νL 2)ion is the station to satellite distance. is the wavelength of the indicated carrier signal. is the phase measurement. is the integer ambiguity. is other unmodelled effects. is the ionospheric delay. 93

Ionospheric Correction Both equation equal the same distance and so can write λL 1 × (PL 1 + NL 1) + OEL 1 − d(νL 1)ion = λL 2 × (PL 2 + NL 2) + OEL 2 − d(νL 2)ion Substituting f(Ne) for d(ν)ion gives ν 2 λL 1 × (PL 1 + NL 1) + OEL 1 − f(Ne) = λL 2 × (PL 2 + NL 2) + OEL 2− f(Ne) (νL 1)2 (νL 2)2 Grouping the terms with the unknown electron count function. λL 1 × (PL 1 + NL 1) − λL 2 × (PL 2 + NL 2) + OEL 1 − OEL 2 = − f(Ne) (νL 2)2 (νL 1)2 2011 -11 -03 94

Ionospheric Correction Rearranging terms to further isolating the electron count function. (νL 2)2 − (νL 1)2 λL 1 × (PL 1 + NL 1) − λL 2 × (PL 2 + NL 2) + OEL 1 − OEL 2 = × f(N e) (νL 1)2 × (νL 2)2 or (νL 1)2 × (νL 2)2 − (νL 1)2 × [λL 1 × (PL 1 + NL 1) − λL 2 × (PL 2 + NL 2) + OEL 1 − OEL 2] = f(Ne) Now we have a function for the electron count composed of known and observed values. 2011 -11 -03 95

Ionospheric Correction Returning to our original equations Dist = λL 1 × (PL 1 + NL 1) + OEL 1 − d(νL 1)ion = f(Ne) 2 2 2 f(Ne) =(νL 1) × (νL 2)2 − (νL 1)2 and νL 1 × [λL 1 × (PL 1 + NL 1) − λL 2 × (PL 2 + NL 2) + OEL 1 − OEL 2] Using the third equation, we’ll substitute for f(Ne) in the second. (νL 2)2 d(νL 1)ion = × [λ ×(PL 1 + NL 1) − λL 2×(PL 2 + NL 2) + OEL 1 − (νL 2)2 − (νL 1)2 L 1 OEL 2] 2011 -11 -03 96

Ionospheric Correction After combining the second and third equations, we have: Dist = λL 1 × (PL 1 + NL 1) + OEL 1 − d(νL 1)ion and (νL 2 d(νL 1)ion = × [λ ×(PL 1 + NL 1) − λL 2×(PL 2 + NL 2) + OEL 1 − L 1 (νL 2)2 − (νL 1)2 OEL 2] )2 Using the modified second equation to replace d(νL 1)ion in the first: (νL 2)2 − (νL 1)2 Dist = λL 1×(PL 1+NL 1)+OEL 1− × [λ L 1×(PL 1+NL 1)+OEL 1−λL 2×(PL 2+NL 2)−OEL 2] 2011 -11 -03 97

Ionospheric Correction Taking this equation, grouping like terms and rewriting a bit gives: (νL 1)2 (νL 2)2 Dist = [λ (P +N )−OEL 2] (νL 1)2 − (νL 2)2 L 1(PL 1+NL 1)+OEL 1] - [λ (νL 1)2 − (νL 2)2 L 2 L 2 Look at this equation for a moment. There are no total electron count terms; no ionospheric delay terms! We’ve demonstrated that by combining our L 1 and L 2 observations using the correct coefficients, we can create an ionosphere-free observable. This dual frequency combination is called the ion-free or L 3 observable in the jargon of GNSS data process, and removes the station separation limit imposed by the ionosphere. 2011 -11 -03 98

Neutral Atmosphere (Tropo) Correction The other atmospheric component of interest is the neutral atmosphere. It is quite common to subdivide the neutral component into two parts: dry and wet. Why? Two reasons. 2011 -11 -03 99

Neutral Atmosphere (Tropo) Correction First, the water molecule is actually quite surprising. Nitrogen, oxygen, carbon dioxide, almost all the other constituents of our atmosphere are linear molecules or atoms. H 2 O is relatively unique. It’s bent. That makes E-M waves, like GNSS signals, more strongly with water. nitrogen molecule 2011 -11 -03 oxygen molecule water molecule carbon dioxide molecule 100

Neutral Atmosphere (Tropo) Correction Second, everything else is very well mixed throughout our atmosphere. When we’re outside walking around, we generally don’t worry about getting caught in a pocket of carbon dioxide or nitrogen. We do worry about getting caught in a shower. We see clouds here but not over there. The water vapor in our atmosphere is clumpy. Moreover, it is almost entirely confined to the lowest layers of the atmosphere. This is called the troposphere, thus, the tropo correction. www. windows. ucar. edu/spaceweather/images/atmos_layers_new_gif_image. html 2011 -11 -03 101

Neutral Atmosphere (Tropo) Correction Because the dry part of our atmosphere, i. e. not water vapor, is “well behaved, ” the most common strategy for dealing with it in GNSS data processing is to model and remove its effect. Global climatological models exist capable of doing this quite well. The wet part is modelled and removed too, but a small correction derived from the GNSS observations themselves is usually computed as part of the data processing. What does this correction look like? 2011 -11 -03 102

Neutral Atmosphere (Tropo) Correction The world is round. Duh! But this is actually has a non-trivial impact on GNSS processing. Think for a moment. Signals from satellites near the horizon must travel a much longer path though the atmosphere, the wet part of the atmosphere, than do signals from satellites high overhead. This change in the ray path as a function of observed elevation has a simple form: 1 sin(obs elv) 2011 -11 -03 103

Neutral Atmosphere (Tropo) Correction The function representing the wet correction can be written as zenith wet delay sin(obs elv) The zenith wet delay is the delay caused by the wet portion of the atmosphere on a signal straight overhead. This is unknown and estimated from the observations in the processing. sin(obs elv) is called a mapping function. It “maps” the zenith delay to that of a signal coming from a lower observed elevation. This is computed. 2011 -11 -03 104

Neutral Atmosphere Effects Upon Positions Unfortunately, comprehensive evaluations show that the neutral atmosphere is almost but not perfectly corrected using this technique. This figure showing the post-fit RMS of observations from data processing. The seasonal signal is obvious. You may have seen something similar in your own results. For conventional surveys, there is little more you can do. For larger surveys some additional options are possible but will not be discussed here. 2011 -11 -03 105

Neutral Atmosphere Effects Upon Positions Using data from the FAA automated airport surface meteorological data service, the magnitude and variability of tropo effects across the network can be demonstrated. Here we see the temperature, pressure and relative humidity across the network at 11: 50 AM EDT on April 18, 2002. These were used to compute the total zenith delay. 2011 -11 -03 106

Neutral Atmosphere Effects Upon Positions This figure also shows the relative zenith delay across the network with respect to the delay at the central site, colb. Significant variation can be seen across the region even on a relatively pleasant day. 2011 -11 -03 107

Neutral Atmosphere Effects Upon Positions Some guidelines for estimating tropo corrections as part of your GNSS data processing. If the separation between sites is: < 1 km none or relative correction, < 50 km relative correction. > 50 km absolute correction. If a relative correction is selected, use the site with the best surface met as the tropo reference, i. e. the site with its tropo estimation turned off. 2011 -11 -03 108

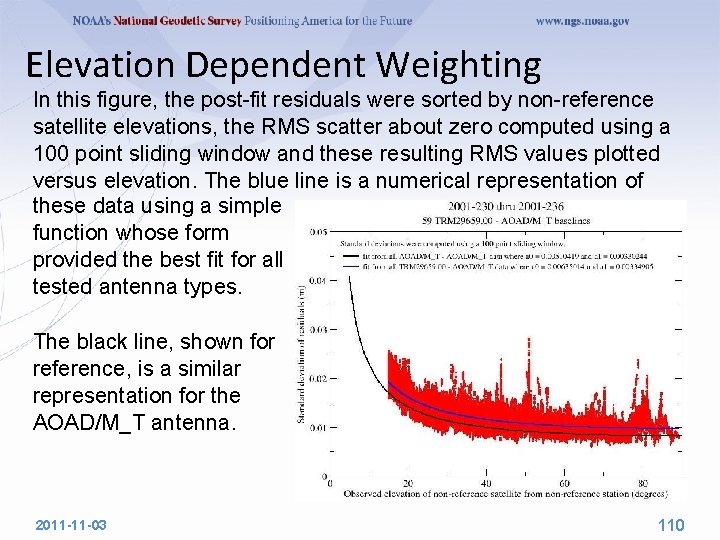
Elevation Dependent Weighting It is not difficult to believe or show that the measurement error increases as the observed satellite's elevation decreases. The figure, from a study completed in 2001, shows this effect for globally distributed sites using the TRM 29659. 00 antenna. PCVs have been removed. Similar figures were generated for other antenna types. Elevation weighting downweights the important low elevation observations, but can results in more realistic statistics and better results. 2011 -11 -03 109

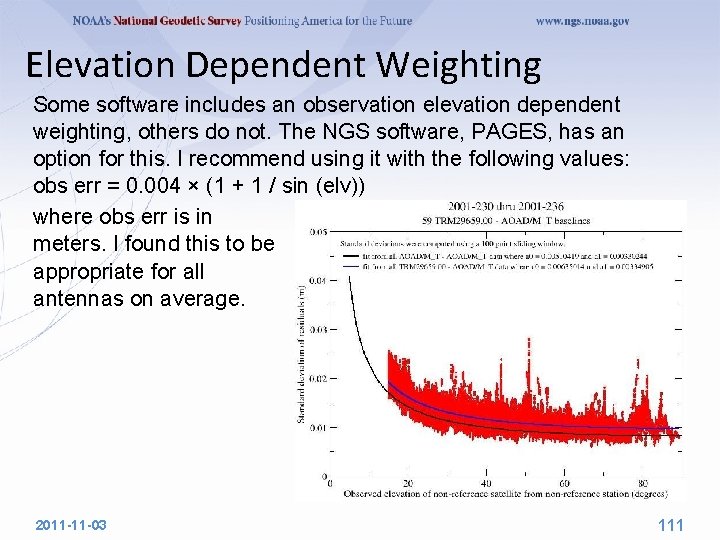
Elevation Dependent Weighting In this figure, the post-fit residuals were sorted by non-reference satellite elevations, the RMS scatter about zero computed using a 100 point sliding window and these resulting RMS values plotted versus elevation. The blue line is a numerical representation of these data using a simple function whose form provided the best fit for all tested antenna types. The black line, shown for reference, is a similar representation for the AOAD/M_T antenna. 2011 -11 -03 110

Elevation Dependent Weighting Some software includes an observation elevation dependent weighting, others do not. The NGS software, PAGES, has an option for this. I recommend using it with the following values: obs err = 0. 004 × (1 + 1 / sin (elv)) where obs err is in meters. I found this to be appropriate for all antennas on average. 2011 -11 -03 111

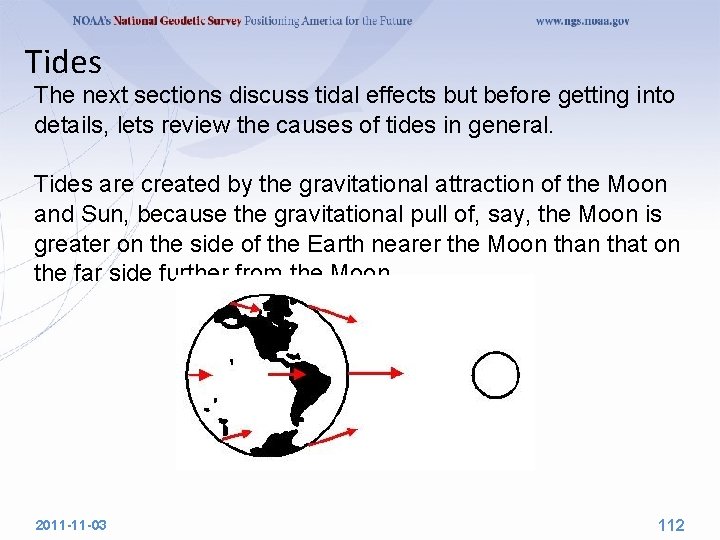
Tides The next sections discuss tidal effects but before getting into details, lets review the causes of tides in general. Tides are created by the gravitational attraction of the Moon and Sun, because the gravitational pull of, say, the Moon is greater on the side of the Earth nearer the Moon that on the far side further from the Moon. 2011 -11 -03 112

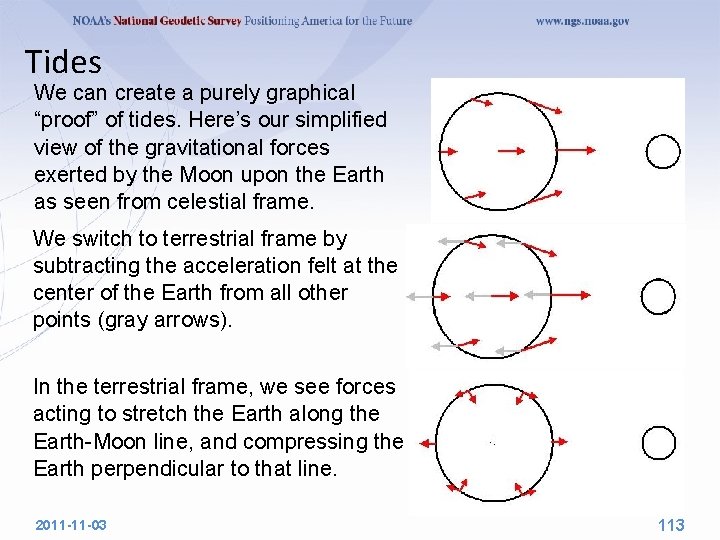
Tides We can create a purely graphical “proof” of tides. Here’s our simplified view of the gravitational forces exerted by the Moon upon the Earth as seen from celestial frame. We switch to terrestrial frame by subtracting the acceleration felt at the center of the Earth from all other points (gray arrows). In the terrestrial frame, we see forces acting to stretch the Earth along the Earth-Moon line, and compressing the Earth perpendicular to that line. 2011 -11 -03 113

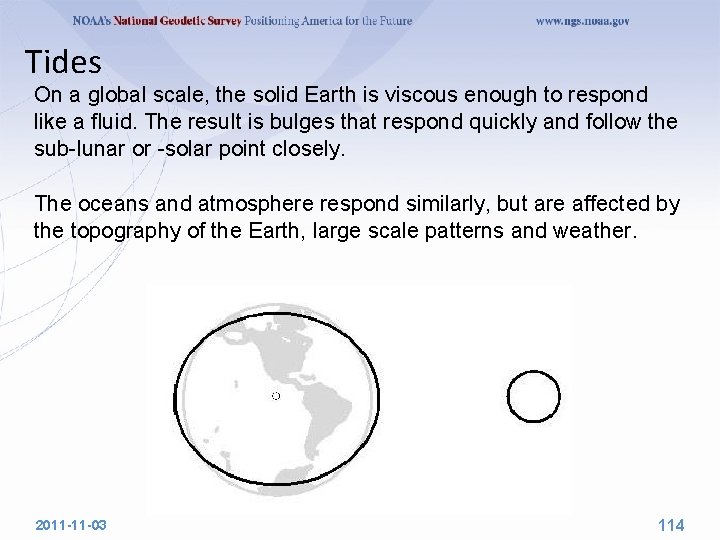
Tides On a global scale, the solid Earth is viscous enough to respond like a fluid. The result is bulges that respond quickly and follow the sub-lunar or -solar point closely. The oceans and atmosphere respond similarly, but are affected by the topography of the Earth, large scale patterns and weather. 2011 -11 -03 114

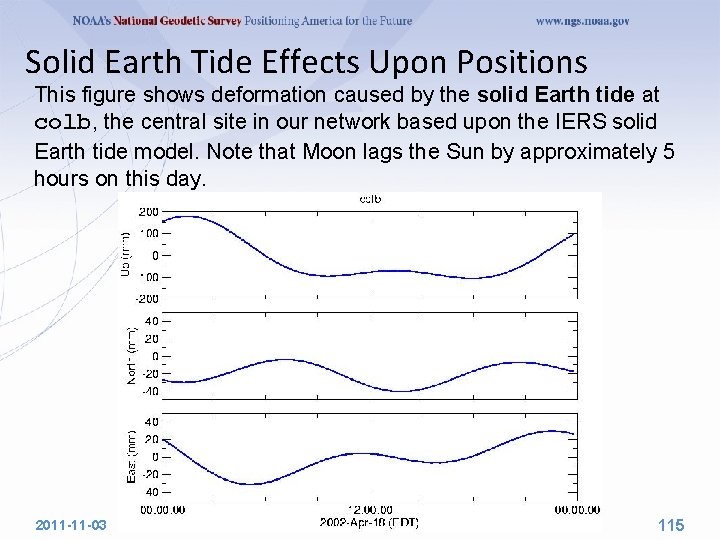
Solid Earth Tide Effects Upon Positions This figure shows deformation caused by the solid Earth tide at colb, the central site in our network based upon the IERS solid Earth tide model. Note that Moon lags the Sun by approximately 5 hours on this day. 2011 -11 -03 115

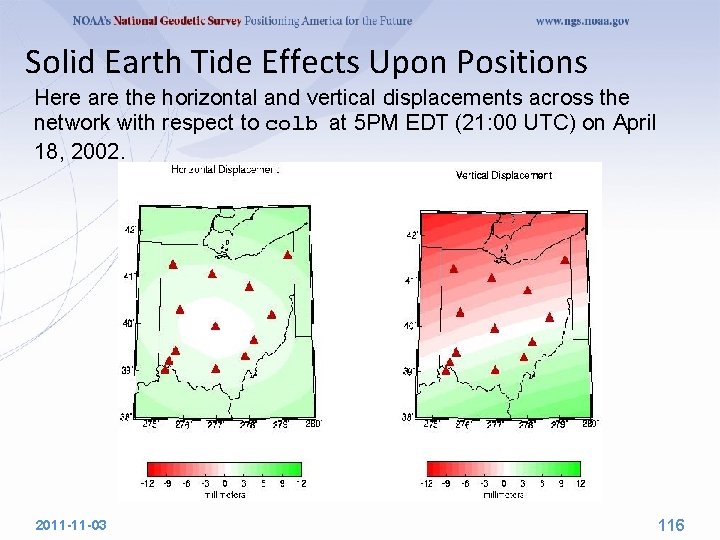
Solid Earth Tide Effects Upon Positions Here are the horizontal and vertical displacements across the network with respect to colb at 5 PM EDT (21: 00 UTC) on April 18, 2002. 2011 -11 -03 116

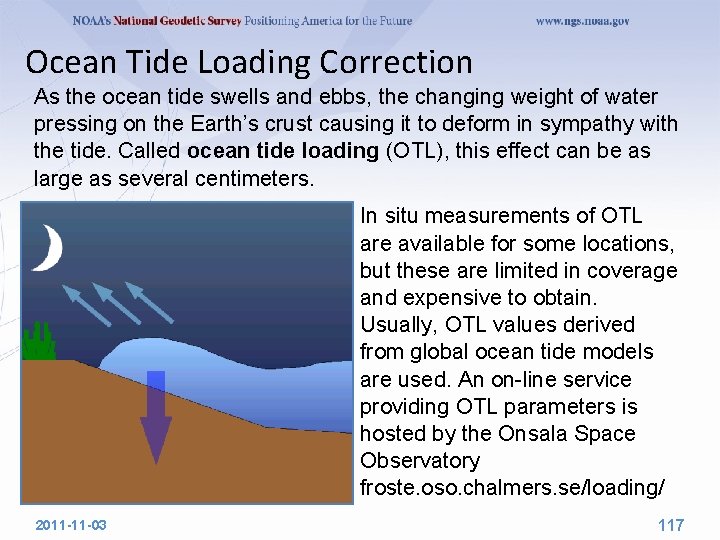
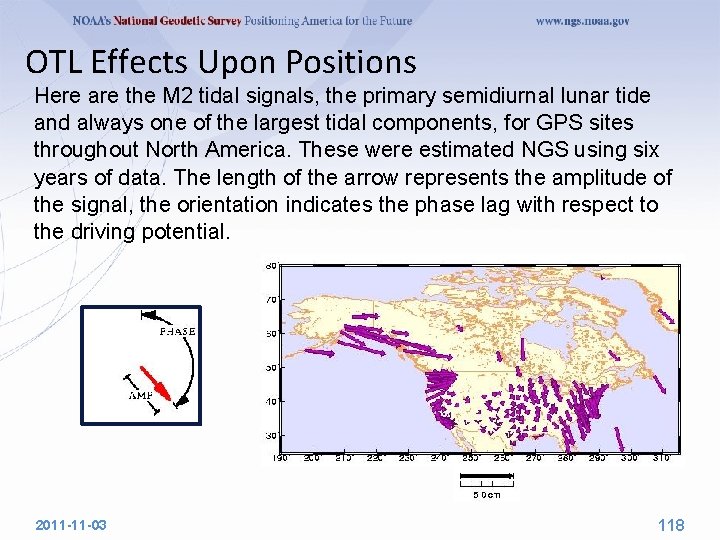
Ocean Tide Loading Correction As the ocean tide swells and ebbs, the changing weight of water pressing on the Earth’s crust causing it to deform in sympathy with the tide. Called ocean tide loading (OTL), this effect can be as large as several centimeters. In situ measurements of OTL are available for some locations, but these are limited in coverage and expensive to obtain. Usually, OTL values derived from global ocean tide models are used. An on-line service providing OTL parameters is hosted by the Onsala Space Observatory froste. oso. chalmers. se/loading/ 2011 -11 -03 117

OTL Effects Upon Positions Here are the M 2 tidal signals, the primary semidiurnal lunar tide and always one of the largest tidal components, for GPS sites throughout North America. These were estimated NGS using six years of data. The length of the arrow represents the amplitude of the signal, the orientation indicates the phase lag with respect to the driving potential. 2011 -11 -03 118

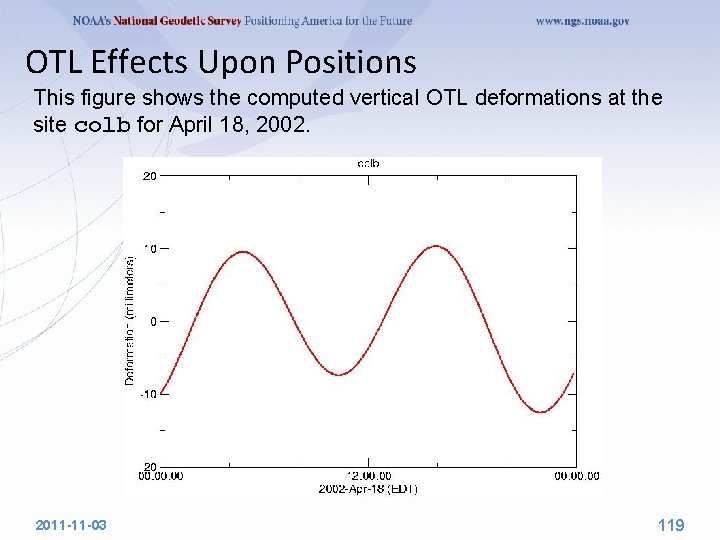
OTL Effects Upon Positions This figure shows the computed vertical OTL deformations at the site colb for April 18, 2002. 2011 -11 -03 119

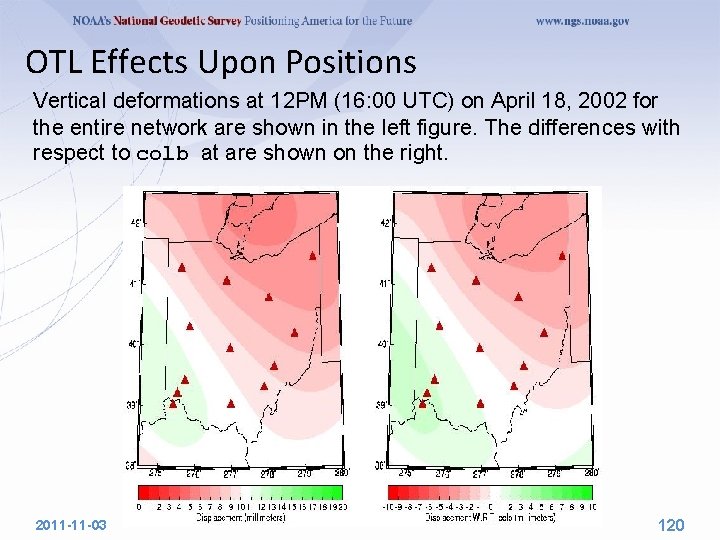
OTL Effects Upon Positions Vertical deformations at 12 PM (16: 00 UTC) on April 18, 2002 for the entire network are shown in the left figure. The differences with respect to colb at are shown on the right. 2011 -11 -03 120

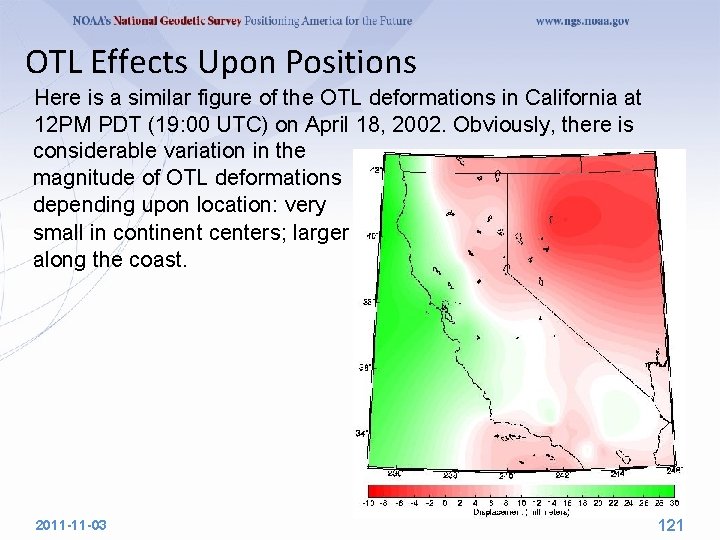
OTL Effects Upon Positions Here is a similar figure of the OTL deformations in California at 12 PM PDT (19: 00 UTC) on April 18, 2002. Obviously, there is considerable variation in the magnitude of OTL deformations depending upon location: very small in continent centers; larger along the coast. 2011 -11 -03 121

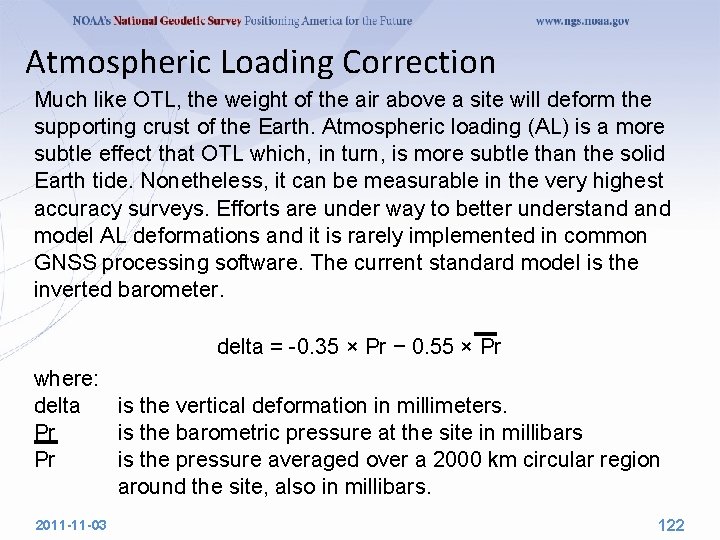
Atmospheric Loading Correction Much like OTL, the weight of the air above a site will deform the supporting crust of the Earth. Atmospheric loading (AL) is a more subtle effect that OTL which, in turn, is more subtle than the solid Earth tide. Nonetheless, it can be measurable in the very highest accuracy surveys. Efforts are under way to better understand model AL deformations and it is rarely implemented in common GNSS processing software. The current standard model is the inverted barometer. delta = -0. 35 × Pr − 0. 55 × Pr where: delta is the vertical deformation in millimeters. Pr is the barometric pressure at the site in millibars Pr is the pressure averaged over a 2000 km circular region around the site, also in millibars. 2011 -11 -03 122

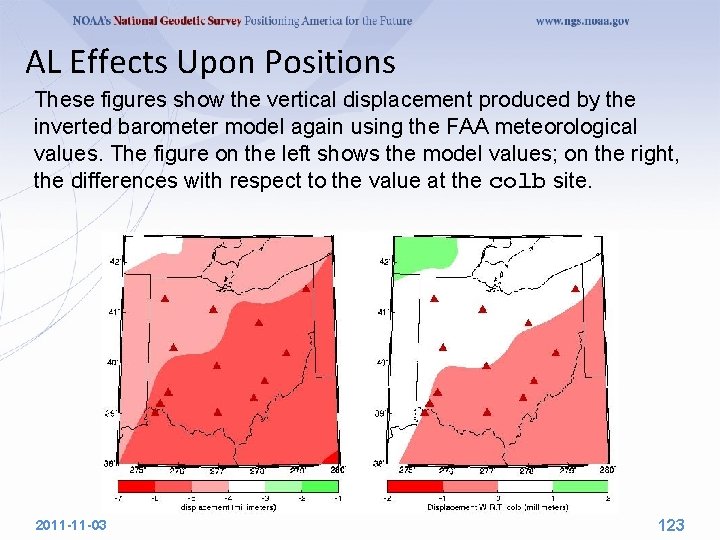
AL Effects Upon Positions These figures show the vertical displacement produced by the inverted barometer model again using the FAA meteorological values. The figure on the left shows the model values; on the right, the differences with respect to the value at the colb site. 2011 -11 -03 123

Hydrological Loading Hydrological loading by surface water is actually a "hot" topic in some academic circles now. The basic concept is that weight of stored surface water depresses the supporting crust. This water may be store in lakes and reservoirs, snow packs, soil moisture and in other ways I'm sure. Cases of real significance are known most of which are associated with new dam and reservoir construction. Because it this is such a localized phenomena, no model for hydrological loading although its effects may be expressed in the velocity of a site. 2011 -11 -03 124

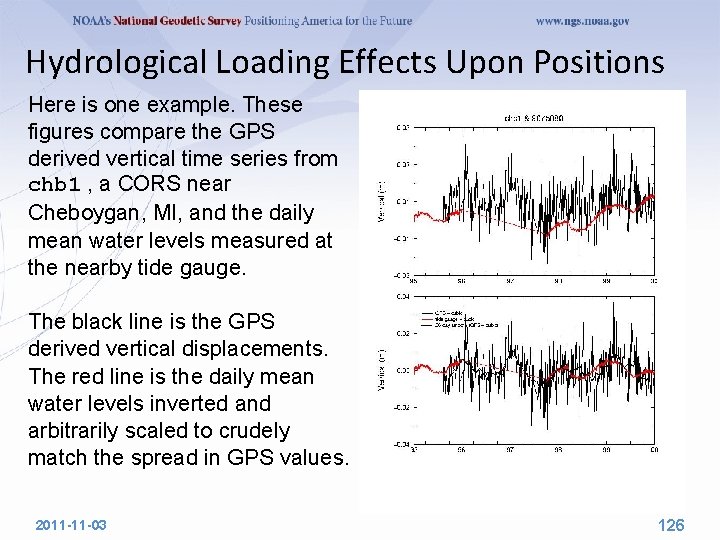
Hydrological Loading Effects Upon Positions During a conversation with a colleague working in this field, I recognized a case where hydrological loading may be occurring and where the hardware was already in place to detect it. Namely, the tide gauges and the CORS surrounding the Great Lakes. Although other forces are doubtless at play, these quick examples gave me an empirical sense of the importance of this effect. 2011 -11 -03 125

Hydrological Loading Effects Upon Positions Here is one example. These figures compare the GPS derived vertical time series from chb 1 , a CORS near Cheboygan, MI, and the daily mean water levels measured at the nearby tide gauge. The black line is the GPS derived vertical displacements. The red line is the daily mean water levels inverted and arbitrarily scaled to crudely match the spread in GPS values. 2011 -11 -03 126

Subsidence There are many sources of subsidence and I suspect that the members of this group know far more about the sources pertinent in their regions than I. Here I'll describe a few sources which may need to be considered. In most of these cases, there is little chance to generate an a priori model of these motions, except as changes in site velocities. Furthermore, such a model would be too specific to a location for more general use with one notable exception. We briefly discuss several examples in the next few slides. 2011 -11 -03 127

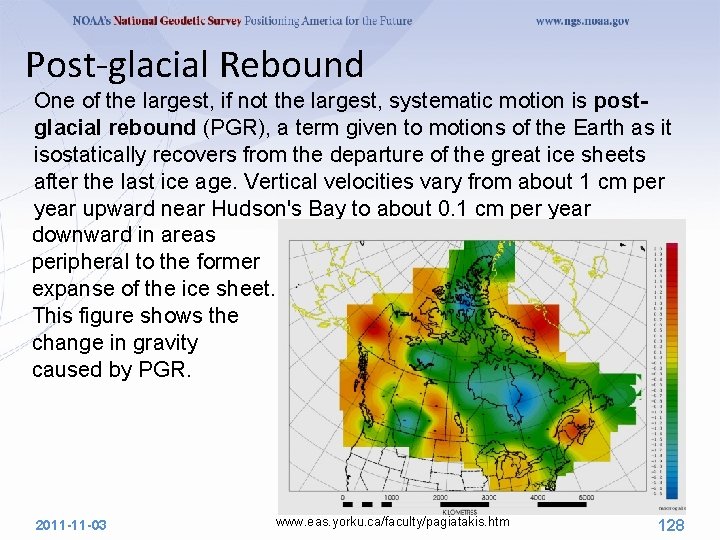
Post‐glacial Rebound One of the largest, if not the largest, systematic motion is postglacial rebound (PGR), a term given to motions of the Earth as it isostatically recovers from the departure of the great ice sheets after the last ice age. Vertical velocities vary from about 1 cm per year upward near Hudson's Bay to about 0. 1 cm per year downward in areas peripheral to the former expanse of the ice sheet. This figure shows the change in gravity caused by PGR. 2011 -11 -03 www. eas. yorku. ca/faculty/pagiatakis. htm 128

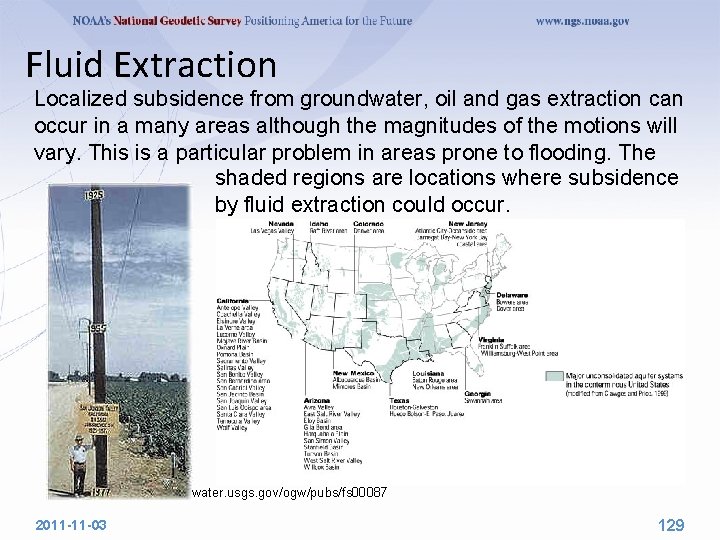
Fluid Extraction Localized subsidence from groundwater, oil and gas extraction can occur in a many areas although the magnitudes of the motions will vary. This is a particular problem in areas prone to flooding. The shaded regions are locations where subsidence by fluid extraction could occur. water. usgs. gov/ogw/pubs/fs 00087 2011 -11 -03 129

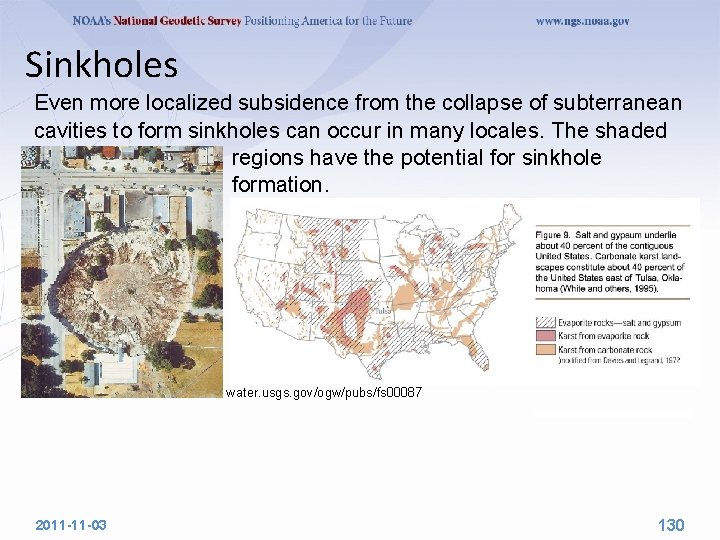
Sinkholes Even more localized subsidence from the collapse of subterranean cavities to form sinkholes can occur in many locales. The shaded regions have the potential for sinkhole formation. water. usgs. gov/ogw/pubs/fs 00087 2011 -11 -03 130

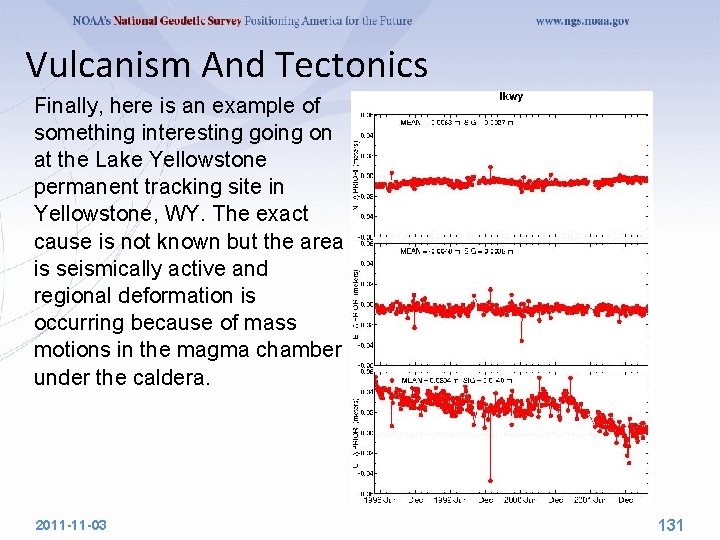
Vulcanism And Tectonics Finally, here is an example of something interesting going on at the Lake Yellowstone permanent tracking site in Yellowstone, WY. The exact cause is not known but the area is seismically active and regional deformation is occurring because of mass motions in the magma chamber under the caldera. 2011 -11 -03 131

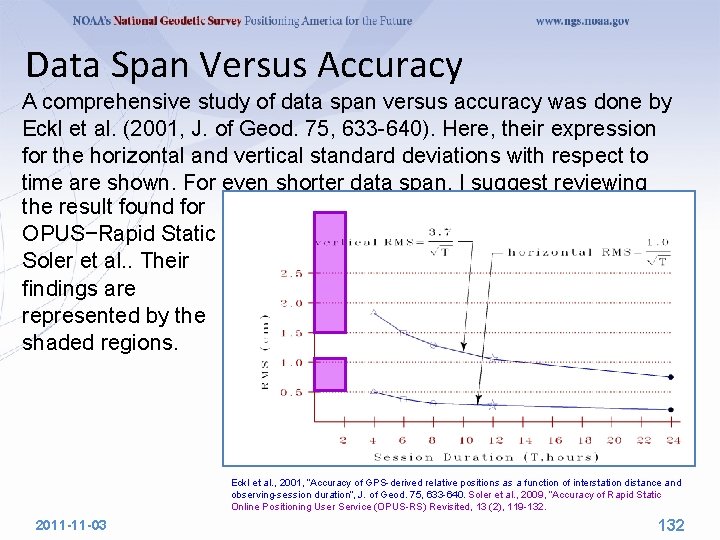
Data Span Versus Accuracy A comprehensive study of data span versus accuracy was done by Eckl et al. (2001, J. of Geod. 75, 633 -640). Here, their expression for the horizontal and vertical standard deviations with respect to time are shown. For even shorter data span, I suggest reviewing the result found for OPUS−Rapid Static Soler et al. . Their findings are represented by the shaded regions. Eckl et al. , 2001, “Accuracy of GPS-derived relative positions as a function of interstation distance and observing-session duration”, J. of Geod. 75, 633 -640. Soler et al. , 2009, “Accuracy of Rapid Static Online Positioning User Service (OPUS-RS) Revisited, 13 (2), 119 -132. 2011 -11 -03 132

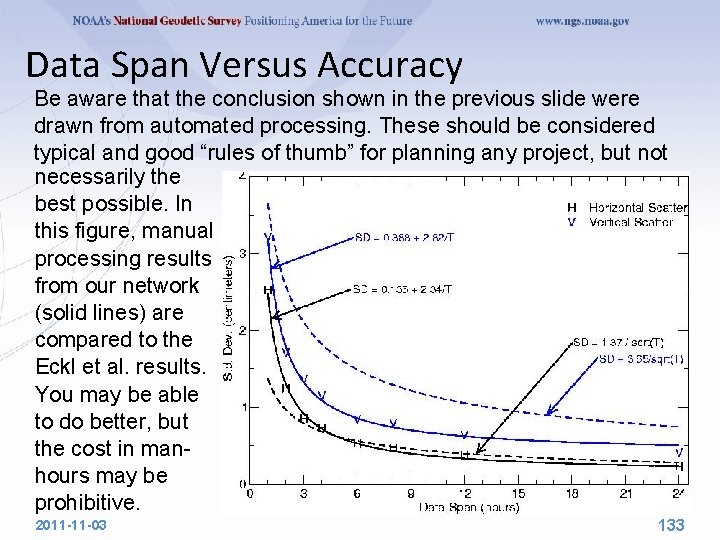
Data Span Versus Accuracy Be aware that the conclusion shown in the previous slide were drawn from automated processing. These should be considered typical and good “rules of thumb” for planning any project, but not necessarily the best possible. In this figure, manual processing results from our network (solid lines) are compared to the Eckl et al. results. You may be able to do better, but the cost in manhours may be prohibitive. 2011 -11 -03 133

When Good Data Goes Bad In the remaining time, we’ll some whacky real-life cases. This is intended to be more fun than educational, but be careful. You don’t want to end up in section some day. 2011 -11 -03 134

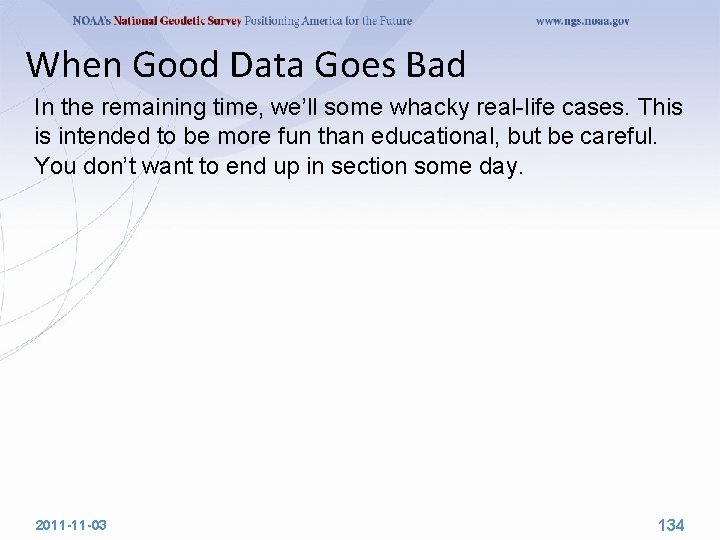
When Good Data Goes Bad As we’ve seen, water is always a problem whether it is in the atmosphere or frozen to the exterior of your antenna. This is a photo of the site cena taken during the winter of 1999. 2011 -11 -03 135

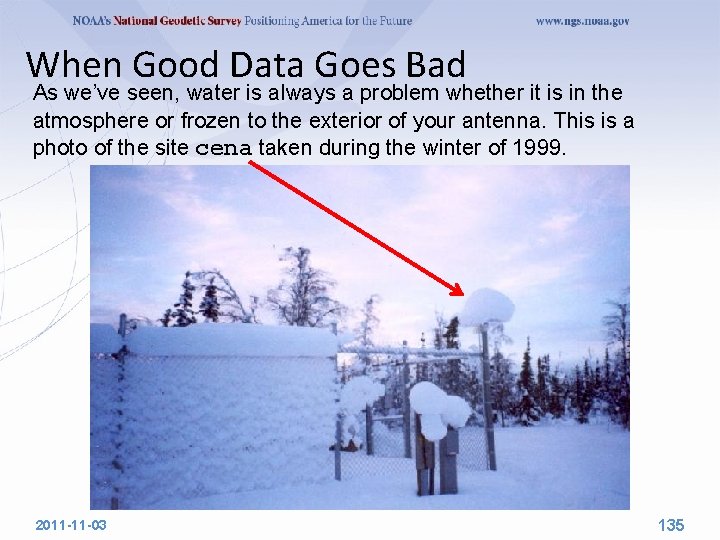
When Good Data Goes Bad As I said, water is always a problem whether it is in the atmosphere, frozen to the exterior of your antenna or condensing on the interior of your radome. gode in the summer of 1995. 2011 -11 -03 136

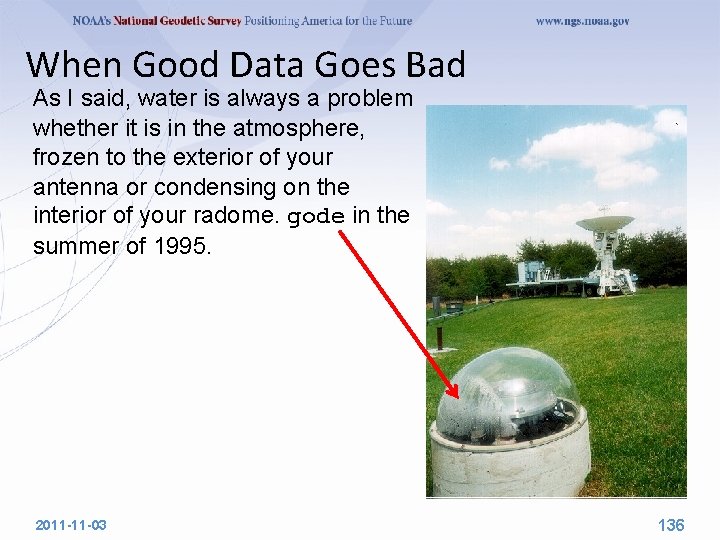
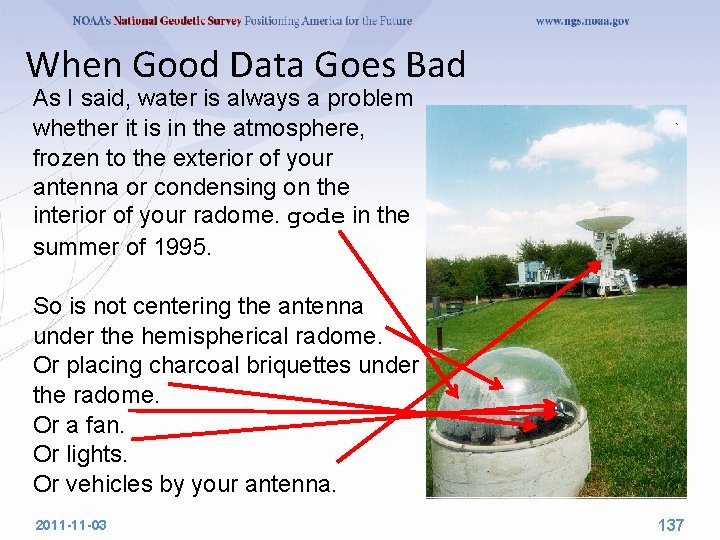
When Good Data Goes Bad As I said, water is always a problem whether it is in the atmosphere, frozen to the exterior of your antenna or condensing on the interior of your radome. gode in the summer of 1995. So is not centering the antenna under the hemispherical radome. Or placing charcoal briquettes under the radome. Or a fan. Or lights. Or vehicles by your antenna. 2011 -11 -03 137

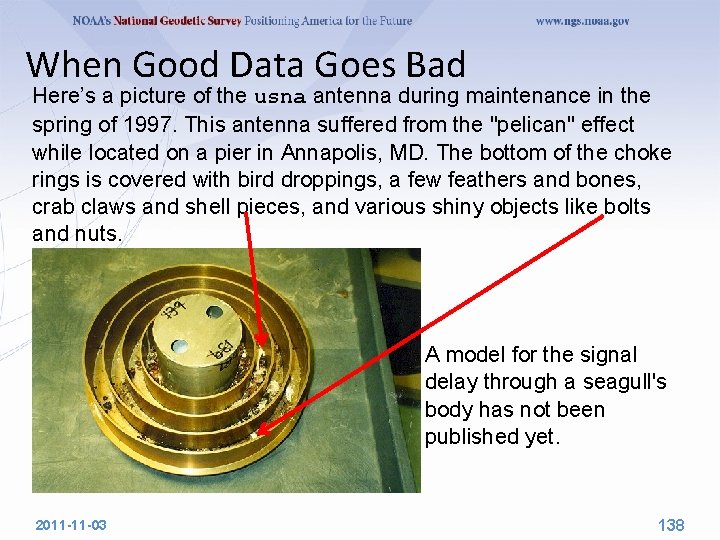
When Good Data Goes Bad Here’s a picture of the usna antenna during maintenance in the spring of 1997. This antenna suffered from the "pelican" effect while located on a pier in Annapolis, MD. The bottom of the choke rings is covered with bird droppings, a few feathers and bones, crab claws and shell pieces, and various shiny objects like bolts and nuts. A model for the signal delay through a seagull's body has not been published yet. 2011 -11 -03 138

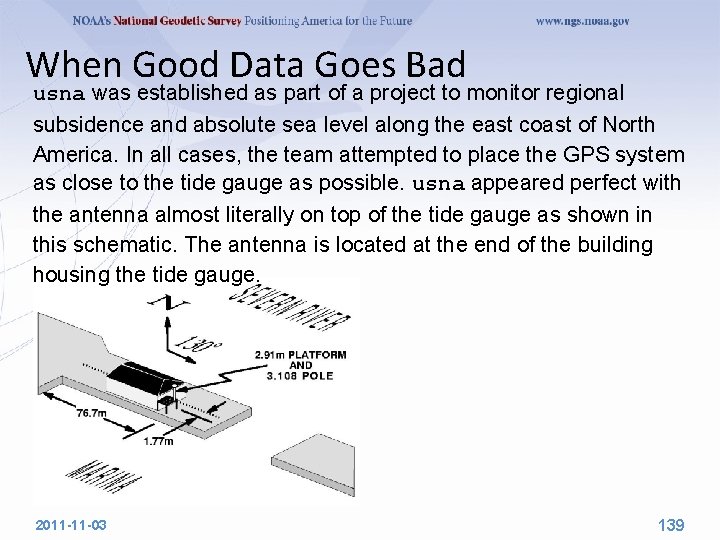
When Good Data Goes Bad usna was established as part of a project to monitor regional subsidence and absolute sea level along the east coast of North America. In all cases, the team attempted to place the GPS system as close to the tide gauge as possible. usna appeared perfect with the antenna almost literally on top of the tide gauge as shown in this schematic. The antenna is located at the end of the building housing the tide gauge. 2011 -11 -03 139

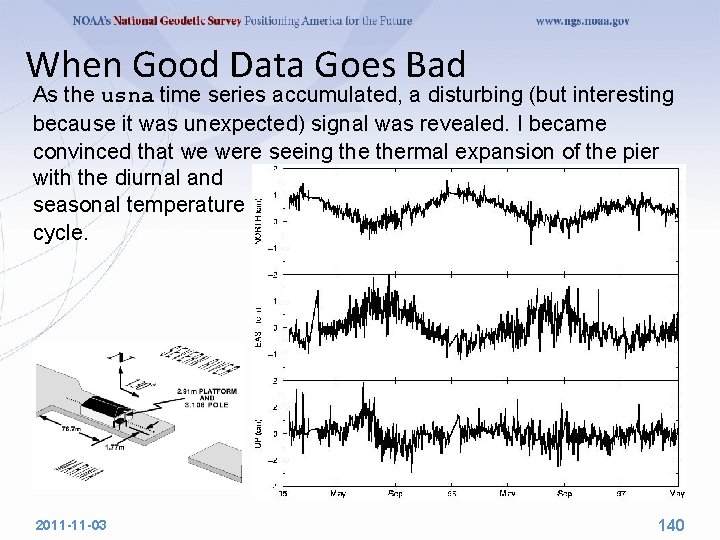
When Good Data Goes Bad As the usna time series accumulated, a disturbing (but interesting because it was unexpected) signal was revealed. I became convinced that we were seeing thermal expansion of the pier with the diurnal and seasonal temperature cycle. 2011 -11 -03 140

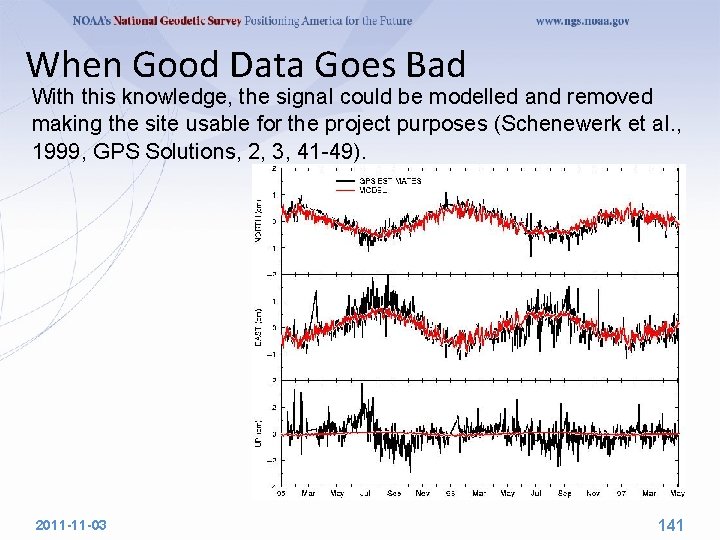
When Good Data Goes Bad With this knowledge, the signal could be modelled and removed making the site usable for the project purposes (Schenewerk et al. , 1999, GPS Solutions, 2, 3, 41 -49). 2011 -11 -03 141

Physical Models Used (and Not Used) in GNSS Data Processing Dr. Mark Schenewerk Mark. Schenewerk@noaa. gov 816 -994 -3009