Physical Capital vs Financial Capital Physical capital Tools

 • Total amount of capital measured at")
 • the value of all the things that")


 Total Foreign Holdings =")
 X-M>0 (e. g.")
- Slides: 32
Physical Capital vs. Financial Capital Ø Physical capital • Tools, instruments, machines, buildings, and other items that have been produced in the past and that are used today to produce goods and services. Ø Financial capital • The funds that firms use to buy physical capital.
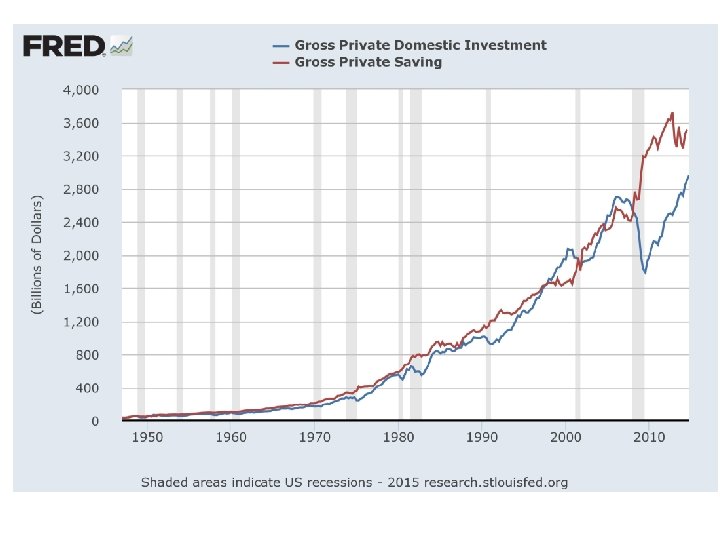
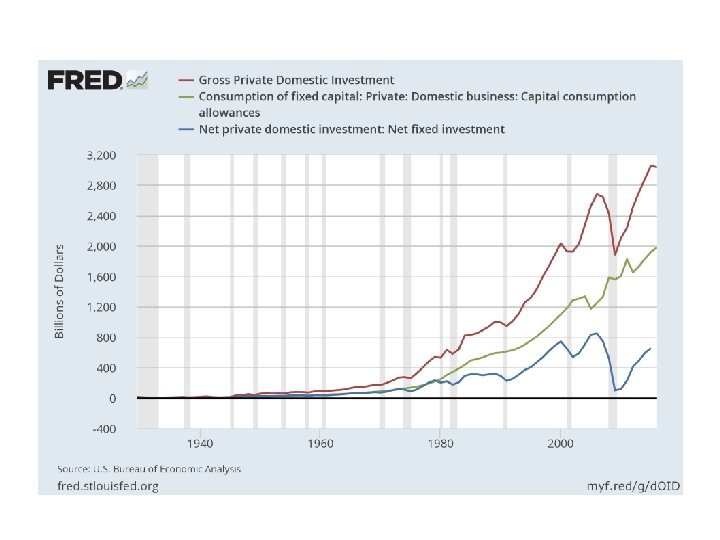
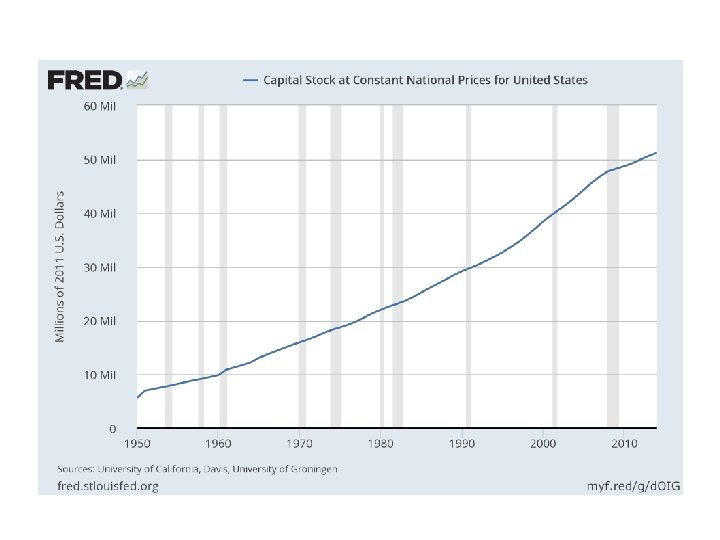
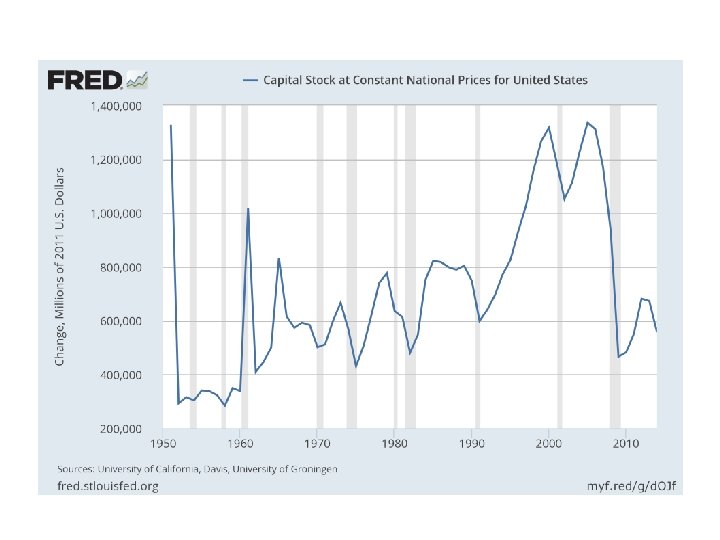
Capital and Investment Ø Capital Stock (K) • Total amount of capital measured at a given point in time. Ø Gross investment (I) • total amount spent on purchases of new capital and on replacing depreciated capital. Ø Depreciation (capital consumption allowance) • decrease in the quantity of capital that results from wear and tear and obsolescence. Ø Net investment (IN) • change in the quantity of capital. • I - CCA Ø K(t) = K(t-1) + IN
Wealth and Saving Ø Wealth (W) • the value of all the things that people own. Ø Saving (S) • the amount of income that is not paid in taxes or spent on consumption goods and services. Ø Wealth increases with • Saving (S) • Capital gains (CG) Ø Wealth is decreased by capital losses or dissaving. Ø W(t) = W(t-1)+S(t-1)+ CG(t-1)
Markets for financial capital Ø Saving is the source of funds used to finance investment. Ø These funds are supplied and demanded in three types of financial markets: • Loan markets • Bond markets • Stock markets
Financial Institutions and markets Financial institution • a firm that operates on both sides of the markets for financial capital. • borrower in one market and a lender in another. Types of financial institutions (more on this later) Investment banks • Commercial banks • Government-sponsored mortgage lenders • Pension funds • Insurance companies •
The Market for Loanable Funds Market where households, firms, governments, and financial institutions borrow and lend. The market influences Ø Saving and investment Ø Interest rates
The Market for Loanable Funds The market for loanable funds is the aggregate of all the individual financial markets. Funds that Finance Investment 1. Household saving S 2. Government budget surplus (T -Tr – G) 3. Loans from the rest of the world (M – X) Because Income Side of GDP = Expenditure Side of GDP C + S + (T-Tr) = C + I + G + (X-M) I = S + TN-G + (M-X) where TN=T-Tr (net taxes)
The Market for Loanable Funds Ø Nominal interest rate • More specific name for “interest rate” • Not adjusted for effects of inflation • ($ of interest / $ of principal) period of time Ø Real interest rate • nominal interest rate adjusted to remove the effects of inflation on the purchasing power of money. • nominal interest rate minus the inflation rate.
The Market for Loanable Funds Demand for loanable funds Ø the relationship between the quantity of loanable funds demanded and the real interest rate, ceteris paribus. Ø Business investment is the main item that makes up the demand for loanable funds.
The Market for Loanable Funds Changes in the Demand for Loanable Funds (a shift in the demand curve) Ø When expected profits rises, the demand for loanable funds rises Ø Tax policy can affect demand for loanable funds • Investment tax credit • Accelerated depreciation.
The Market for Loanable Funds Ø The Supply of Loanable Funds • the relationship between the quantity of loanable funds supplied and the real interest rate, ceteris paribus. • Saving is the main item that makes up the supply of loanable funds.
Supply of Loanable Funds
The Market for Loanable Funds Ø Changes in the supply of loanable funds • Driven by changes in willingness to lend (save) at various interest rates • Permanent Income hypothesis is that household consumption in any given year matches their “permanent income” – – • Predictions from PIH regarding savings behavior – – – • If income>permanent income, save If income<permanent income, borrow or dissave Temporary changes in disposable income Expected future income Unexpected changes in wealth Perceived default risk of borrowers will also affect loan supply to a particular group of borrowers
The Market for Loanable Funds: Equilibrium
The Market for Loanable Funds • Assuming no government or international sector, • SLF= Saving • DLF=Investment • Analyze effects of each of the following on Saving, Investment, real interest rate. • A technological advance that creates profitable investment opportunities. • Households become more optimistic about future income growth. • Government creates more tax incentives for business investment.
Government in the Market for Loanable Funds Government enters the loan market when it has a budget surplus or deficit. • A government budget surplus increases the supply of funds • A government budget deficit increases the demand for funds.
Gross government saving includes federal, state and local government.
Government Surplus in the Market for Loanable Funds
Government Deficit in the Market for Loanable Funds
Government in the Market for Loanable Funds: Ricardo-Barro Effect
Government in the Market for Loanable Funds: Ricardo-Barro Effect
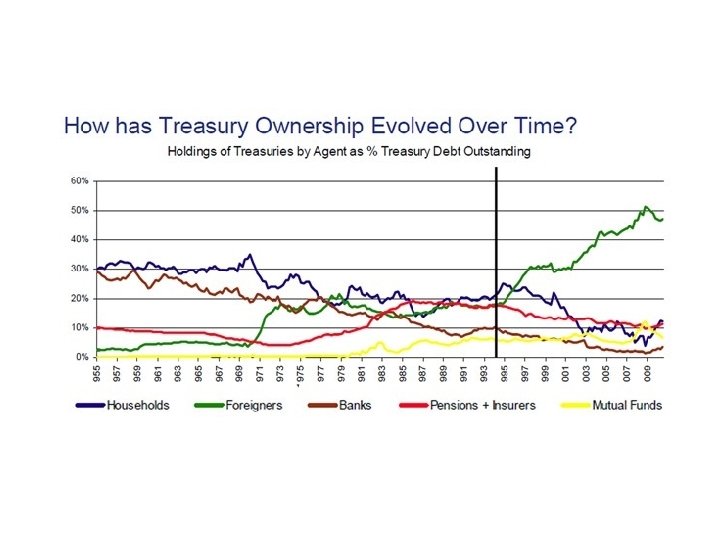
The Global Loanable Funds Market • The loanable funds market is global, not national. • Financial capital is mobile: It moves to the best advantage of lenders and borrowers. • Because lenders are free to seek the highest real interest rate and borrowers are free to seek the lowest real interest rate, the loanable funds market is a single, integrated, global market. • Funds flow into the country in which the real interest rate is highest and out of the country in which the real interest rate is lowest.
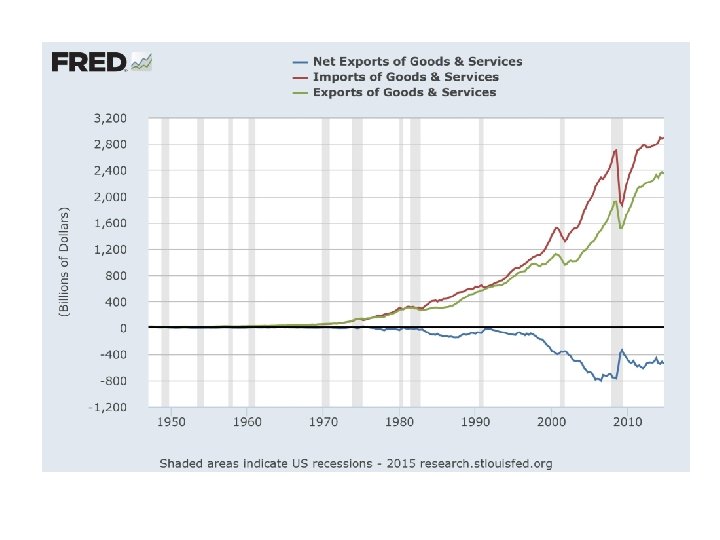
The Global Loanable Funds Market International Borrowing and Lending Ø If a country’s net exports are negative, • Country is a net borrower • quantity of loanable funds in that country is greater than national saving. Ø If a country’s net exports are positive, • the country is a net lender • the quantity of loanable funds in that country is less than national saving.
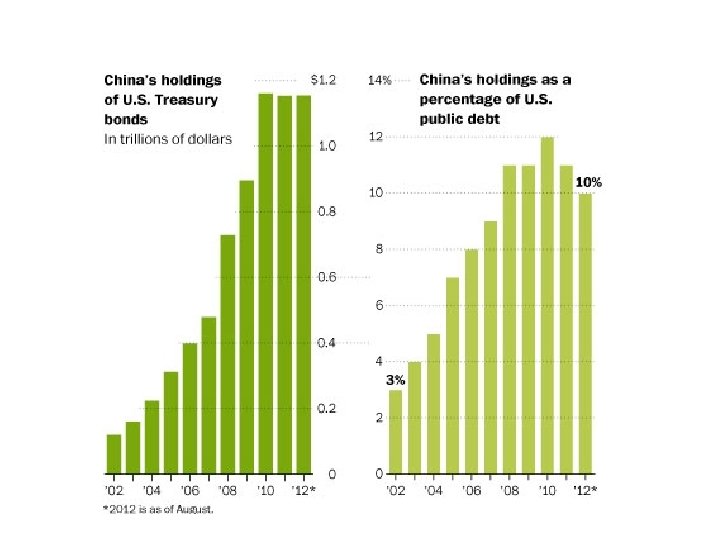
Foreign Holdings of U. S. Government Bonds (Billions of $) Total Foreign Holdings = $5, 557. 2 b.
The Global Loanable Funds Market X-M<0 (e. g. U. S. today) X-M>0 (e. g. China today)