
Phylogenetic Tree Construction Dong Xu Computer Science Department
- Slides: 69
Phylogenetic Tree Construction Dong Xu Computer Science Department 271 C Life Sciences Center 1201 East Rollins Road University of Missouri-Columbia, MO 65211 -2060 E-mail: xudong@missouri. edu 573 -882 -7064 (O) http: //digbio. missouri. edu
Outline Evolution theory Ø Concept of phylogeny Ø Molecular clock Ø Types of trees Ø UPGMA Ø Parsimony Ø Maximum likelihood Ø An example for bird flu Ø
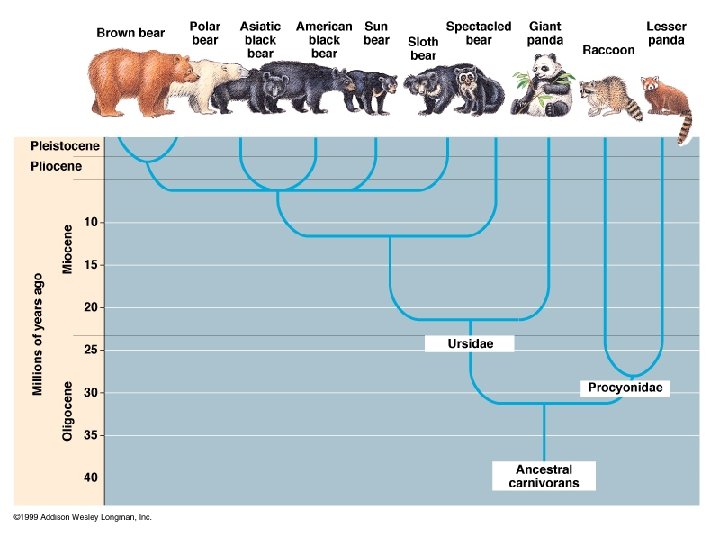
Evolution l Many theories of evolution l Basic idea: åspeciation events lead to creation of different species åAny two species share a (possibly distant) common ancestor
Evolutionary Events l Extinction: A new node u is created at the end of a lineage, no new lineage is started from u l Speciation: A new node u is created at the end of a lineage, and two new lineages are started from u l Hybridization: A new node u is created å when two lineages combine (diploid or polyploid) å when one lineage creates u and the new lineage from u has double the number of homologs (autopolyploid)
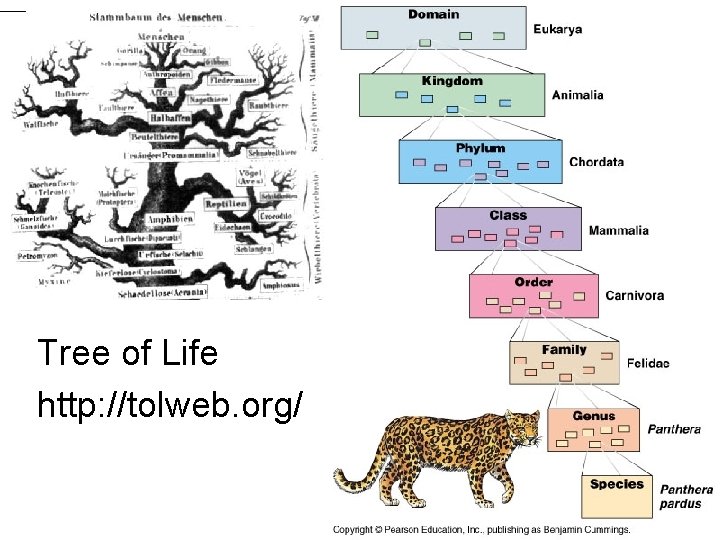
Tree of Life http: //tolweb. org/
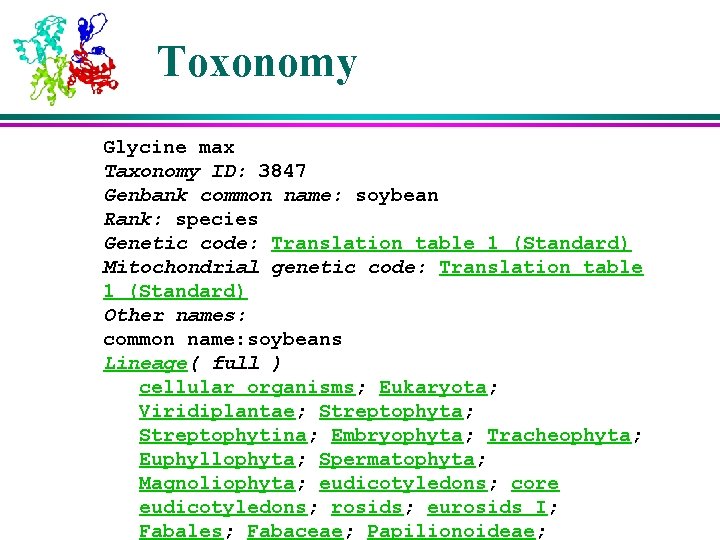
Toxonomy Glycine max Taxonomy ID: 3847 Genbank common name: soybean Rank: species Genetic code: Translation table 1 (Standard) Mitochondrial genetic code: Translation table 1 (Standard) Other names: common name: soybeans Lineage( full ) cellular organisms; Eukaryota; Viridiplantae; Streptophyta; Streptophytina; Embryophyta; Tracheophyta; Euphyllophyta; Spermatophyta; Magnoliophyta; eudicotyledons; core eudicotyledons; rosids; eurosids I; Fabales; Fabaceae; Papilionoideae;
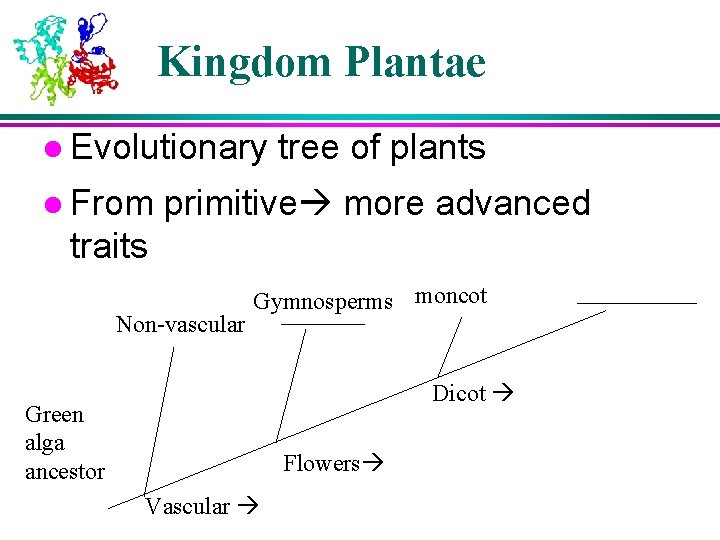
Kingdom Plantae l Evolutionary l From tree of plants primitive more advanced traits moncot Gymnosperms _______ Non-vascular Dicot Green alga ancestor Flowers Vascular _____
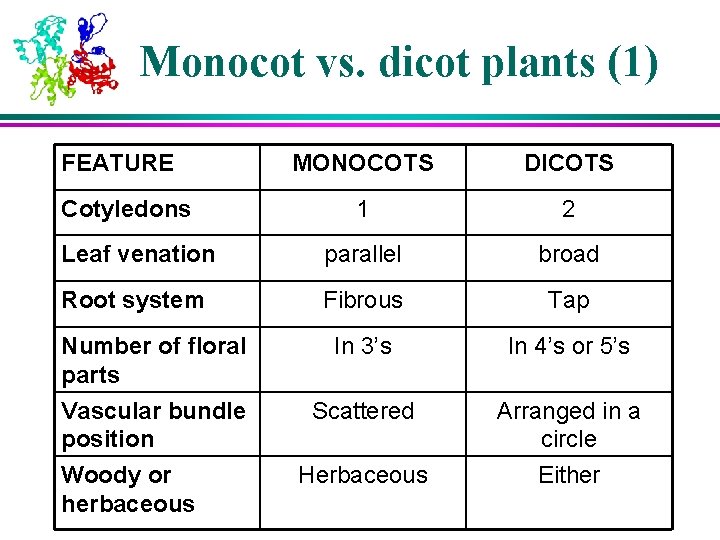
Monocot vs. dicot plants (1) FEATURE MONOCOTS DICOTS 1 2 Leaf venation parallel broad Root system Fibrous Tap Number of floral parts In 3’s In 4’s or 5’s Vascular bundle position Woody or herbaceous Scattered Arranged in a circle Either Cotyledons Herbaceous
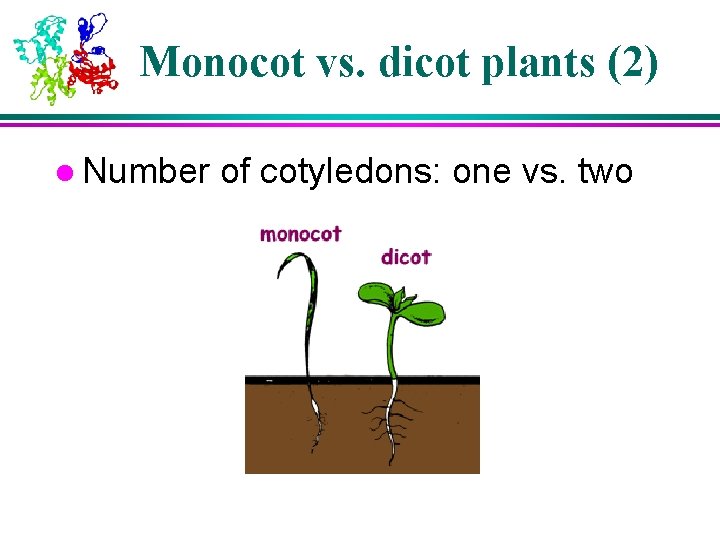
Monocot vs. dicot plants (2) l Number of cotyledons: one vs. two
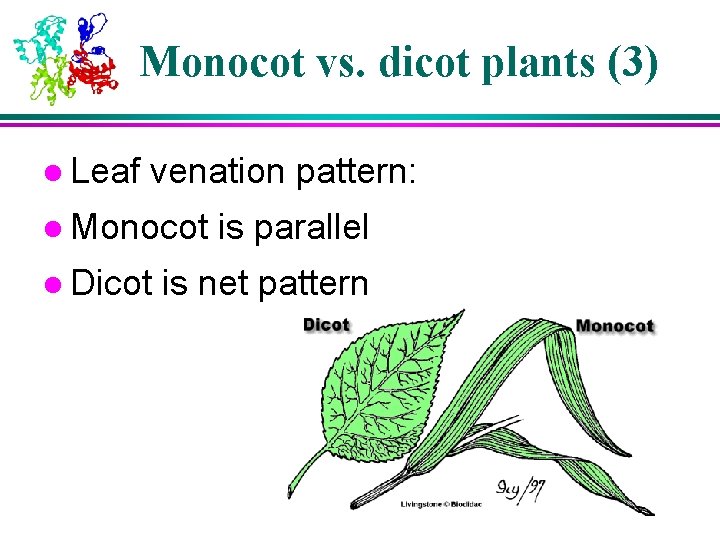
Monocot vs. dicot plants (3) l Leaf venation pattern: l Monocot l Dicot is parallel is net pattern
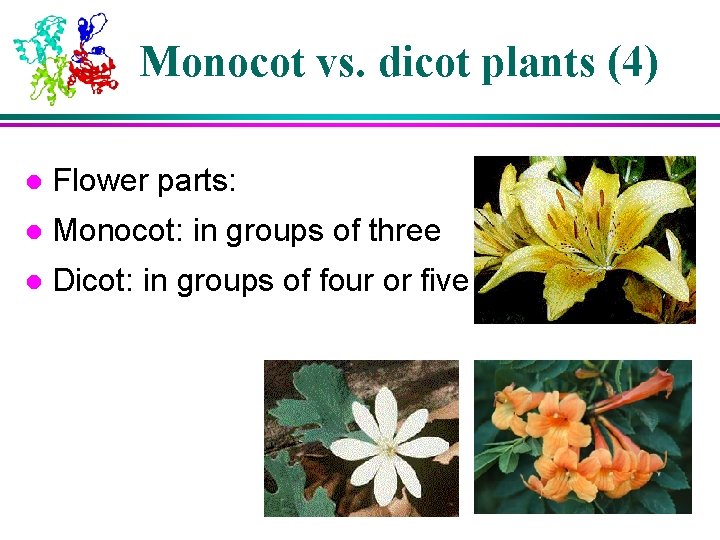
Monocot vs. dicot plants (4) l Flower parts: l Monocot: in groups of three l Dicot: in groups of four or five
Outline Evolution theory Ø Concept of phylogeny Ø Molecular clock Ø Types of trees Ø UPGMA Ø Parsimony Ø Maximum likelihood Ø An example for bird flu Ø
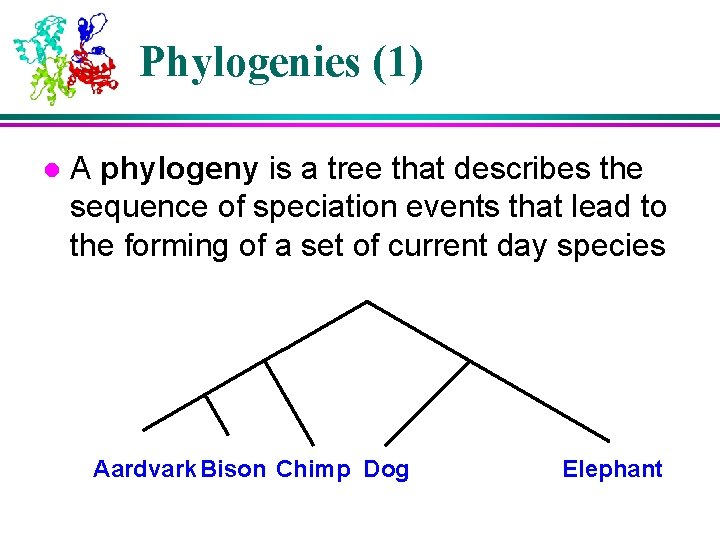
Phylogenies (1) l A phylogeny is a tree that describes the sequence of speciation events that lead to the forming of a set of current day species Aardvark Bison Chimp Dog Elephant
Phylogenies (2) l Leafs - current day species l Nodes - hypothetical most recent common ancestors l Edges length - “time” from one speciation to the next
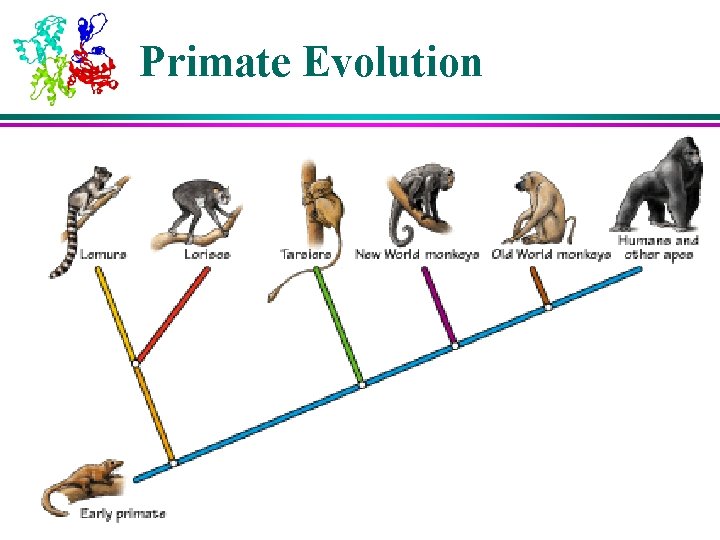
Primate Evolution
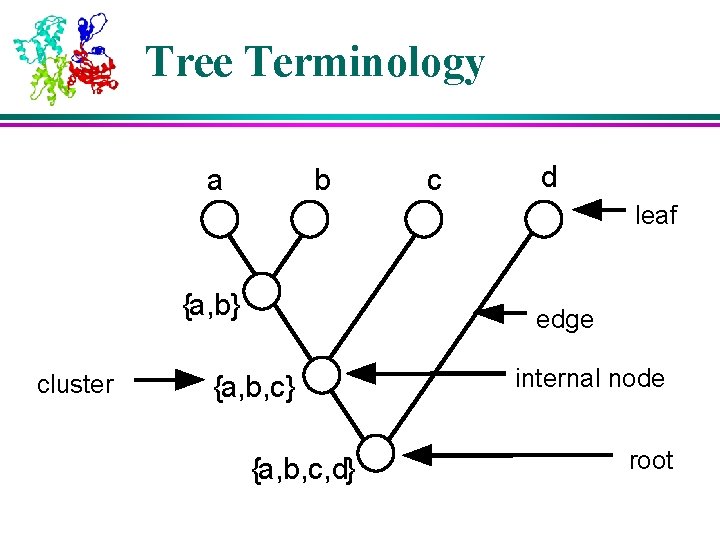
Tree Terminology a b c d leaf {a, b} cluster edge {a, b, c} {a, b, c, d} internal node root
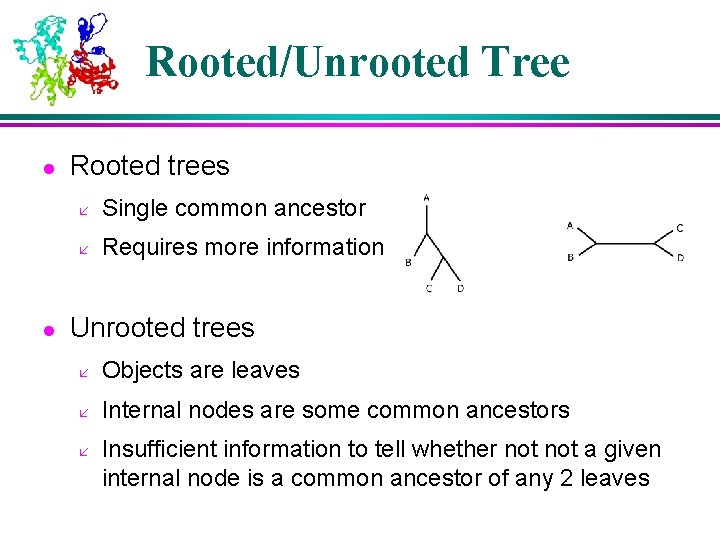
Rooted/Unrooted Tree l l Rooted trees å Single common ancestor å Requires more information Unrooted trees å Objects are leaves å Internal nodes are some common ancestors å Insufficient information to tell whether not a given internal node is a common ancestor of any 2 leaves
Motivation l l Understand the lineage of different species Organizing principle to sort species into a taxonomy l Understand how various functions evolved l Understand forces and constraints on evolution l Perform multiple sequence alignment l Predict gene function (phylogenetic footprint)
Tree Basis l Phylogenies are reconstructed based on comparisons between present-day objects l Two main aspects åTopology X How its interior nodes connect to one another and to the leaves åDistance X An estimate of the evolutionary distance between the nodes
Assumptions l homology reflects common ancestry l single common ancestor l treelike relationship exists l positional homology l independent processes l no reversals or convergence l molecular clock
Outline Evolution theory Ø Concept of phylogeny Ø Molecular clock Ø Types of trees Ø UPGMA Ø Parsimony Ø Maximum likelihood Ø An example for bird flu Ø
Molecular Clock Theory (1) l For any given protein, accepted mutations in the amino acid sequence for the protein occur at constant rate l Accepted = mutations that allow protein to function without death l Implication # of accepted mutations proportional to length of time interval i. e. relatively constant rate of accepted mutations within a protein
Molecular Clock Theory (2) l Rate of accepted mutations maybe different for different proteins (depending on their tolerance for mutations) l Different parts of a protein may evolve at different rates l Thus, if A and B differ by k accepted mutations, then roughly k/2 mutations have occurred since divergence
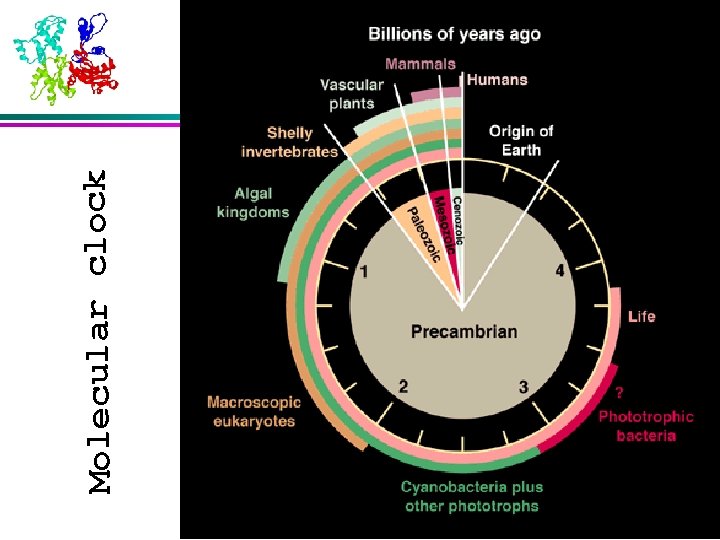
Molecular clock Science vol. 289
Outline Evolution theory Ø Concept of phylogeny Ø Molecular clock Ø Types of trees Ø UPGMA Ø Parsimony Ø Maximum likelihood Ø An example for bird flu Ø
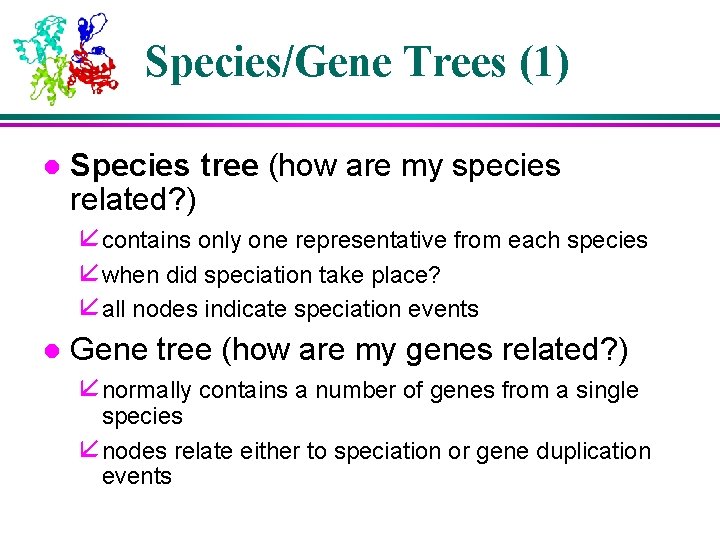
Species/Gene Trees (1) l Species tree (how are my species related? ) å contains only one representative from each species å when did speciation take place? å all nodes indicate speciation events l Gene tree (how are my genes related? ) å normally contains a number of genes from a single species å nodes relate either to speciation or gene duplication events
Species/Gene Trees (2) • Your sequence data may not have the same phylogenetic history as the species from which they were isolated • Different genes evolve at different speeds, and there is always the possibility of horizontal gene transfer (hybridization, vector mediated DNA movement, or direct uptake of DNA).
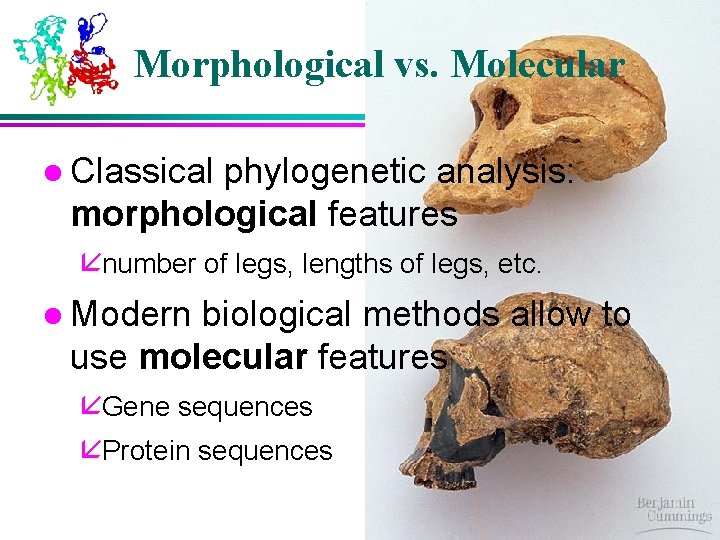
Morphological vs. Molecular l Classical phylogenetic analysis: morphological features ånumber of legs, lengths of legs, etc. l Modern biological methods allow to use molecular features åGene sequences åProtein sequences
Dangers in Molecular Phylogenies Gene/protein sequence can be homologous for different reasons: l Orthologs -- sequences diverged after a speciation event l Paralogs -- sequences diverged after a duplication event l Xenologs -- sequences diverged after a horizontal transfer (e. g. , by virus)
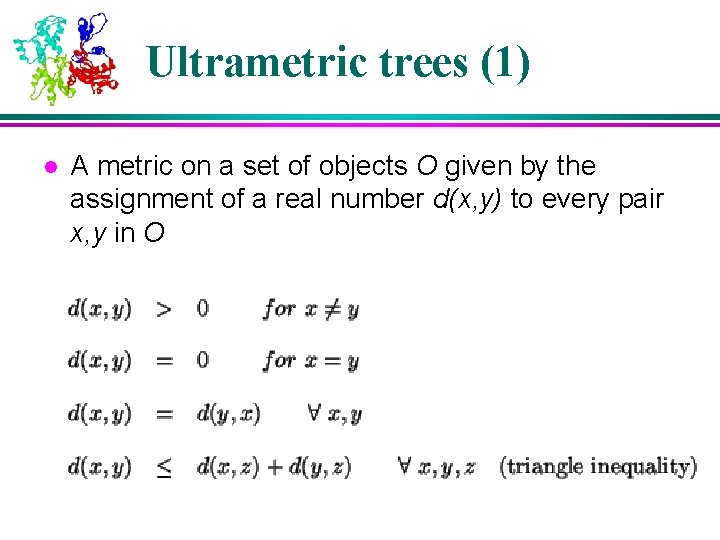
Ultrametric trees (1) l A metric on a set of objects O given by the assignment of a real number d(x, y) to every pair x, y in O
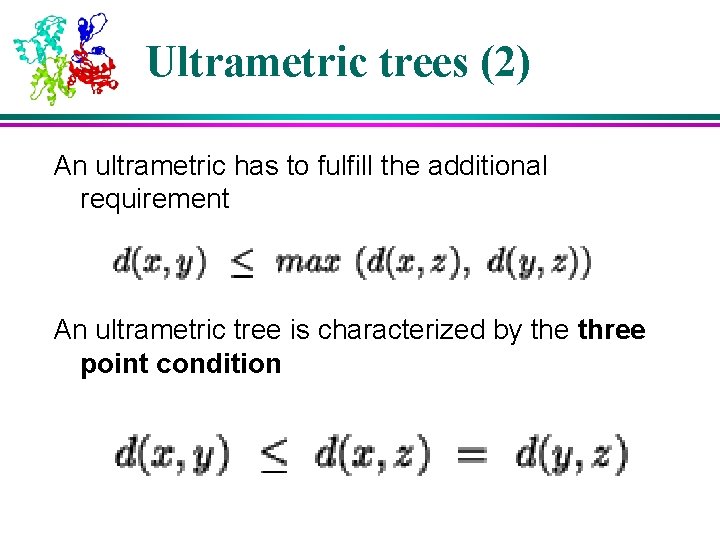
Ultrametric trees (2) An ultrametric has to fulfill the additional requirement An ultrametric tree is characterized by the three point condition
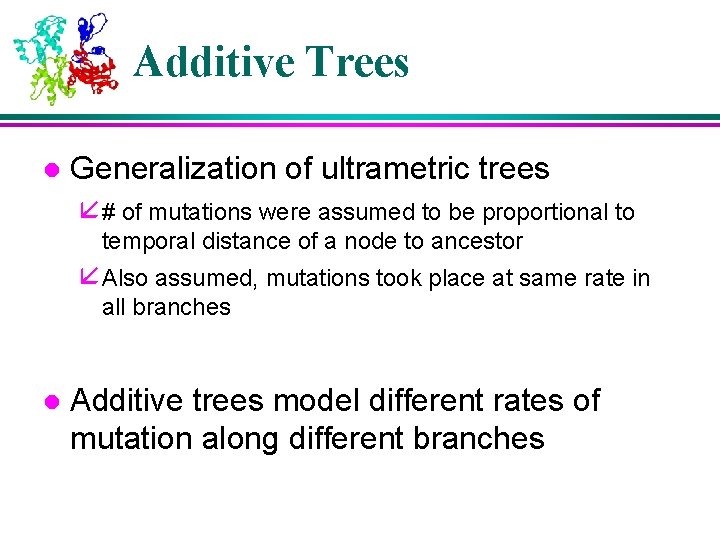
Additive Trees l Generalization of ultrametric trees å # of mutations were assumed to be proportional to temporal distance of a node to ancestor å Also assumed, mutations took place at same rate in all branches l Additive trees model different rates of mutation along different branches
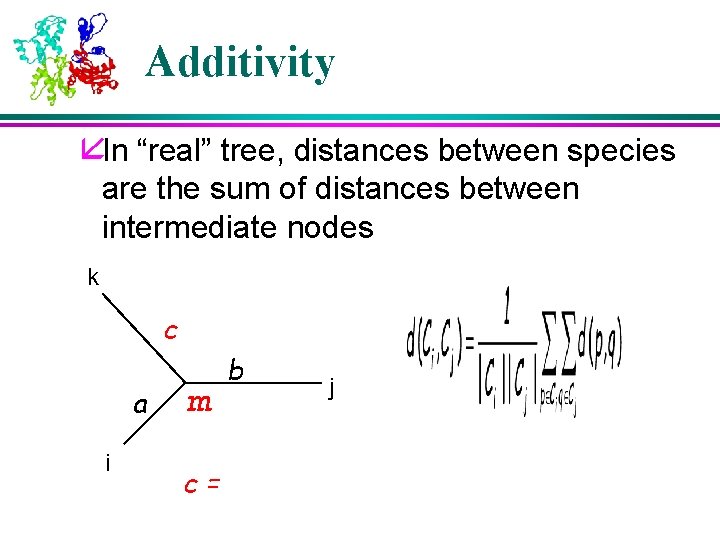
Additivity åIn “real” tree, distances between species are the sum of distances between intermediate nodes k c a i m c= b j
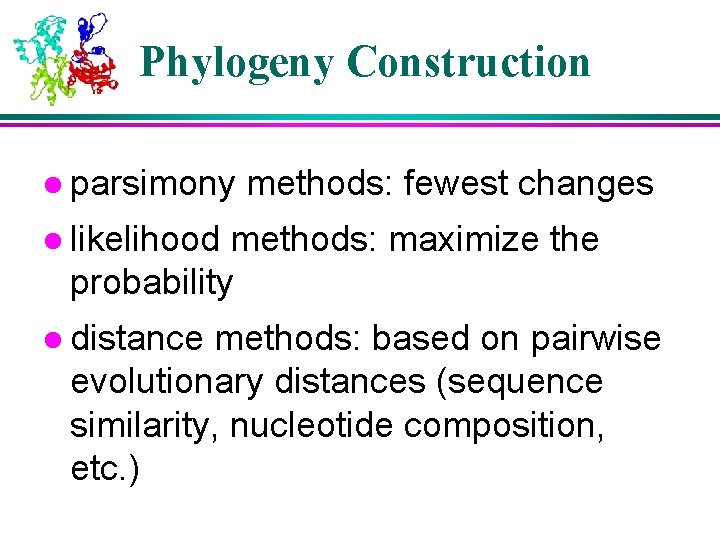
Phylogeny Construction l parsimony methods: fewest changes l likelihood methods: maximize the probability l distance methods: based on pairwise evolutionary distances (sequence similarity, nucleotide composition, etc. )
Outline Evolution theory Ø Concept of phylogeny Ø Molecular clock Ø Types of trees Ø UPGMA Ø Parsimony Ø Maximum likelihood Ø An example for bird flu Ø
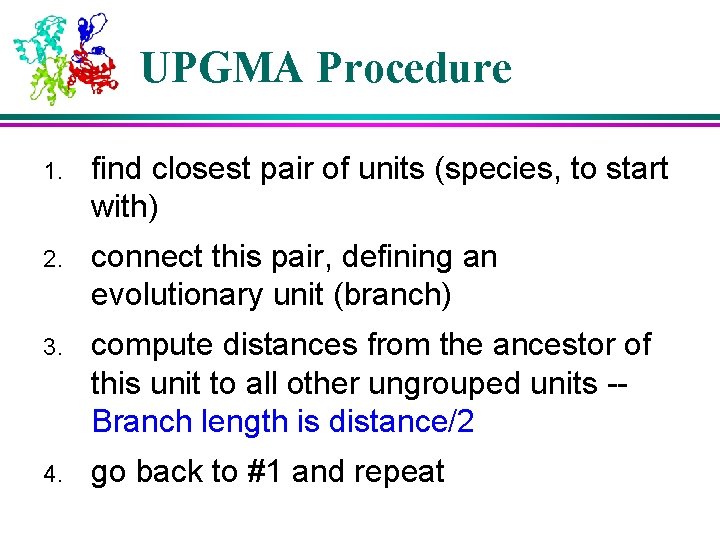
UPGMA is the unweighted pair group method with arithmetic mean l Distance matrix can come from (e. g) DNADNA hybridization, or be constructed from sequence data etc. l Iteratively group the most closely related groups. The average distance between elements in two groups is the distance between the groups. l
UPGMA Procedure 1. find closest pair of units (species, to start with) 2. connect this pair, defining an evolutionary unit (branch) 3. compute distances from the ancestor of this unit to all other ungrouped units -Branch length is distance/2 4. go back to #1 and repeat
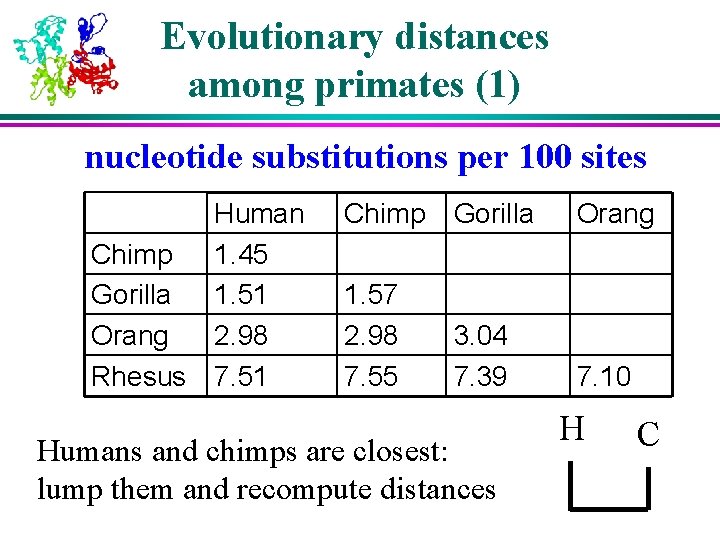
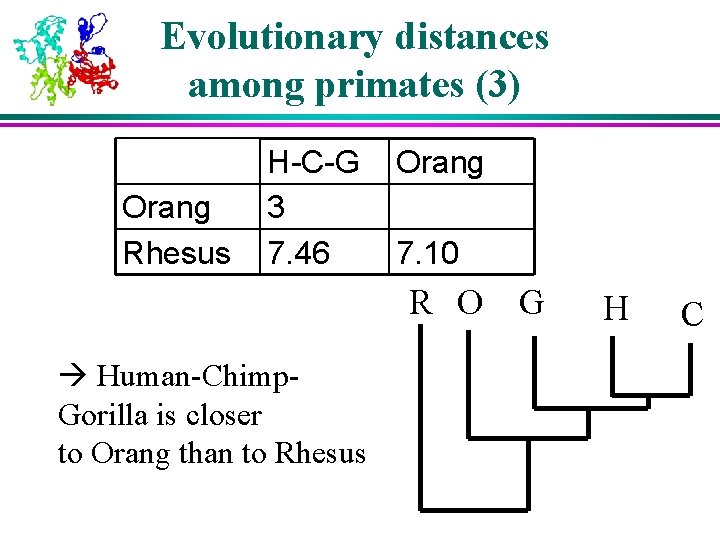
Evolutionary distances among primates (1) nucleotide substitutions per 100 sites Chimp Gorilla Orang Rhesus Human 1. 45 1. 51 2. 98 7. 51 Chimp Gorilla Orang 1. 57 2. 98 7. 55 3. 04 7. 39 7. 10 Humans and chimps are closest: lump them and recompute distances H C
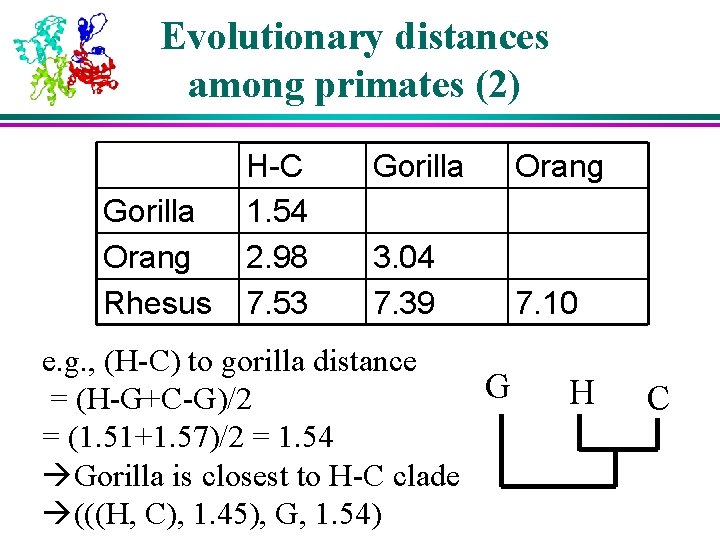
Evolutionary distances among primates (2) Gorilla Orang Rhesus H-C 1. 54 2. 98 7. 53 Gorilla Orang 3. 04 7. 39 7. 10 e. g. , (H-C) to gorilla distance G = (H-G+C-G)/2 = (1. 51+1. 57)/2 = 1. 54 Gorilla is closest to H-C clade (((H, C), 1. 45), G, 1. 54) H C
Evolutionary distances among primates (3) Orang Rhesus H-C-G 3 7. 46 Orang 7. 10 R O Human-Chimp. Gorilla is closer to Orang than to Rhesus G H C
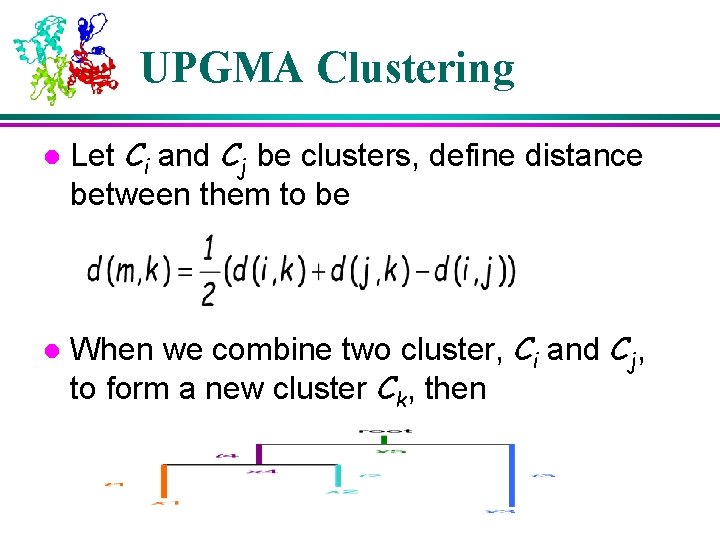
UPGMA Clustering l l Let Ci and Cj be clusters, define distance between them to be When we combine two cluster, Ci and Cj, to form a new cluster Ck, then
UPGMA: conclusions l UPGMA gives branch lengths or evolutionary distances as well as branching order l if (a big if) mutations occur at a constant rate, we can estimate dates of divergence from sequence differences
Outline Evolution theory Ø Concept of phylogeny Ø Molecular clock Ø Types of trees Ø UPGMA Ø Parsimony Ø Maximum likelihood Ø An example for bird flu Ø
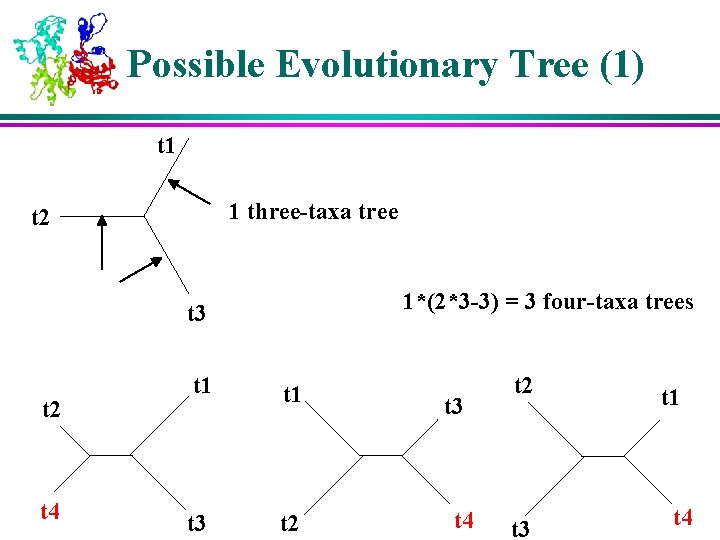
Possible Evolutionary Tree (1) t 1 1 three-taxa tree t 2 1*(2*3 -3) = 3 four-taxa trees t 3 t 2 t 4 t 1 t 3 t 2 t 3 t 4 t 2 t 3 t 1 t 4
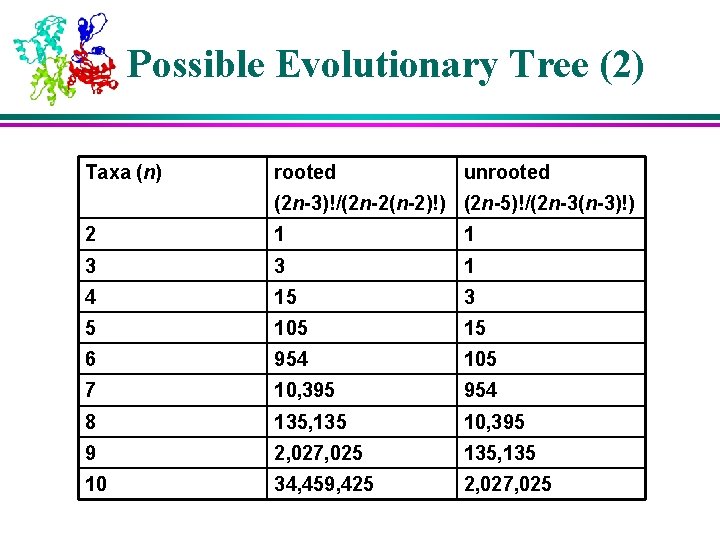
Possible Evolutionary Tree (2) Taxa (n) rooted unrooted (2 n-3)!/(2 n-2(n-2)!) (2 n-5)!/(2 n-3(n-3)!) 2 1 1 3 3 1 4 15 3 5 105 15 6 954 105 7 10, 395 954 8 135, 135 10, 395 9 2, 027, 025 135, 135 10 34, 459, 425 2, 027, 025
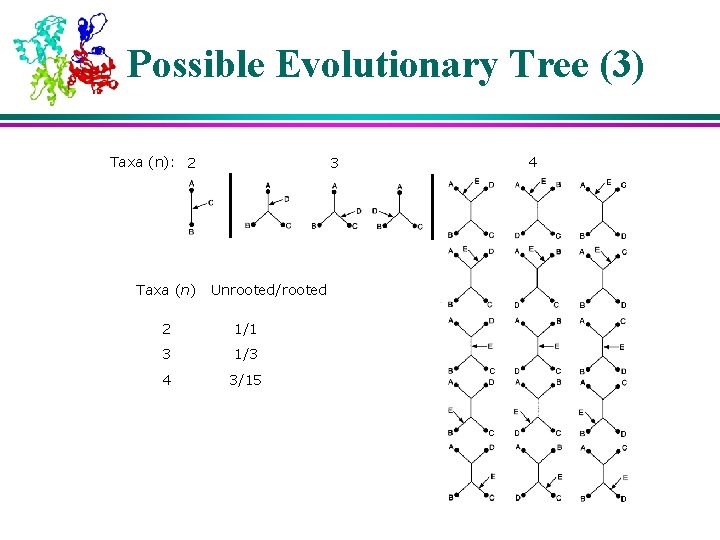
Possible Evolutionary Tree (3) Taxa (n): 2 Taxa (n) 3 Unrooted/rooted 2 1/1 3 1/3 4 3/15 4
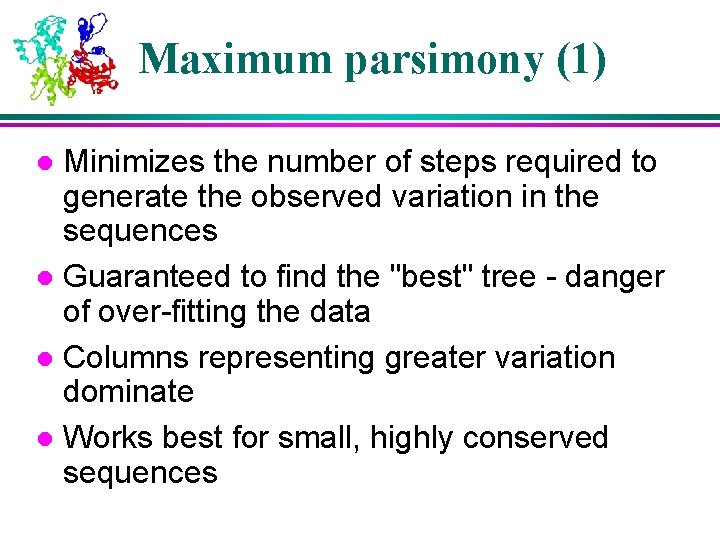
Maximum parsimony (1) Minimizes the number of steps required to generate the observed variation in the sequences l Guaranteed to find the "best" tree - danger of over-fitting the data l Columns representing greater variation dominate l Works best for small, highly conserved sequences l
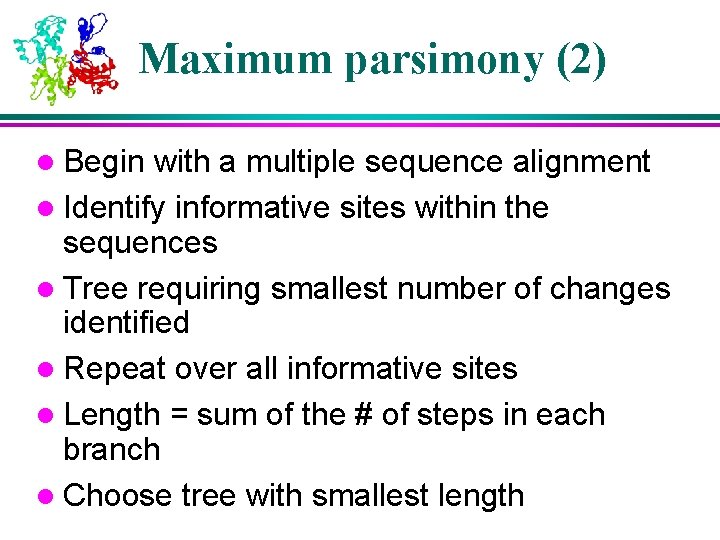
Maximum parsimony (2) l Begin with a multiple sequence alignment l Identify informative sites within the sequences l Tree requiring smallest number of changes identified l Repeat over all informative sites l Length = sum of the # of steps in each branch l Choose tree with smallest length
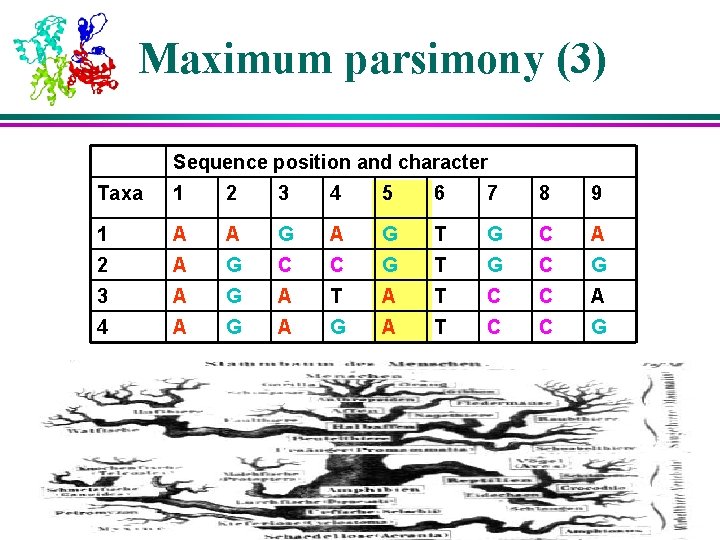
Maximum parsimony (3) Sequence position and character Taxa 1 2 3 4 5 6 7 8 9 1 A A G T G C A 2 A G C C G T G C G 3 A G A T C C A 4 A G A T C C G
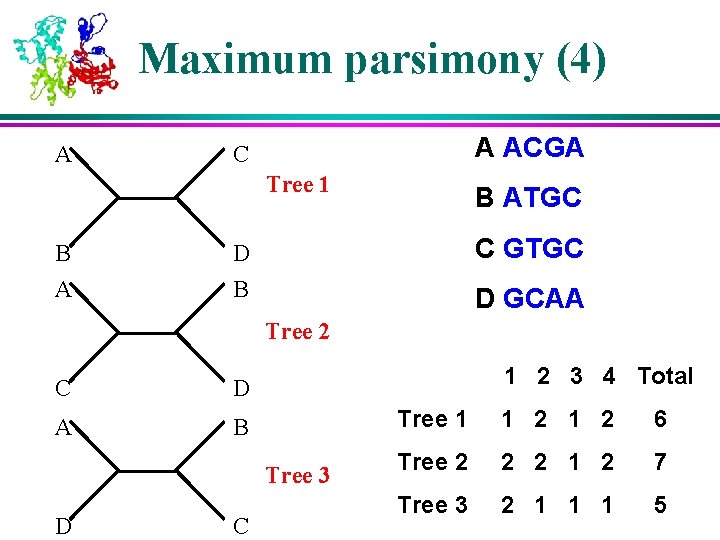
Maximum parsimony (4) A A ACGA C Tree 1 B ATGC B D C GTGC A B D GCAA Tree 2 C D A B 1 2 3 4 Total Tree 3 D C Tree 1 1 2 6 Tree 2 2 2 1 2 7 Tree 3 2 1 1 1 5
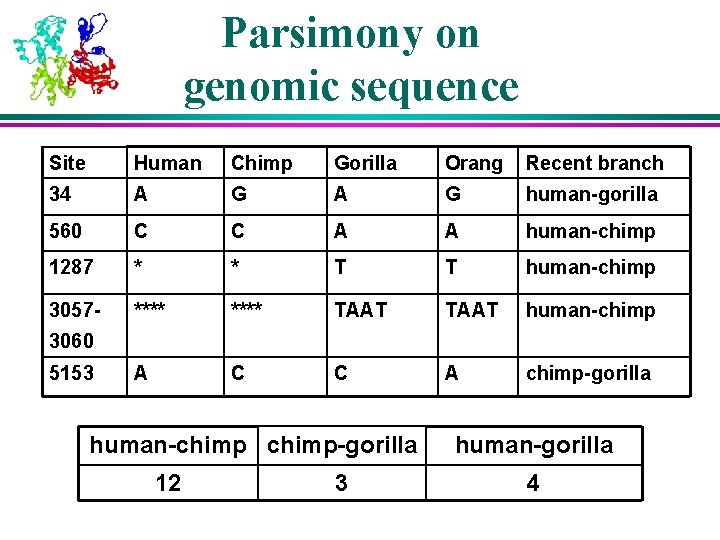
Parsimony on genomic sequence Site Human Chimp Gorilla Orang Recent branch 34 A G human-gorilla 560 C C A A human-chimp 1287 * * T T human-chimp 3057 - **** TAAT human-chimp A C C A chimp-gorilla 3060 5153 human-chimp-gorilla 12 3 human-gorilla 4
Outline Evolution theory Ø Concept of phylogeny Ø Molecular clock Ø Types of trees Ø UPGMA Ø Parsimony Ø Maximum likelihood Ø An example for bird flu Ø
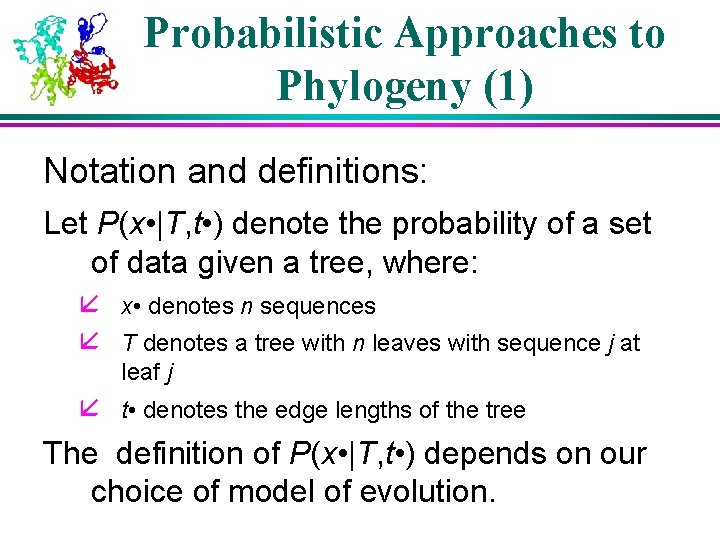
Probabilistic Approaches to Phylogeny (1) Notation and definitions: Let P(x • |T, t • ) denote the probability of a set of data given a tree, where: å x • denotes n sequences å T denotes a tree with n leaves with sequence j at leaf j å t • denotes the edge lengths of the tree The definition of P(x • |T, t • ) depends on our choice of model of evolution.
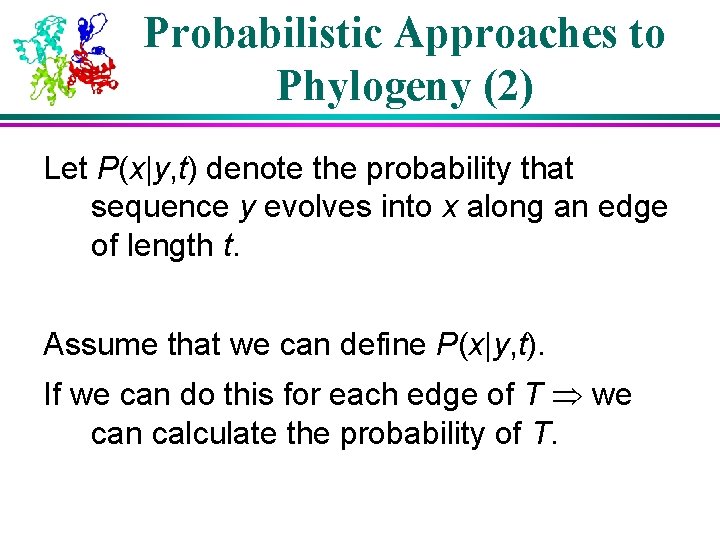
Probabilistic Approaches to Phylogeny (2) Let P(x|y, t) denote the probability that sequence y evolves into x along an edge of length t. Assume that we can define P(x|y, t). If we can do this for each edge of T we can calculate the probability of T.
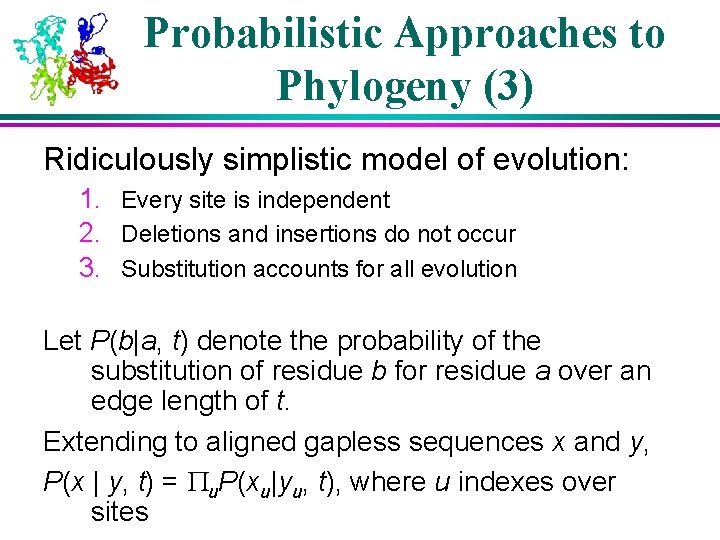
Probabilistic Approaches to Phylogeny (3) Ridiculously simplistic model of evolution: 1. Every site is independent 2. Deletions and insertions do not occur 3. Substitution accounts for all evolution Let P(b|a, t) denote the probability of the substitution of residue b for residue a over an edge length of t. Extending to aligned gapless sequences x and y, P(x | y, t) = Pu. P(xu|yu, t), where u indexes over sites
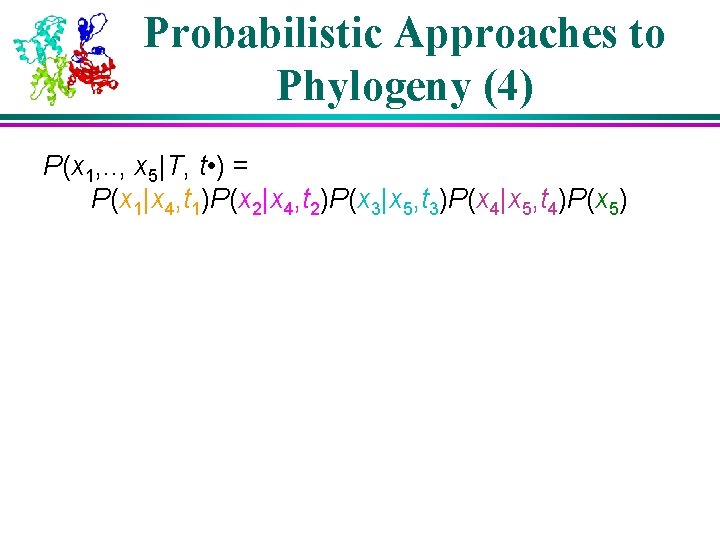
Probabilistic Approaches to Phylogeny (4) P(x 1, . . , x 5|T, t • ) = P(x 1|x 4, t 1)P(x 2|x 4, t 2)P(x 3|x 5, t 3)P(x 4|x 5, t 4)P(x 5)
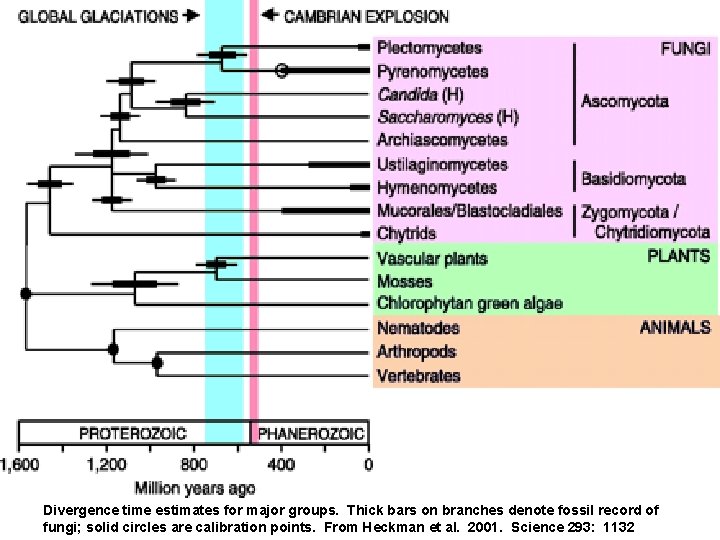
Divergence time estimates for major groups. Thick bars on branches denote fossil record of fungi; solid circles are calibration points. From Heckman et al. 2001. Science 293: 1132
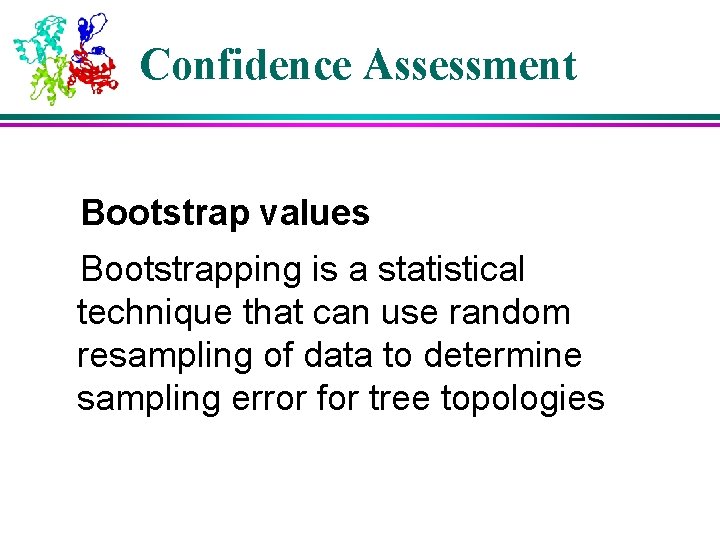
Confidence Assessment Bootstrap values Bootstrapping is a statistical technique that can use random resampling of data to determine sampling error for tree topologies
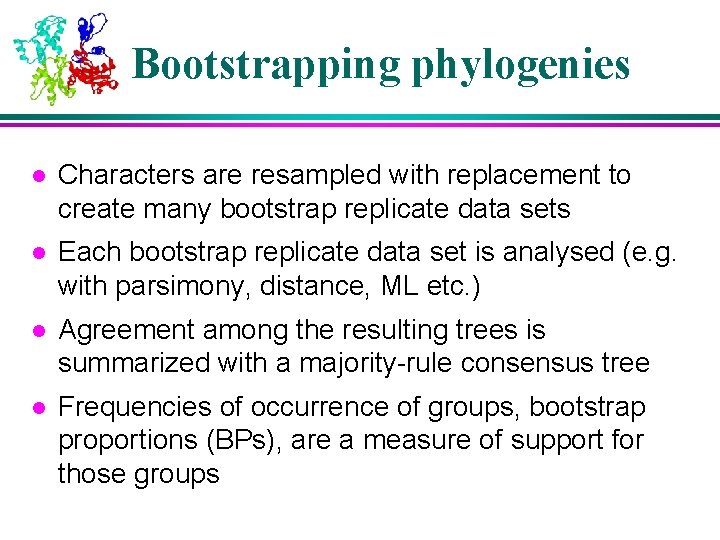
Bootstrapping phylogenies l Characters are resampled with replacement to create many bootstrap replicate data sets l Each bootstrap replicate data set is analysed (e. g. with parsimony, distance, ML etc. ) l Agreement among the resulting trees is summarized with a majority-rule consensus tree l Frequencies of occurrence of groups, bootstrap proportions (BPs), are a measure of support for those groups
Outline Evolution theory Ø Concept of phylogeny Ø Molecular clock Ø Types of trees Ø UPGMA Ø Parsimony Ø Maximum likelihood Ø An example for bird flu Ø
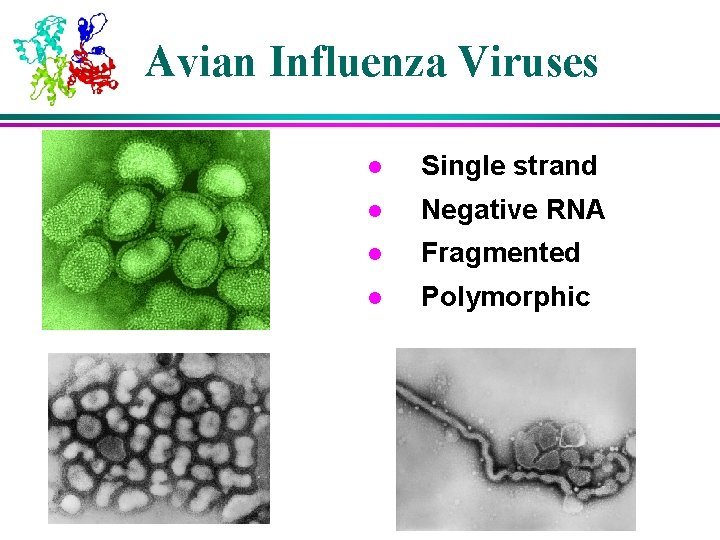
Avian Influenza Viruses l Single strand l Negative RNA l Fragmented l Polymorphic
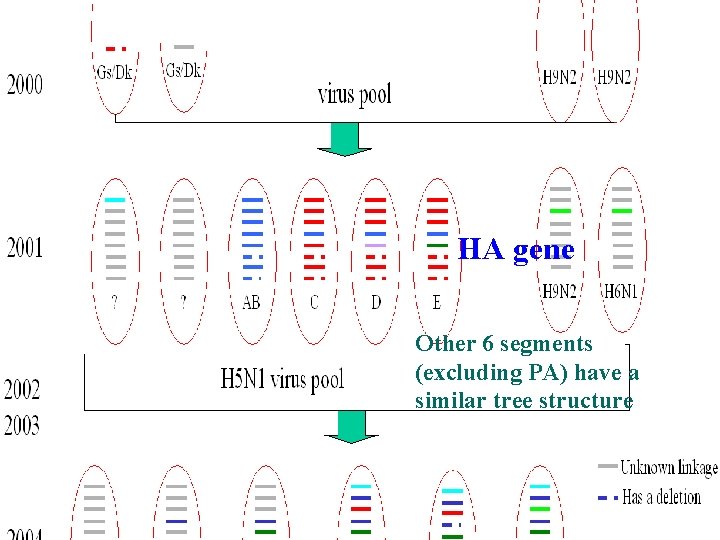
2003/2004 H 5 N 1 Pandemic Ø Highly pathogenic; can be transmitted to people and some cases are fatal Ø Virus: 8 genomic segments (PB 1, PB 2, PA, HA, NP, NA, M, and NS) and genetic reassortment Ø DNA sequences o South China Agricultural University, China o Genbank Ø Sources and evolution of flu viruses?
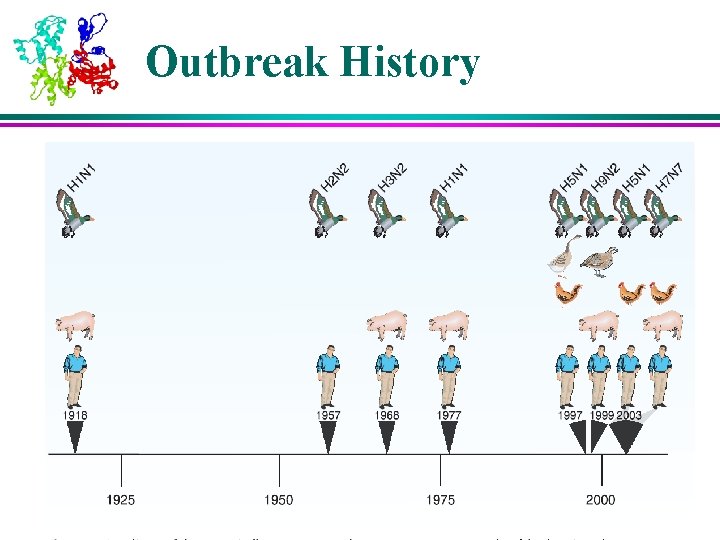
Outbreak History
HA HA gene Other 6 segments (excluding PA) have a similar tree structure
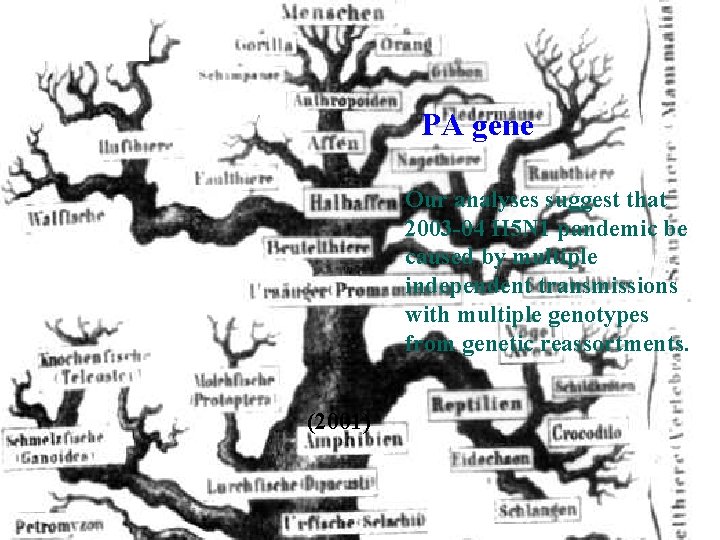
PA gene Our analyses suggest that 2003 -04 H 5 N 1 pandemic be caused by multiple independent transmissions with multiple genotypes from genetic reassortments. (2001)
Reading Assignments l Suggested reading: å Chapter 14 in “Warren J. Ewens and Gregory R. Grant: Statistical Methods in Bioinformatics – An Introduction. Springer. 2001”. l Optional reading: å Chapter 17 in “Dan Gusfield: Algorithms on Strings, Trees, and Sequences. Cambridge University Press. 1997”.
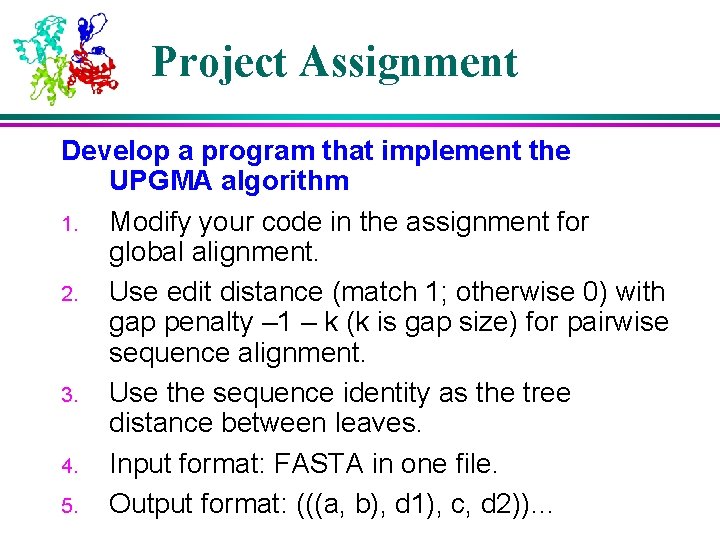
Project Assignment Develop a program that implement the UPGMA algorithm 1. Modify your code in the assignment for global alignment. 2. Use edit distance (match 1; otherwise 0) with gap penalty – 1 – k (k is gap size) for pairwise sequence alignment. 3. Use the sequence identity as the tree distance between leaves. 4. Input format: FASTA in one file. 5. Output format: (((a, b), d 1), c, d 2))…