Photosynthesis The Terrestrial Carbon Cycle Photosynthesis GPP Dark

Photosynthesis

The Terrestrial Carbon Cycle
 Dark Respiration in Leaves Net Photosynthesis Storage as Carbohydrates Plant Biomass Growth")
Photosynthesis (GPP) Dark Respiration in Leaves Net Photosynthesis Storage as Carbohydrates Plant Biomass Growth Respiration Maintenance Respiration
 GPP = PSN – Ra leaf (Gross Primary Production)")
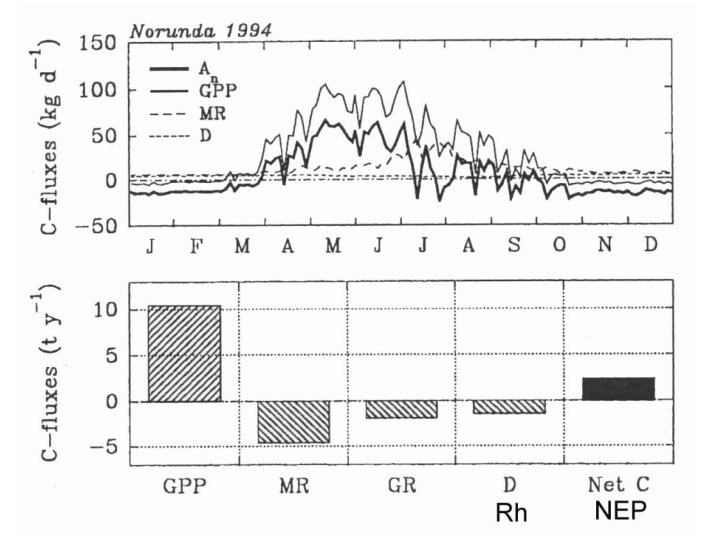
Carbon Budget Components PSN (Photosynthesis) GPP = PSN – Ra leaf (Gross Primary Production) NPP = GPP – Ra (Net Primary Production) NEP =NPP – Rh (Net Ecosystem Production) Raleaf NBP = NEP - disturbance (Net Biosphere Production) Ra = R growth + R maintenance (Autotrophic Respiration) Rh = R microbe + R herbivore (Heterotrophic Respiration) Harvest/Fire

PHOTOSYNTHESIS RESPIRATION CO 2 + H 2 O O 2 + SUGARS + O 2 H 2 O + CO 2 H 2 O CO 2 PLANTS ALGAE SOME BACTERIA ENERGY OF SUNLIGHT CO 2 SUGARS AND OTHER ORGANIC MOLECULES MOST LIVING ORGANISMS USEFUL CHEMICAL BOND ENERGY O 2 H 2 O
 CH 2 O + ½ O")
CO 2 + H 2 O + (e) CH 2 O + ½ O 2 Basic Components of Photosynthesis – PAR Interception ATP – Biochemistry (Rubisco) Ribulose bisphosphate (Ru. BP) – Absorption of CO 2 diffuses at 0. 625 * H 2 O because of difference in molecular mass 6 CO 2 + 12 H 2 O + (e) C 6 H 12 O 6 + 6 O 2 + 6 H 2 O

Electro-Magnetic Spectrum
 The point at which the rate of photosynthesis equals")
CO 2 Compensation Point (Γ) The point at which the rate of photosynthesis equals the rate of respiration of a leaf is the CO 2 compensation point. The CO 2 compensation point is affected by: Temperature O 2 Water stress
 CO 2 Compensation Point (Γ) Light Saturated Rates 150")
Net Photosynthesis (nmol g-1 s-1) CO 2 Compensation Point (Γ) Light Saturated Rates 150 Aspen – sun leaf 100 Oak – sun leaf Aspen – shade leaf 50 Oak – shade leaf 0 Compensation Points -50 0 0. 25 0. 50 0. 75 Fraction of full sunlight 1. 0 Fig. 18. 1 p. 490

Sun and Shade Leaves – American beech sun leaf shade leaf Fig. 6 -12 p. 105
 100% 50% 25% 12. 5% 6. 25%")
Leaf Area Index (LAI) 100% 50% 25% 12. 5% 6. 25%
 k = 0. 5 About half of the")
Beer’s Law IRad = Io e-k(LAI) k = 0. 5 About half of the remaining light is absorbed by each layer of leaves
")
Corticular and Wood Photosynthesis Pfanz et al. (2002)

Water Potential and Carbon Uptake Fig. 18. 4 p. 493

Gross Photosynthesis Leaf Respiration Topt Cold Limit -10 Heat Limit 0 10 20 30 40 Temperature ( C) 50 Respiration Photosynthesis Effects of Temperature 60 Similar to Fig. 18. 3 p. 492

Leaf Nitrogen Fig. 18. 5 p. 494

Redrawn from Kolke et al. 1991
 1000 1 7 21 63")
1000 100 10 10 Net photosynthesis (mmol g-1 s-1) 1000 1 7 21 63 10 70 490 1 10 100 1 -1 2 -1 Leaf nitrogen (mg g ) Specific leaf area (cm g ) Leaf life-span (months)

Potential vs. Actual GPP
 100 Month J F M A M")
Simulated Photosynthesis (mg CO 2 dm-2 day-1) 100 Month J F M A M J J A S O N D 100 Alaska Month J F M A M J J A S O N D Colorado 100 80 80 60 60 60 40 40 40 20 20 20 0 Growing Season 0 60 120 180 240 J F M A M J 100 J 300 A S O N D Utah 80 0 100 60 120 180 J F M A M J 240 J 300 360 Idaho 0 0 60 120 180 J F M A M J J 300 A S O N D Arizona 100 80 80 60 60 Growing Season 60 120 180 J F M A M J 240 J 300 360 A S O N D Montana 60 120 180 240 300 360 J 300 360 A S O N D Oregon Growing Season 0 0 100 60 120 180 J F M A M J 240 J 300 360 A S O N D Oregon 60 40 0 60 120 180 240 Growing Season 20 Growing Season 0 0 240 80 20 20 180 J F M A M J 20 Growing Season 40 40 120 40 0 360 60 60 0 240 0 80 20 Growing Season Oregon 100 40 20 0 A S O N D Growing Season A S O N D 60 40 0 Growing Season 80 60 100 0 360 80 Month J F M A M J J 300 360 0 0 60 120 180 240 300 360
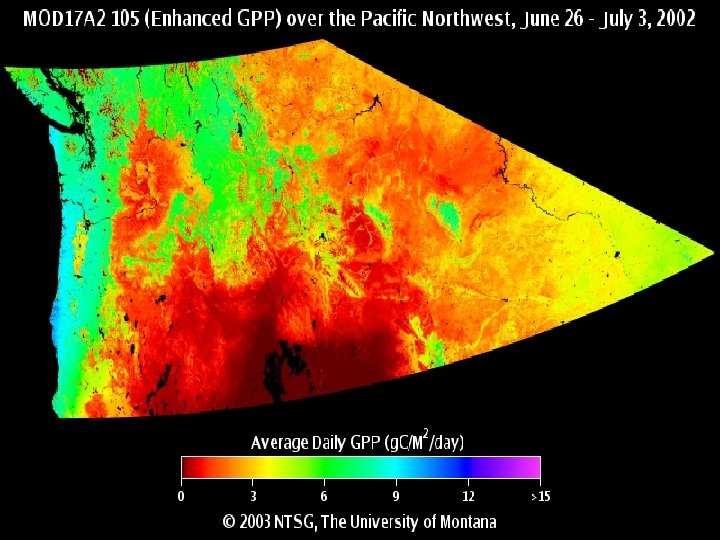

MODIS GPP at regional level Missoula

The Keeling Curve – CO 2
- Slides: 24