Photometry Estimation of analyte concentration on the basis

Photometry: Estimation of analyte concentration on the basis of light absorption

Photometry • Photometry is one of the most widely used analytical procedures in biochemistry. • For simple routine determination of small quantities of materials. The principle is based on physical laws of radiant energy or light. • Basic photometric principle can be applied in several analytical procedures, 1. Measurement of absorbed or transmitted light: colorimeter, spectrophotometery, atomic absorption, turbidometery 2. Measurement of emitted light, flame emission photometery: flourometery

Spectrophotometer • These are optical instruments for measurement of the absorption of light of a given wavelength of coloured substances in solution. • Beer's law makes it possible to calculate the concentration of the coloured substance in the solution. • Absorption photometers for work in aqueous solution work in the ultraviolet and visible ranges, from wavelength around 240 nm up to 750 nm. • The principle of spectrophotometers and filter photometers is that monochromatic light is allowed to pass through a container (cell) with optically flat windows containing the solution. • It then reaches a light detector, that measures the intensity of the light compared to the intensity after passing through an identical cell with the same solvent but without the coloured substance. • From the ratio between the light intensities, knowing the capacity of the coloured substance to absorb light, it is possible to calculate the concentration of the substance using Beer's law. • In spectrophotometers a monochromator (with prism or with grating) is used to obtain monochromatic light of one defined wavelength.

spectrophotometer

Beer’s Law and Spectrophotometry • Relates concentration to the optical measurement of ‘absorbance’ • Combined with spectrophotometry can be used to distinguish and compare different molecules in solution • Light of a particular wavelength enters the ‘sample’. • Light scatters from particles in solution reducing light transmission • Light is absorbed by molecules/particles and remitted at different wavelengths, reducing light transmission. • Absorptivity is usually specified only at λ max which is the wavelength at which light is most strongly absorbed by the light absorbing species. • Absorption is proportional to concentration

Beer’s Law

Beer Lambert Law • The Beer Lambert Law states that there is a linear relationship between the concentration of a solution and the absorbance of said solution. • For a spectrophotometer, the direct proportionality between absorbance and concentration must be established. • A calibration constant (K) may be derived and used to calculate the concentration of an unknown solution by comparing with a calibrating solution. A 1/ C 1= A 2/ C 2

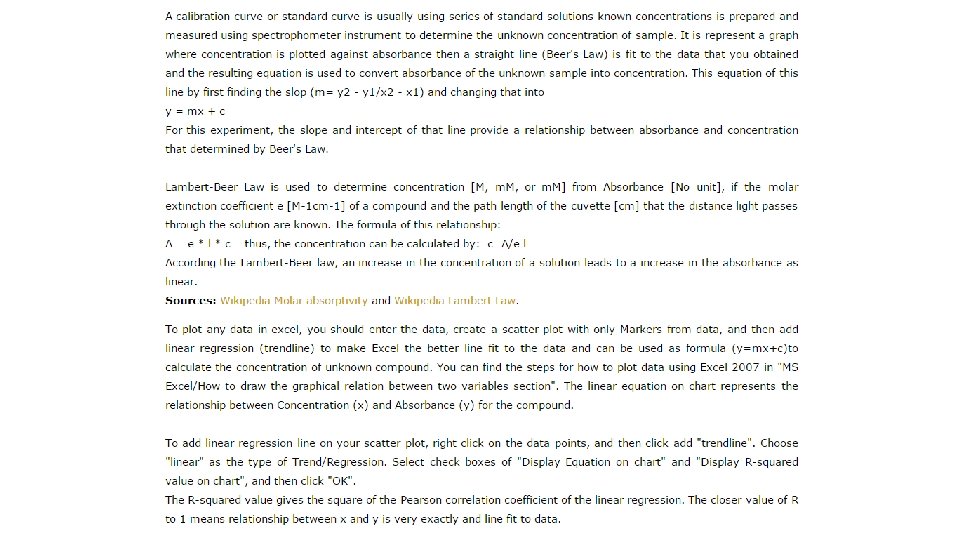
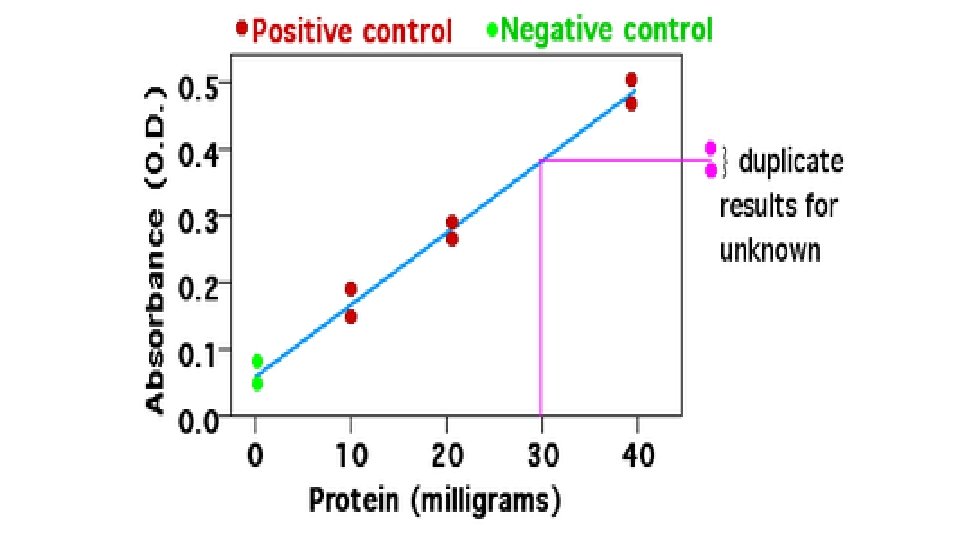
Analysis of unknown solution You will need: • Blank • Standard solution A standard solution is a solution in which the analyte concentration is accurately known. The absorbance of the standard solutions are measured and used to prepare a calibration curve. • Calibration curve : A calibration curve is a linear graph showing how the experimental observable variable (the absorbance in this case) varies with the concentration. • Calculation of concentration of unknown sample using calibration factor can use y=mx +c • Calculation of concentration of unknown sample using standard sample • Calculation of concentration of unknown sample using molar extinction coefficient

http: //www. biochemcs. com/beer's_law_scatter_plot_and_linear_regression. htm

HOW TO MAKE STANDARD CURVE • Multiple samples with known properties are measured and graphed, which then allows the same properties to be determined for unknown samples by interpolation on the graph. • The samples with known properties are the standards, and the graph is the standard curve. • Draw the points with protein concentrations as x values and the average absorbance as y values on a grid or graph paper • Draw a straight line through the points • Lookup the unknown protein concentration from the plot using the absorbance value of the unknown protein.

Estimation of Glucose EXP_ 2 ACh

Introduction Living system Organic compounds Carbon containing Assembling into complex form Inorganic Compounds And the rest Macromolecules Carbohydrates Proteins Building blocks of living organism Lipids Nucleic Acids 14

3. 2 Terminologies Carbohydrates Proteins Amino acids Lipids Nucleic Acids Fatty acid and glycerol Building Blocks/monomers Macromolecules Glucose 15 Phosphate group (p), Sugar, Bases

CARBOHYDRATE Types of Carbohydrates 1. Monosaccharides: Simple sugars consisting of three to seven carbon atoms. Example: Glucose, fructose, galactose 2. Disaccharides: Two monosaccharide molecules joined together form a disaccharide. Examples: • Sucrose (glucose+fructose) • Lactose (glucose+galactose) • Maltose (glucose+glucose) (Barley/germinating seeds) (Table Sugar) (Milk Sugar) 16

Functions of Carbohydrate hence glucose standard curve 1. Providing energy – carbohydrates are the preferred fuel source of our body. Carbohydrate -> glucose -> energy 2. Store energy – excess glucose is stored as glycogen in muscles and liver of animals (or starch in plants). 3. Build macromolecules – some sugar is used to make cell components such as DNA, RNA and ATP 4. Spare protein and fat for other uses – when energy demands cannot be met by carbohydrates, body starts breaking down proteins from muscles an other tissues 5. Dietary fiber – essential for the elimination of waste materials from the body and prevents constipation 17
 • Glucose+O 2+ H")
Glucose estimation in fruits • Trinder method Glucose oxidase (GOD) • Glucose+O 2+ H 2 O→ Gluconic acid +H 2 O 2 Peroxidase (POD) • 2 H 2 O 2 +4 -AAP+ Phenol→ Quinoneimine dye (red coloured) +4 H 2 O
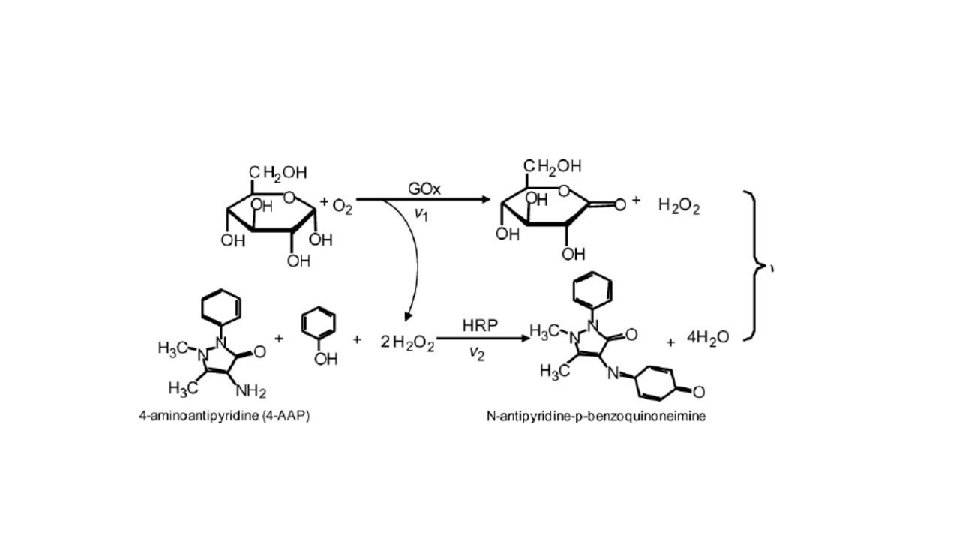

Procedure Buffer R Trisp. H 7. 4 92 mmol/l Phenol 0. 3 mmol/l Glucose oxidase (GOD) 15000 U/l (unit/liter) Peroxidase (POD) 1000 U/l 4 -aminophenazone (4 -AP) 2. 6 mmol/l Procedure: Specimen: grape juice Standard preparation: Using the given glucose standard, prepare 5 standards of different concentrations (25, 50, 100, 200 and 400 mg/dl) using serial dilution from a stock solution of 800 mg/dl.

Biochemistry Analyzer Calculation: Calculate the total Protein concentration by using the following formula: Total Protein concentration = (Absorbance of sample/Absorbance of standard) x [Standard] (Unit conversion: mg/dl x 1. 45 = ___ mmol/L) Expected value: Adults 6. 3 -8. 3 g/d. L Children > 1 year 6. 0 -8. 0 g/d. L < 1 year 4. 6 -7. 6 g/d. L

Home. Work • Graph preparation: Produce two graphs q Plot an abs vs. concentration graph using the values using a graph paper. (Attach the graph in your report. In exam you have to draw one by hand. So practice this. ) q. Plot an abs vs. concentration graph using the values using excel sheet ( paste the excel generated graph) • Calculation: • Calculate the concentration of SAMPLE A & B from the standard curve, (can use Beer-Lambart law & y= mx+C) • Any limitations you faced? How could you improve them? • Elaborate the purpose of this experiment. • How does your standard curve look like? Why? Explain if there is any distortion. • Comment on your results and on the method. Discuss sources of error. • Why do you need to prepare dilutions of the fruit juice? • Find out hazardous property of each of the chemicals used. What are the precautions you need to take while working with hazardous chemicals?

- Slides: 23