Photoacoustic Spectroscopy of Pressure and Temperature Dependence in

 in the O")
 Collision Induced Absorption (CIA) When")


")


.")


 10 5 0 Unlocked High. Finesse Wavemeter • Calibrated with")


- Slides: 23
Photoacoustic Spectroscopy of Pressure- and Temperature. Dependence in the O 2 A-Band Matthew J. Cich 1, Elizabeth M. Lunny 2, Gautam D. Stroscio 2, Thinh Q. Bui 3, Caitlin Bray 4, Daniel Hogan 5, Priyanka Rupasinghe 6, Timothy J. Crawford 1, David 7, Joseph Hodges 7, Brian Drouin 1, Charles Miller 1, Mitchio Okumura 2 A. Long 1 Jet Propulsion Laboratory, California Institute of Technology, Pasadena, CA 2 Division of Chemistry and Chemical Engineering, California Institute of Technology, Pasadena, CA 3 JILA, National Institute of Standards and Technology and Univ. of Colorado Department of Physics, University of Colorado, Boulder, CO 4 Department of Chemistry, Wesleyan University, Middletown, CT 5 Department of Applied Physics, Stanford University, Stanford, CA 6 Physical Sciences, Cameron University, Lawton, OK 7 Chemical Sciences Division, National Institute of Standards and Technology, Gaithersburg, MD © 2017. All Rights Reserved.
OCO-2 Oxygen Requirement • OCO‐ 2 requires accurate spectroscopy (0. 1%) in the O 2 A‐Band • Drouin et al. study 1 resulted in ~0. 5% accuracy • Line Mixing (LM) and Collision Induced Absorption(CIA) have effect ~1% and are leading contributors to remaining issues O 2 A-Band 390 THz 391 392 393 1 Drouin et al. DOI: 10. 1016/j. jqsrt. 2016. 037. 394 395 oco. jpl. nasa. gov/images/ocov 2/OCO_column. jpg
Line Mixing and Collision- Induced Absorption Line Mixing (LM) Collision Induced Absorption (CIA) When two nearby lines have interacting Weak ‘continuum’ absorption quantum levels, stronger lines will steal underneath the A‐band caused by intensity from weaker lines, and both collision‐allowed transitions. become asymmetric. Strongest LM interactions (cm-1 atm-2) 5 e-7 CIA (air) included in fit 0
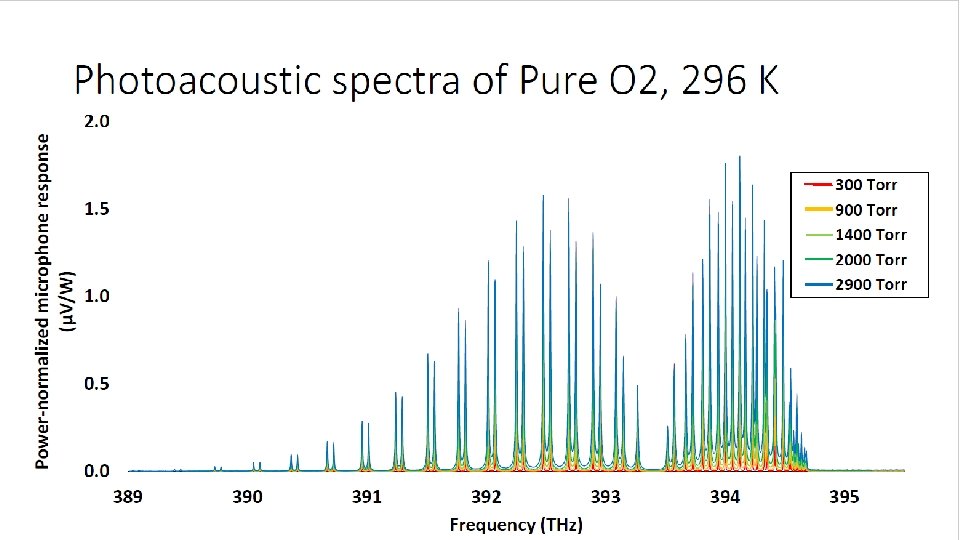
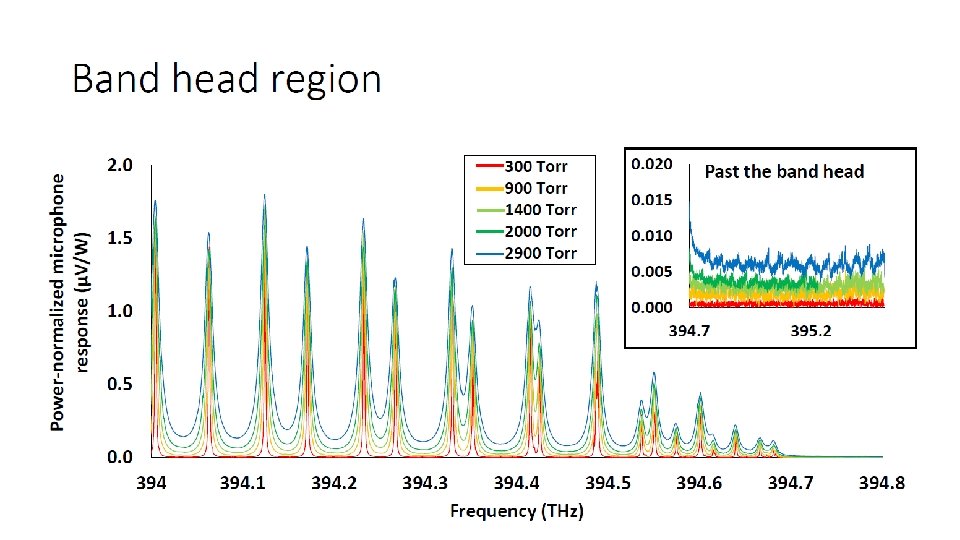
An Experiment Designed to Measure LM and CIA Photoacoustic Spectroscopy Advantages • Zero baseline: Ideal for measuring LM/CIA • Large dynamic range: <100 Torr to >4 atm. without saturating Ultimate Goals: • High frequency resolution measurements over full A‐Band • Atmospherically relevant temperatures ~220 K‐ 296 K LM and CIA have >1% effect on satellite retrievals and must be better characterized using new laboratory data.
Photoacoustic Resonator Microphone to lock‐in amplifier, 1. 5 k. Hz Amplified CW 759‐ 769 nm Normalized Microphone Response 0. 6 W 1. 0 0. 8 Acousto‐optic Modulator 1. 5 k. Hz Amplitude Modulated 1. 5 k. Hz 0. 6 0. 4 0. 2 0. 0 0. 5 1. 5 2. 5 Modulation Frequency (k. Hz) absorption →thermal expansion →pressure wave → sound Photoacoustic signal depends on: • response function dependent on microphone properties, resonator shape, and gas composition • absorption quenching efficiency • modulated laser power Cell design: Gillis, Havey, Hodges, Rev. Sci. Instrum. 81, 064902 (2010)
Spectrometer Properties • Modehop‐ free scanning across 5+ THz A‐Band • 2 MHz frequency resolution: WLM calibrated with stabilized He. Ne • ~1 day‐long scans with evenly spaced points • Pressure range: ~100‐ 3000+ Torr • Temperatures: Stability at 0. 6 K over 1 day • Planned lower temperature measurements 193 – 296 K (microphone limited)
Analysis Overview • Analysis done with Labfit multispectrum fitting software • Speed‐Dependent Voigt with Line Mixing and CIA • Will compare to Drouin et al. ’s fit: • Line Mixing: separate matrices for self‐ and foreign‐ gasses, P‐ and R‐ Branch, • Mixing between doublets and between P/R branch has been neglected • Matrices are fixed to theory except for matrix‐wide scaling factors • CIA: • Determined by empirical fit to TCCON spectra (ground‐based FTS measurements of the atmosphere)
Comparison to previous dataset Pure O 2 in published A‐Band fit Technique Pressure (Torr) Temp (K) CRDS 1 FTIR Pure O 2, PAS Pressure (Torr) Temp (K) 295 309 297 200 297 500 297 FTIR 503 298 901 297 FTIR 415 205 1404 297 FTIR 794 207 2036 297 FTIR 721 189 2894 297 FTIR 1000 189 • PAS spectra will be added to existing fit • PAS will benefit from intensity constraints to FTIR/CRDS data • FTIR/CRDS will benefit from zero baseline and high pressure of PAS
Spectrum of Pure O 2 in Transmission Transformed from PAS signal to % transmission: strongest lines are 98% transmission Transmission 100% Measurement 99% 97. 5% 13000 13050 Wavemeter (cm‐ 1)13100 Wavenumber (cm-1) 13150
FTIR and PAS Datasets: Fit of PAS Spectra to Drouin parameters lead to significant residuals Transmission 100% Residuals 0% 20% ‐ 20% FTIR PAS(very small) P 17 FTIR PAS weighted fit residuals, Drouin fit 13000 13050 13100 Wavenumber (cm-1) 13150 • FTIR and PAS residuals are weighted by maximum absorption (PAS 2%, FTIR 100%) • PAS noise levels are much lower but there are systematic residuals at each peak • Will focus on P 17 doublet for a preliminary look at what we can learn
Largest PAS residuals are frequency-related 300 Torr 900 Torr 1400 Torr 2000 Torr 2900 Torr ALL FTIR Residuals Transmission 100% 99% 10% ‐ 10% PAS transmission (FTIR omitted) weighted fit residuals, Drouin fit weighted fit 13059 residuals, Drouin 13058 13060 fit 13061 Wavenumber (cm-1) 13062 • Pressure shift is a major contributor to the PAS residuals, clear pressure trends (band‐wide) • Absolute position is also a factor: • Drouin fit has mild disagreement with HITRAN 2012 and HITRAN 2016 (~5‐ 10 MHz)
Adjusting self pressure shift improves PAS fit ‐ 10% weighted fit residuals, Drouin fit 10% Residuals 300 Torr 900 Torr 1400 Torr 2000 Torr 2900 Torr ALL FTIR Residuals 10% ‐ 10% weighted 13058 fit residuals, PAS-driven shift, position 13059 13060 13061 Wavenumber (cm-1) 13062 • 2 changes to the Drouin fit : 1. PAS data was fit for self‐shift, this shift was applied to the global fit 2. FTIR calibration was frequency offset to match PAS, FTIR residual structure unchanged • Line position WAS NOT changed from Drouin fit, and is not a perfect match • Majority of remaining PAS residual structure is due to intensity effects, LM, and CIA.
Is PAS Sensitive to Line Mixing? PAS residuals only, shifted Drouin fit, with and without Line Mixing Residuals 1. 5% ‐ 1. 5% 13056 300 Torr 900 Torr 1400 Torr 2000 Torr 2900 Torr 13058 13060 Wavenumber (cm-1) 13062 13064 • LM has a large effect on asymmetry in this doublet • 900 Torr spectrum is acutely sensitive to LM, with greater effects at higher pressures
Is PAS Sensitive to Collision-Induced Absorption? Residuals 0. 1% PAS residuals only, shifted Drouin fit, with and without CIA ‐ 0. 6% 300 Torr 900 Torr 1400 Torr 2000 Torr 2900 Torr 13056 13058 13060 Wavenumber (cm-1) 13062 • CIA affects baseline levels consistent with pressure as expected • Very low impact on pressures overlapping with previous dataset 13064
Acknowledgments • This work was supported by the National Aeronautics and Space Administration (NASA). Part of the research was performed at Jet Propulsion Laboratory (JPL) under contract with NASA. • M. Cich’s research was supported by an appointment to the NASA Mitchio Okumura’s Research Group, Caltech Postdoctoral Program at the Jet Propulsion Laboratory, @Okumura. Group on Twitter administered by Universities Space Research Association under contract with NASA • This material is based upon E. Lunny’s work supported by the National Science Foundation Graduate Research Fellowship under Grant No. DGE‐ 1144469 Any opinion, findings, and conclusions or recommendations expressed in this material are those of the authors(s) and do not necessarily reflect the views of the National Elizabeth Lunny Gautam Stroscio Science Foundation.
Line Mixing and Collision-Induced Absorption • FTIR noise is very close to the level of the CIA and LM effects on the spectra. • PAS noise is much lower and especially the high pressure spectra are very sensitive to both LM and CIA
Frequency Scanning Laser current: ~100 MHz Range <50 k. Hz precision • Scans have constant step size, currently 400 MHz • Modehops (cavity mode/grating mismatch) avoided by adjusting laser current • Scanning software uses current, piezo, and stepper to collect full A‐Band Piezo: 18 GHz Range 2 MHz precision (current adjustment) (piezo, stepper adjustment) www. sacher‐laser. com/downloads/ Stepper motor: 5+ THz Range, GHz precision 389. 9 390. 4 390. 9 391. 4 391. 9 392. 4 THz 392. 9 393. 4 393. 9 394. 4 394. 9
Frequency Stability Drift (MHz) 10 5 0 Unlocked High. Finesse Wavemeter • Calibrated with stabilized He‐Ne • 2 MHz accuracy • 120 Hz+ scan rate Locked -5 0 50 100 Time (s) 150 • Laser current is modulated at 120 Hz to lock to targeted λ‐meter reading • 0. 5 s averaging, <2 MHz standard deviation
Temperature control plans Resonator Temperature control housing Targeted range: 220 K‐ 296 K Targeted stability: >1 K (Still in development, 0. 6 K achieved over 5 hrs at 282 K) Vacuum chamber Room T, no stabilization: 0. 6 K in 24 hrs drift (currently achievable)
Fitting Photoacoustic Spectra Labfit used to ultimately include this data in the larger A‐band multispectrum fit Measurement Labfit Input Fit Parameters