
PHENIX Event Rate and Checks Stefan Bathe for
PHENIX Event Rate and Checks Stefan Bathe for PHENIX RHIC Machine-Experiment Meeting 05/04/2010
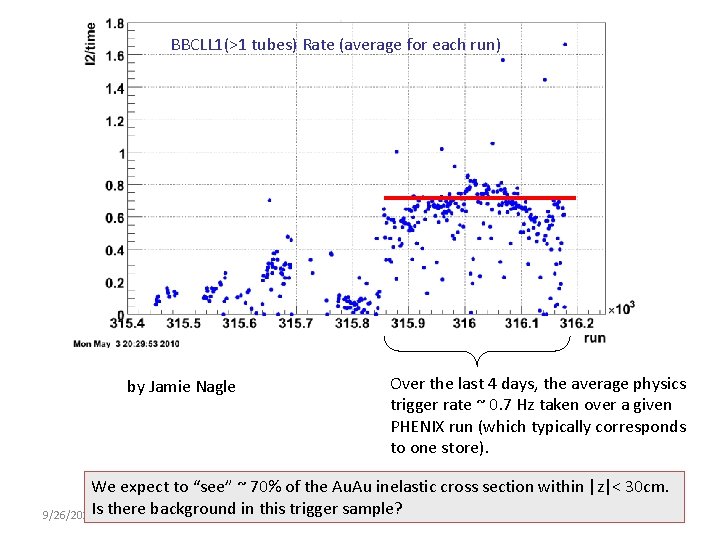
BBCLL 1(>1 tubes) Rate (average for each run) by Jamie Nagle Over the last 4 days, the average physics trigger rate ~ 0. 7 Hz taken over a given PHENIX run (which typically corresponds to one store). We expect to “see” ~ 70% of the Au. Au inelastic cross section within |z|< 30 cm. 9/26/2020 Is there background in this trigger sample? 2
PHENIX-STAR Comparison • STAR has reported similar rate of good events from offline (vertex) validation • STAR’s vertex cut is +/- 75 cm (cf. +/- 30 cm in PHENIX); this should give factor 2. 4 larger rate • How can this be reconciled? • Our part: check PHENIX rate RHIC Machine/Experiment Meeting 05/04/2010 Stefan Bathe 3
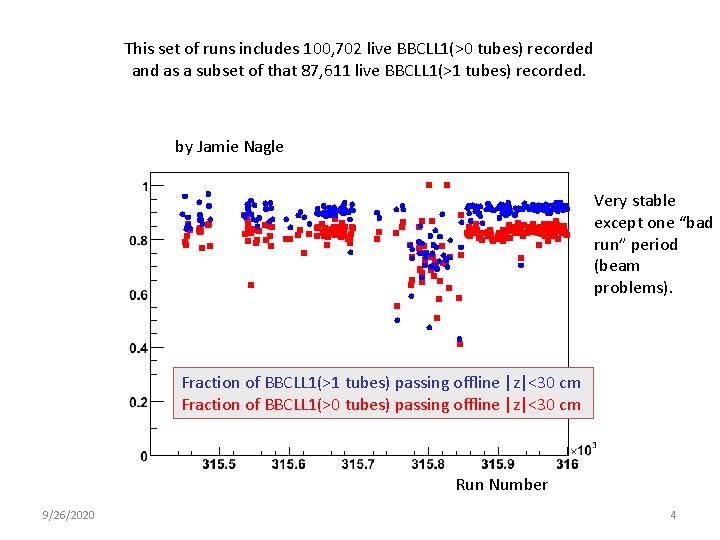
This set of runs includes 100, 702 live BBCLL 1(>0 tubes) recorded and as a subset of that 87, 611 live BBCLL 1(>1 tubes) recorded. by Jamie Nagle Very stable except one “bad run” period (beam problems). Fraction of BBCLL 1(>1 tubes) passing offline |z|<30 cm Fraction of BBCLL 1(>0 tubes) passing offline |z|<30 cm Run Number 9/26/2020 4
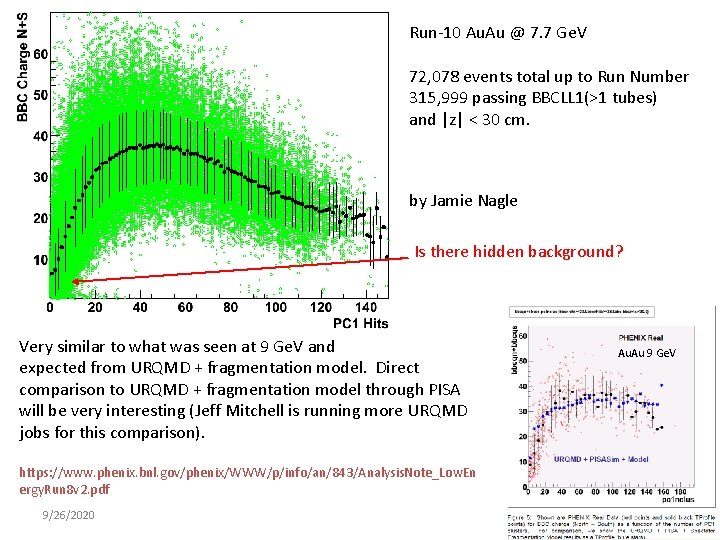
Run-10 Au. Au @ 7. 7 Ge. V 72, 078 events total up to Run Number 315, 999 passing BBCLL 1(>1 tubes) and |z| < 30 cm. by Jamie Nagle Is there hidden background? Very similar to what was seen at 9 Ge. V and expected from URQMD + fragmentation model. Direct comparison to URQMD + fragmentation model through PISA will be very interesting (Jeff Mitchell is running more URQMD jobs for this comparison). Au. Au 9 Ge. V https: //www. phenix. bnl. gov/phenix/WWW/p/info/an/843/Analysis. Note_Low. En ergy. Run 8 v 2. pdf 9/26/2020 5
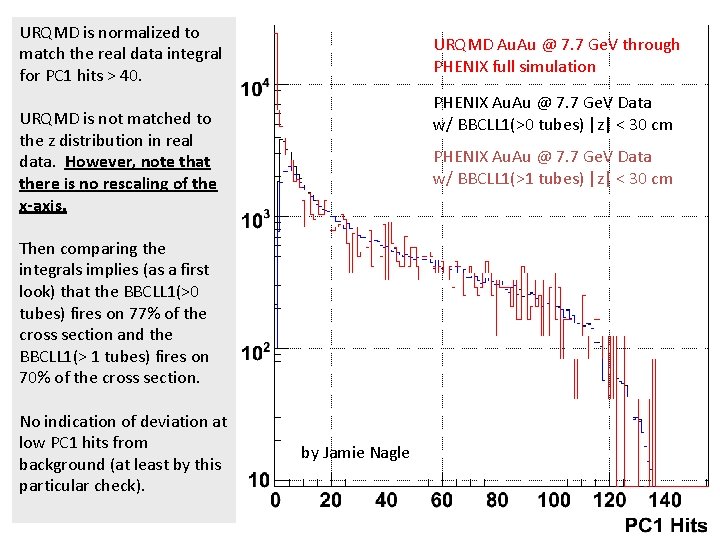
URQMD is normalized to match the real data integral for PC 1 hits > 40. URQMD Au. Au @ 7. 7 Ge. V through PHENIX full simulation PHENIX Au. Au @ 7. 7 Ge. V Data w/ BBCLL 1(>0 tubes) |z| < 30 cm URQMD is not matched to the z distribution in real data. However, note that there is no rescaling of the x-axis. PHENIX Au. Au @ 7. 7 Ge. V Data w/ BBCLL 1(>1 tubes) |z| < 30 cm Then comparing the integrals implies (as a first look) that the BBCLL 1(>0 tubes) fires on 77% of the cross section and the BBCLL 1(> 1 tubes) fires on 70% of the cross section. No indication of deviation at low PC 1 hits from background (at least by this particular check). 9/26/2020 by Jamie Nagle 6
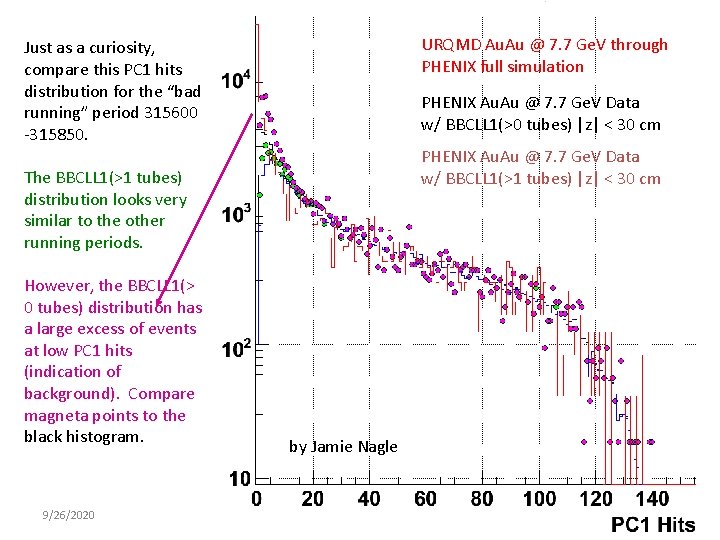
URQMD Au. Au @ 7. 7 Ge. V through PHENIX full simulation Just as a curiosity, compare this PC 1 hits distribution for the “bad running” period 315600 -315850. PHENIX Au. Au @ 7. 7 Ge. V Data w/ BBCLL 1(>0 tubes) |z| < 30 cm PHENIX Au. Au @ 7. 7 Ge. V Data w/ BBCLL 1(>1 tubes) |z| < 30 cm The BBCLL 1(>1 tubes) distribution looks very similar to the other running periods. However, the BBCLL 1(> 0 tubes) distribution has a large excess of events at low PC 1 hits (indication of background). Compare magneta points to the black histogram. 9/26/2020 by Jamie Nagle 7
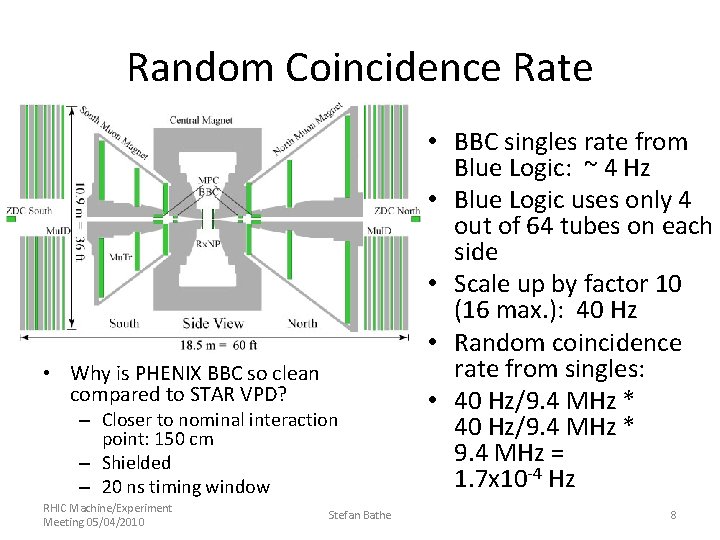
Random Coincidence Rate • Why is PHENIX BBC so clean compared to STAR VPD? – Closer to nominal interaction point: 150 cm – Shielded – 20 ns timing window RHIC Machine/Experiment Meeting 05/04/2010 Stefan Bathe • BBC singles rate from Blue Logic: ~ 4 Hz • Blue Logic uses only 4 out of 64 tubes on each side • Scale up by factor 10 (16 max. ): 40 Hz • Random coincidence rate from singles: • 40 Hz/9. 4 MHz * 9. 4 MHz = 1. 7 x 10 -4 Hz 8
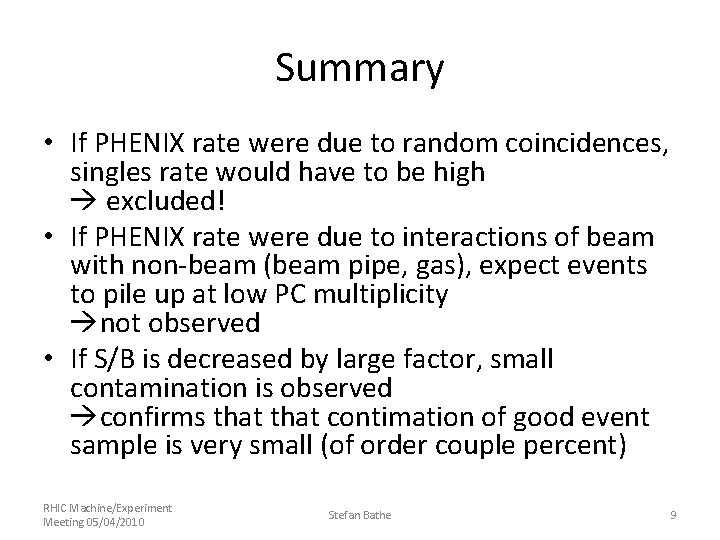
Summary • If PHENIX rate were due to random coincidences, singles rate would have to be high excluded! • If PHENIX rate were due to interactions of beam with non-beam (beam pipe, gas), expect events to pile up at low PC multiplicity not observed • If S/B is decreased by large factor, small contamination is observed confirms that contimation of good event sample is very small (of order couple percent) RHIC Machine/Experiment Meeting 05/04/2010 Stefan Bathe 9
- Slides: 9