Phase Transformation Chapter 9 Q How was the


 g. L T Tm g. S T")


 Surface energy (H) Opposing")


, has been")


 r*")

 = No. of nucleation events per")

 T U: Growth rate (ms-1) Overall")


 T L+ crystal 30 log t glass 18 Fig. 9.")


 Polish Metallurgist")


 Problem 3. 1 BCT unit cell of (austenite) BCT unit")
 Hardness of martensite as a function of C content Hardness,")


 +Fe 3 C PEARLITE A distribution of fine particles of Fe")


 More time")
")


")
 Tm → COLD")


- Slides: 84
Phase Transformation Chapter 9
Q: How was the statue made? A: Invest casting Liquid-to-solid transformation An example of phase transformation Shiva-Parvati, Chola Bronze Ball State University
How does one produce single crystal of Si for electronic applications? Czochralski crystal pulling technique
Quenching of steel components a solid->solid phase transformation
Solid state phase ion at fic di so li evaporation Liquid at condensation m bli me transformation su lti ng Solid 1 gas Solid 2
Thermodynamic driving force for a phase transformation? Decrease in Gibbs free energy Liquid-> solid gs - gl = g = -ve
g Gibbs free energy as a function of temperature, Problem 2. 3 g. L g. S g g. L < g. S Solid is stable g. S < g. L Liquid is stable g. S g. L Tfreezing Tm T Fig. 9. 1
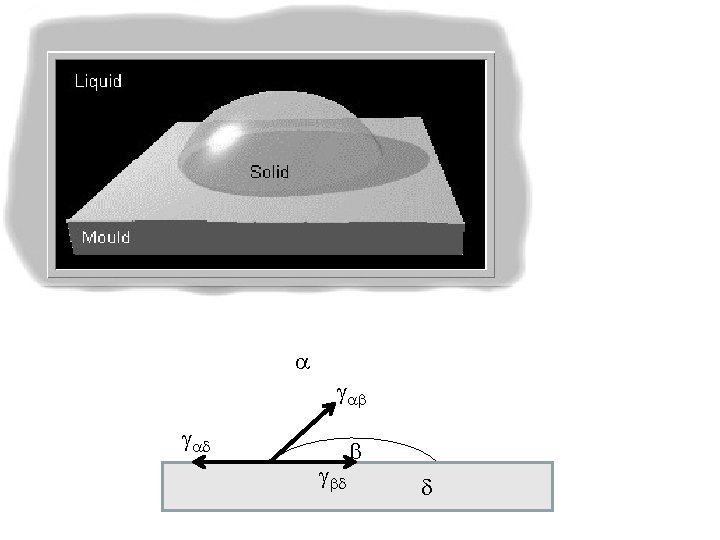
How does solidification begins? Usually at the walls of the container Heterogeneous nucleation. Why? To be discussed later.
Spherical ball of solid of radius R in the middle of the liquid at a temperature below Tm Homogeneous nucleation r g. L = free energy of liquid per unit volume g. S = free energy of solid per unit volume g = g. S - g. L
Change in free energy of the system due to formation of the solid ball of radius r : + 4 p r 2 g +ve: barrier to nucleation r r* r
Solid balls of radius r < r* cannot grow as it will lead to increase in the free energy of the system !!! + 4 p r 2 g Solid balls of radii r > r* will grow r* is known as the CRITICAL RADIUS OF HOMOGENEOUS NUCLEATION r* r
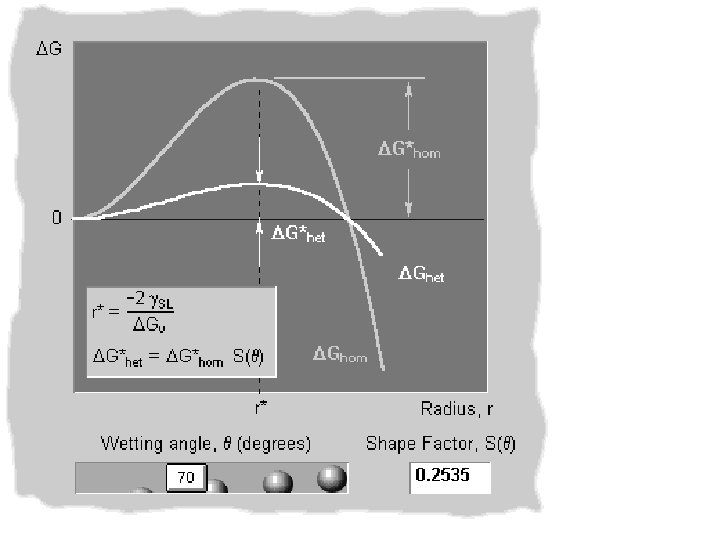
+ 4 p r 2 g Eqn. 9. 4 r* r Eqn. 9. 5
Driving force for solidification g g (T) g. L T Tm g. S T Eqn. 9. 7
f + 4 p r 2 g Fig. 9. 3 f 1* + 4 p r 2 g f 2* r 2 * r 1* r Eqn. 9. 7 T 2 < T 1 Eqn. 9. 8
Comparison of Nucleation & Capillary Rise Nucleation Capillary Rise S V R R* V G=S+V Unstable Equilibrium E=S+V H H* S Stable Equilibrium 15
Nucleation Capillary Rise Driving Force Volume free energy (R 3) Surface energy (H) Opposing Force Surface energy (R 2) Volumetric gravitational potential (H 2) Equilibrium Unstable Stable R. Prasad, “On Capillary Rise and Nucleation”, Journal of Chemical Education, Vol. 85, No. 10, October 2008, p 1389 16
Journal of Chemical Education, Vol. 85, No. 10, October 2008, p 1389 17
HETEROGENEOUS NUCLEATION Nucleation is often aided by some preexisting surfaces, e. g. , container walls, grain boundaries etc. Such nucleation is called HETEROGENEOUS NUCLEATION Pepsi experiment 18
Orthophosphoric Acid Demonstration Phosphoric acid, used in many soft drinks (primarily cola), has been linked to lower bone density in epidemiological studies. -Wikipedia Homogeneous vs. heterogeneous nucleation Cloud seeding and artificial rain 19
20
Atoms surrounding the critical particle Formation of critical nucleus by statistical fluctuation Critical particle Diffuse jump of a surrounding atom to the critical particle makes it a nucleation Fig. 9. 4
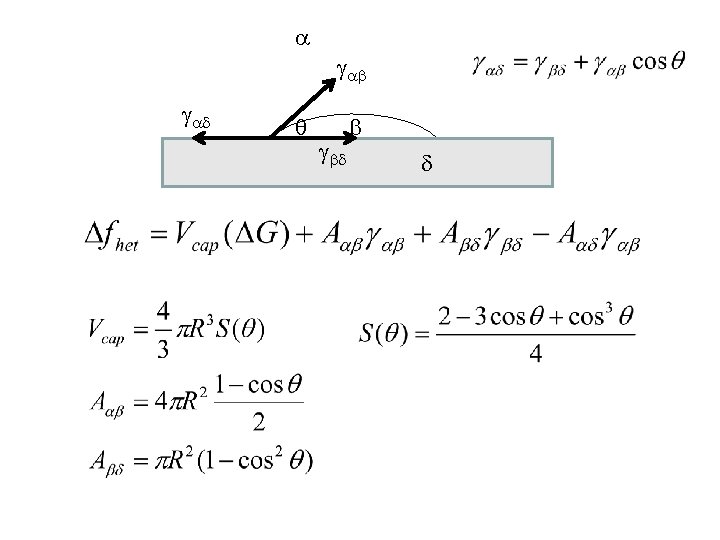
Plot of S( ) r*
Eqn. 9. 9 s*= no. of liquid phase atoms facing the critical sized particle Hd = activation energy for diffusive jump from liquid to the solid phase = atomic vibration frequency The rate of successful addition of an atom to a critical sized paticle Eqn. 9. 10
Rate of nucleation, I , (m 3 s-1) = No. of nucleation events per m 3 per sec = number of critical clusters per unit volume (N*) x rate of successful addition of an atom to the critical cluster ( ’) T With decreasing T Tm 1. Driving force increases 2. Atomic mobility decreases I
Growth Increase in the size of a product particle after it has nucleated T U
Overall Transformation Kinetics I: Nucleation rate (m-3 s-1) T U: Growth rate (ms-1) Overall transformation rate (fraction transformed per second, s-1) X=fraction of product phase U d. X/dt I
Fraction transformed as a function of time X Slow due to final impingement Slow due to very few nuclei ts tf t
TTT Diagram for liquid-to-solid transformation X 1 0 T T Tm ts tf log t Stable liquid Cgins e b n es o i v t r a z u i c all Cryst L+ nds e n o i t a iz Crystall crystal Under Cooled liquid d. X/dt log t
TTT Diagram for liquid-to-solid transformation T U T Tm I Stable liquid Under Cooled liquid L+ Fine grained crystals Coarse grained crystals glass log t
T ts metals ts Si. O 2 Metallic glass Silica glass Eqn. 9. 11 Eqn. 9. 8 Hd ∝ log (viscosity) log t Si. O 2: low hm, high viscosity Metals: high hm, low viscosity
Inert gas pressure Quartz tube Melt Spinning for metallic glass ribbons Molten alloy Heater coil Jet of molten metal Ribbon of glassy metal Rotating cooled metal drum Cooling rate 106 ºC s-1 From Principles of Electronic Materials and Devices, Second Edition, S. O. Kasap (© Mc. Graw-Hill, 2002) http: //Materials. Usask. Ca
Tm Log (viscosity Pa-s) T L+ crystal 30 log t glass 18 Fig. 9. 17 12 Undercooled liquid Stable liquid Tg Tm T
Specific volume Stable liquid Undercooled liquid Fast cool Fig. 9. 18 Slow cool crystal Tgs Tgf Tm T
T Glass ceramics Stable liquid Undercooled liquid Tm L+ devitrification glass crystal T TU TI U T log t Liquid growth Very fine crystals nucleation Fig. 9. 16 I glass Glass ceramic time
Corningware Pyroceram. TM heat resistant cookware Corning’s new digital hot plates with Pyroceram. TM tops. ROBAX® was heated until redhot. Then cold water was poured on the glass ceramic from above - with NO breakage.
Czochralski crystal pulling technique for single crystal Si J. Czochralski, (1885 -1953) Polish Metallurgist SSPL: Solid State Physics Laboratory, N. Delhi
TABLE 9. 2 Hardness Wt% C Steel Rockwell C Microstructure Heat treatment Annealing A 15 0. 8 Coarse pearlite B 30 0. 8 fine pearlite normalizing C 45 0. 8 bainite austempering quenching D 55 0. 8 Tempered martensite E 65 0. 8 martensite
HEAT TREATMENT Heating a material to a high temperature, holding it at that temperature for certain length of time followed by cooling at a specified rate is called heat treatment
holding heati ng T AT Q T A N Annealing Furnace cooling RC 15 Normalizing Air cooling RC 30 Quenching Water cooling RC 65 Tempering Heating after quench RC 55 Austempering Quench to an intermediate temp and hold RC 45 time
Eutectoid Reaction 0. 8 cool 0. 02 6. 67 Pearlite Ammount of Fe 3 C in Pearlite Red Tie Line below eutectoid temp
Phase diagrams do not have any information about time or rates of transformations. We need TTT diagram for austenite-> pearlite transformation
TTT diagram for eutectoid steel Stable austenite t r sta unstable austenite finish
TTT diagram for eutectoid steel T U Stable austenite rt a t s I unstable austenite finish Annealing: coarse pearlite Normalizing: fine pearlite
Callister
QUENCHING TTT diagram for eutectoid steel Hardness RC 65 Stable austenite t r sta ’: martensite (M) Extremely rapid, no Ccurves Ms : Martensite start Ms temperature Mf : Martensite finish Mf temperature unstable austenite A+M M finish
Martensitic transformation Amount of martensite formed does not depend upon time, only on temperature. Atoms move only a fraction of atomic distance during the transformation: 1. Diffusionless (no long-range diffusion) BCT 2. Shear (one-to-one correspondence between and ’ atoms) 3. No composition change
Martensitic transformation (contd. ) Problem 3. 1 BCT unit cell of (austenite) BCT unit cell of ’ (martensite) Expand ~ 12% Contract ~ 20% Fig. 9. 12 0% C (BCC) 1. 2 % C
Martensitic transformation (contd. ) Hardness of martensite as a function of C content Hardness, RC 60 40 Fig. 9. 13 20 0. 2 0. 4 0. 6 Wt % Carbon → Hardness of martensite depends mainly on C content and not on other alloying additions
heati ng T AT Q T A N
TEMPERING Heating of quenched steel below the eutectoid temperature, holding for a specified time followed by ar cooling. T<TE ?
Tempering (contd. ) +Fe 3 C PEARLITE A distribution of fine particles of Fe 3 C in matrix known as TEMPERED MARTENSITE. Hardness more than fine pearlite, ductility more than martensite. Hardness and ductility controlled by tempering temperature and time. Higher T or t -> higher ductility, lower strength
Tempering Continued Callister
Austempering Bainite Short needles of Fe 3 C embedded in plates of ferrite
Problems in Quenching Quench Cracks High rate of cooling: surface cooler than interior Surface forms martensite before the interior Austenite martensite Volume expansion When interior transforms, the hard outer martensitic shell constrains this expansion leading to residual stresses
Solution to Quench cracks Shift the C-curve to the right (higher times) More time at the nose Slower quenching (oil quench) can give martensite But how to shift the C-curve to higher times?
By alloying All alloying elements in steel (Cr, Mn, Mo, Ni, Ti, W, V) etc shift the C-curves to the right. Exception: Co Substitutional diffusion of alloying elements is slower than the interstitial diffusion of C
Plain C steel Alloying shifts the C-curves to the right. Separate C-curves for pearlite and bainite Fig. 9. 10
Hardenability Ability or ease of hardening a steel by formation of martensite using as slow quenching as possible Alloying elements in steels shift the C-curve to the right Alloy steels have higher hardenability than plain C steels.
Hardnenability Ability or ease of hardening a steel Only applicable to steels Hardness Resistance to plastic deformation as measured by indentation Applicable to all materials Alloying additions increase the hardenability of steels but not the hardness. C increases both hardenability and hardness of steels.
High Speed steel Alloy steels used for cutting tools operated at high speeds Cutting at high speeds lead to excessive heating of cutting tools This is equivalent to unintended tempering of the tools leading to loss of hardness and cutting edge Alloying by W gives fine distribution of hard WC particles which counters this reduction in hardness: such steels are known as high speed steels.
Tsolvus : solid solution of Cu in FCC Al + : intermetallic compound Cu. Al 2 supersaturated FCC 4 wt%Cu 4 saturated FCC 0. 5 wt%Cu + Tetragonal 54 wt%Cu Precipitation of in
Tsolvus Stable TTT diagram of precipitation of in unstable start finsh + Asquench ed Aging A fine distribution of precipitates in matrix causes hardening Completion of precipitation corresponds to peak hardness
As quenched Aged -grains + Driving force for coarsening / interfacial energy Peak aged Dense distribution of fine overaged Sparse distribution of coarse
hardness Aging temperature 100ºC 20ºC 180ºC Fig. 9. 15 Aging time 0. 1 1 10 100 (days) Peak hardness is less at higher aging temperature Peak hardness is obtained in shorter time at higher aging temperature
T Stable U Tsolvus unstable start finsh + 180 ºC Asquenched I 100 ºC Aging hardness 100ºC 180ºC 1 20ºC
Recovery, Recrystallization and grain growth Following slides are courtsey Prof. S. K Gupta (SKG) Or Prof. Anandh Subramaniam (AS)
Plastic deformation in the temperature range above(0. 3 – 0. 5) Tm → COLD WORK ↑ point defect density Cold work ↑ dislocation density q Point defects and dislocations have strain energy associated with them q (1 -10) % of the energy expended in plastic deformation is stored in the form of strain energy AS
↑ Strength ↑ Hardness Cold work ↑ Electrical resistance ↓ Ductility AS
Cold work Anneal Recovery Recrystallization Grain growth AS
Recovery, Recrystallization and Grain Growth During recovery 1. Point Defects come to Equilibrium 2. Dislocations of opposite sign lying on a slip plane annihilate each other (This does not lead to substantial decrease in the dislocation density) SKG
POLYGONIZATION Bent crystal Po lyg on Low angle grain boundaries iza tio n AS
Recrystallization Strained grains Strain-free grains Driving force for the Process = Stored strain energy of dislocations SKG
Recrystallization Temperature: Temperature at which the 50% of the cold-worked material recrystallizes in one hour Usually around 0. 4 Tm (m. p in K) SKG
Factors that affect the recrystallization temperature: 1. Degree of cold work 2. Initial Grain Size 3. Temperature of cold working 4. Purity or composition of metal Solute Drag Effect Pinning Action of Second Phase Particle SKG
Solute Drag Effect SKG
Grain Boundary Pinning SKG
Grain Growth Increase in average grain size following recrystallization Driving Force reduction in grain boundary energy Impurities retard the process SKG
Grain growth q Globally ► Driven by reduction in grain boundary energy q Locally ► Driven by bond maximization (coordination number maximization) AS
AS Bonded to 4 atoms Bonded to 3 atoms Direction of grain boundary migration Boundary moves towards its centre of curvature JUMP
Hot Work and Cold Work q Hot Work Plastic deformation above TRecrystallization Hot Work Plastic deformation below TRecrystallization temperature (~ 0. 4 Tm) Cold Work q Cold AS
Electical conductivity Internal stress Ductility Tensile strength Cold work %CW Recovery Recrystallization Grain growth Annealing Temperature Fig. 9. 19 AS