
Phase Diagram Acknowledgement This slides are largely obtained
Phase Diagram Acknowledgement: This slides are largely obtained from Dr. Neoh Siew Chin Uni. MAP on the subject Material Engineering
Introduction • Phase: A region in a material that differs in structure and function from other regions. • Phase diagrams: Ø Represents phases present in metal at different conditions (Temperature, pressure and composition). Ø Indicates equilibrium solid solubility of one element in another. Ø Indicates temperature range under which solidification occurs. Ø Indicates temperature at which different phases start to melt. 8 -2
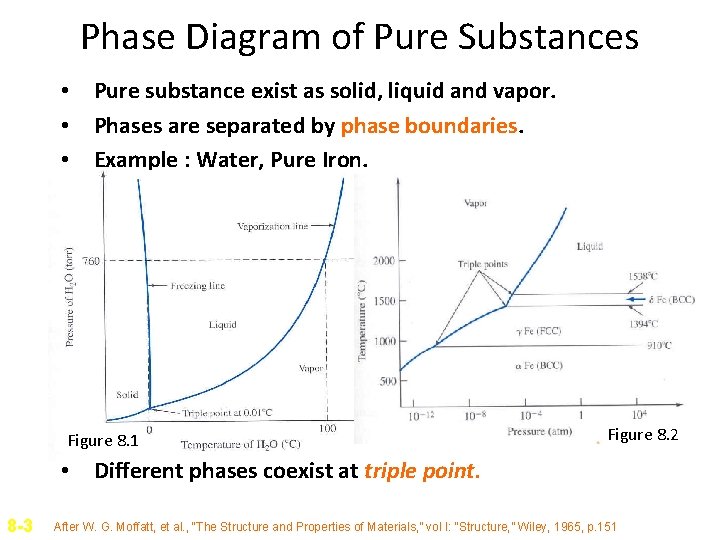
Phase Diagram of Pure Substances • Pure substance exist as solid, liquid and vapor. • Phases are separated by phase boundaries. • Example : Water, Pure Iron. Figure 8. 1 Figure 8. 2 • Different phases coexist at triple point. 8 -3 After W. G. Moffatt, et al. , “The Structure and Properties of Materials, ” vol I: “Structure, ” Wiley, 1965, p. 151

Gibbs Phase Rule • P+F = C+2 For pure water, at triple point, 3 phases coexist. There is one component (water) in the system. Therefore 3 + F = 1 + 2 F = 0. Degrees of freedom indicate number of variables that can be changed independently without changing number of phases in equilibrium. • Usually a component C is an element, compound or solution in the system. F, the degrees of freedom, is the number of variables (pressure, temperature and composition) • • 8 -4 P = number of phases that coexist in a system C = Number of components F = Degrees of freedom
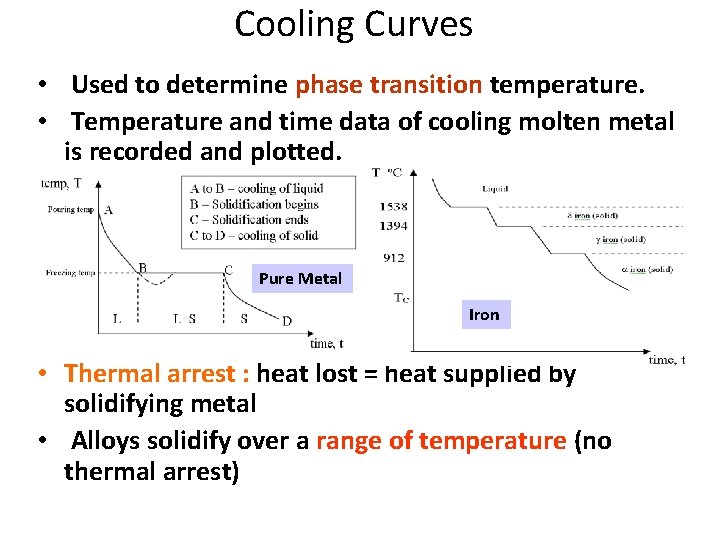
Cooling Curves • Used to determine phase transition temperature. • Temperature and time data of cooling molten metal is recorded and plotted. Pure Metal Iron • Thermal arrest : heat lost = heat supplied by solidifying metal • Alloys solidify over a range of temperature (no thermal arrest)
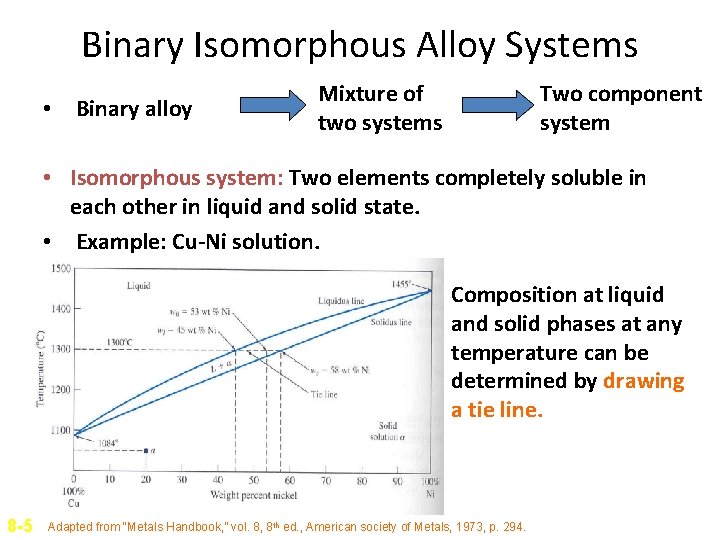
Binary Isomorphous Alloy Systems • Binary alloy Mixture of two systems Two component system • Isomorphous system: Two elements completely soluble in each other in liquid and solid state. • Example: Cu-Ni solution. Composition at liquid and solid phases at any temperature can be determined by drawing a tie line. 8 -5 Adapted from “Metals Handbook, ” vol. 8, 8 th ed. , American society of Metals, 1973, p. 294.

Phase Diagram from Cooling Curves • Series of cooling curves at different metal composition are first constructed. • Points of change of slope of cooling curves (thermal arrests) are noted and phase diagram is constructed. • More the number of cooling curves, more accurate is the phase diagram. 8 -6
Interpretation of Phase Diagram For a given temperature and composition we can use phase diagram to determine: 1) The phases that are present 2) Compositions of the phases 3) The relative fractions of the phases Finding the composition in a two phase region: 1. Locate composition and temperature in diagram 2. In two phase region draw the tie line 3. Note intersection with phase boundaries. compositions at the intersections. Read
The Lever Rule Finding the amounts of phases (mass fraction) in a two phase region: 1. Locate composition and temperature in diagram 2. In two phase region draw the tie line or isotherm 3. Fraction of a phase is determined by taking the length of the tie line to the phase boundary for the other phase, and dividing by the total length of tie line
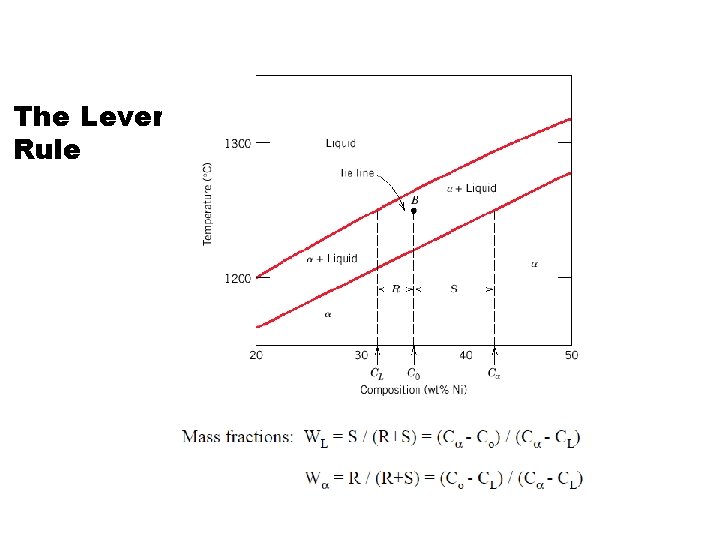
The Lever Rule
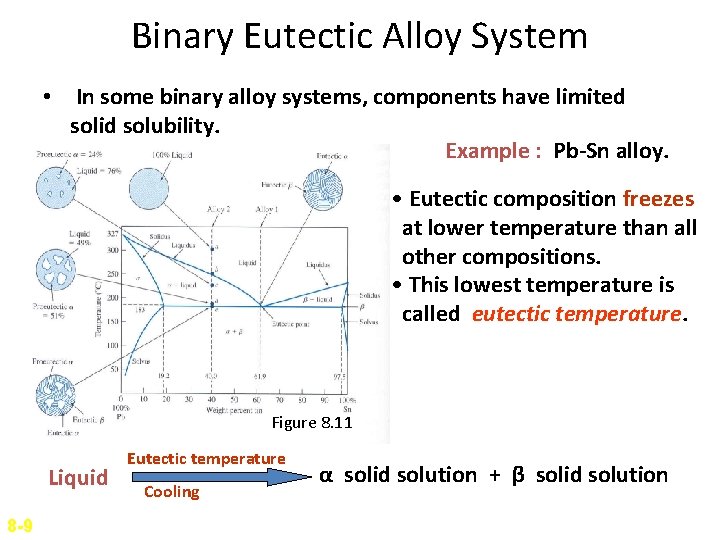
Binary Eutectic Alloy System • In some binary alloy systems, components have limited solid solubility. Example : Pb-Sn alloy. • Eutectic composition freezes at lower temperature than all other compositions. • This lowest temperature is called eutectic temperature. Figure 8. 11 Liquid 8 -9 Eutectic temperature Cooling α solid solution + β solid solution
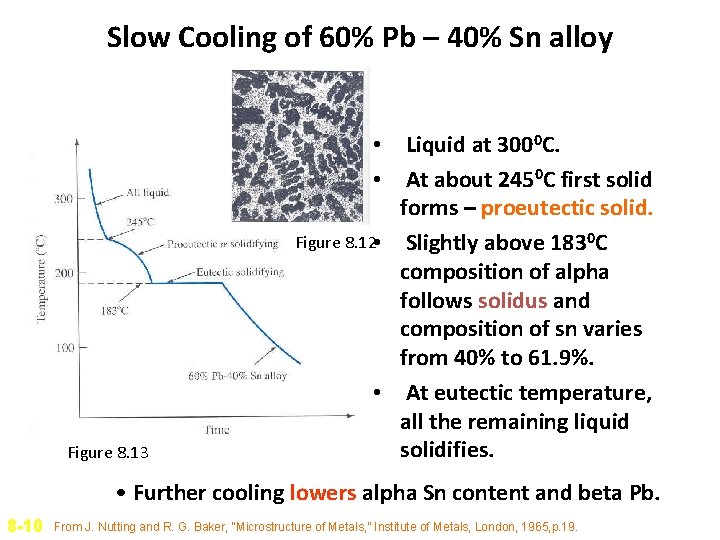
Slow Cooling of 60% Pb – 40% Sn alloy Figure 8. 13 • Liquid at 3000 C. • At about 2450 C first solid forms – proeutectic solid. Figure 8. 12 • Slightly above 1830 C composition of alpha follows solidus and composition of sn varies from 40% to 61. 9%. • At eutectic temperature, all the remaining liquid solidifies. • Further cooling lowers alpha Sn content and beta Pb. 8 -10 From J. Nutting and R. G. Baker, “Microstructure of Metals, ” Institute of Metals, London, 1965, p. 19.
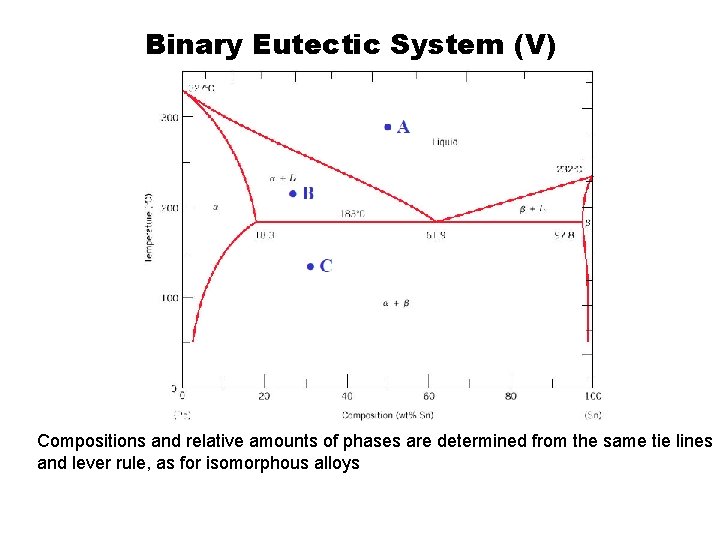
Binary Eutectic System (V) Compositions and relative amounts of phases are determined from the same tie lines and lever rule, as for isomorphous alloys
- Slides: 13