
Pharmaceutical Trends Issues Forecasts Doug Long Vice President



- Slides: 94
Pharmaceutical Trends, Issues, & Forecasts Doug Long Vice President, Industry Relations IQVIA
Disclosure Doug Long is the Vice President of IQVIA. The conflict of interest was resolved by peer review of the slide content.
Learning Objectives • Discuss pharmaceutical pipelines and what they project for spending in the next 3 5 years. • Discuss patient population and prescribing trends.
Key happenings in 2017! Market Performance ü Dollar growth was 1. 7% ü Adjusted 90 -Day TRX growth was 2. 3% and Unadjusted TRx growth was falt ü 90 day scripts are 15. 7% of scripts ü Below avg. Flu and Allergy Seasons (until now) ü Generic $ sales decreases Generic Launches ü Record number of ANDA approvals and faster approvals ü Copaxone 40 mg ü Pristiq ü Strattera Mergers / Alliances ü New Walgreens and Rite Aid deal now approved ü Walmart and Mc. Kesson Alliance ü Econdisc joins WBAD Alliance ü Walgreens and Phar. Merica ü Amazon and Whole Foods ü CVS and Aetna Regulation ü Opioids recognized as a national crisis ü FDA Priority list of no or limited generic entries Reimbursement ü Pharmacists can prescribe in more places ü Good Rx, Blink RX, etc. ü Patient’s behavior during their deductible period Price / Politics ü Much more public/ media scrutiny on drug prices ü Generic Deflation ü Less Brand price inflation ü Repeal and Replace?
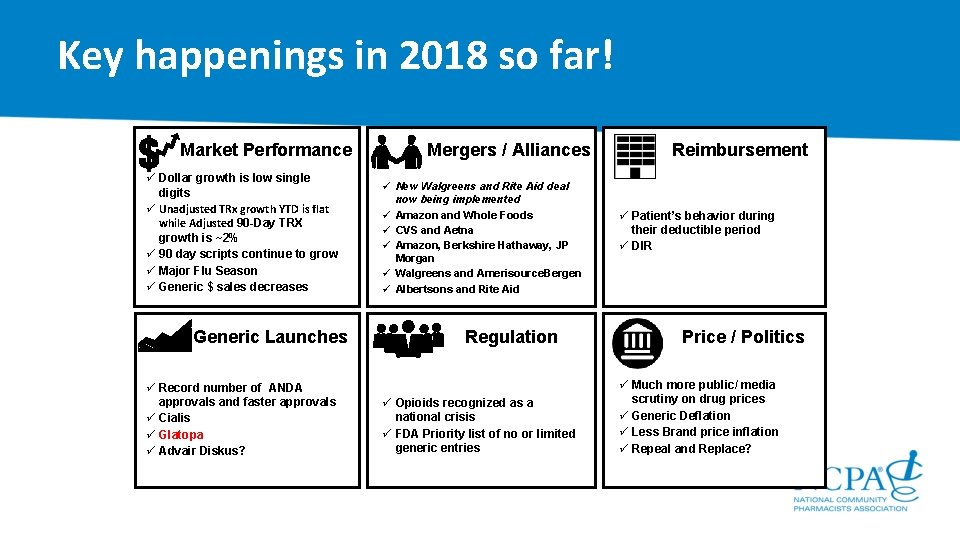
Key happenings in 2018 so far! Market Performance ü Dollar growth is low single digits ü Unadjusted TRx growth YTD is flat while Adjusted 90 -Day TRX growth is ~2% ü 90 day scripts continue to grow ü Major Flu Season ü Generic $ sales decreases Generic Launches ü Record number of ANDA approvals and faster approvals ü Cialis ü Glatopa ü Advair Diskus? Mergers / Alliances ü New Walgreens and Rite Aid deal now being implemented ü Amazon and Whole Foods ü CVS and Aetna ü Amazon, Berkshire Hathaway, JP Morgan ü Walgreens and Amerisource. Bergen ü Albertsons and Rite Aid Regulation ü Opioids recognized as a national crisis ü FDA Priority list of no or limited generic entries Reimbursement ü Patient’s behavior during their deductible period ü DIR Price / Politics ü Much more public/ media scrutiny on drug prices ü Generic Deflation ü Less Brand price inflation ü Repeal and Replace?
A Year in Review Market Performance 01 Market Access, Deductibles, & Reimbursement 02 Hot Topic 1: “Cash Business” 03 Hot Topic 2: Adherence 04 Hot Topic 3: Opioids 05 A Look Forward to 2018 & Recap 06
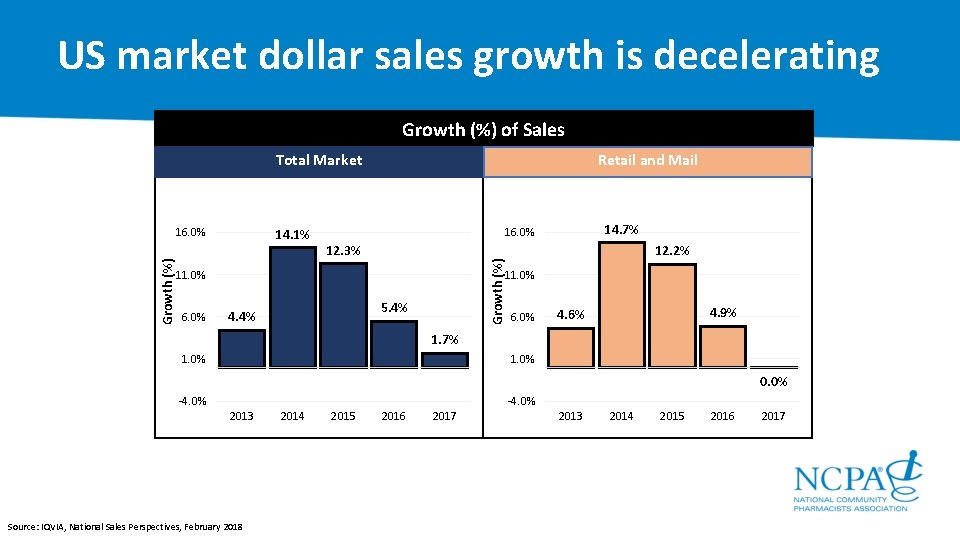
US market dollar sales growth is decelerating Growth (%) of Sales Retail and Mail Total Market 14. 1% 12. 3% 12. 2% 11. 0% 6. 0% 14. 7% 16. 0% Growth (%) 16. 0% 11. 0% 5. 4% 4. 4% 6. 0% 4. 9% 4. 6% 1. 7% 1. 0% 0. 0% 4. 0% 2013 Source: IQVIA, National Sales Perspectives, February 2018 2014 2015 2016 2017 2013 2014 2015 2016 2017
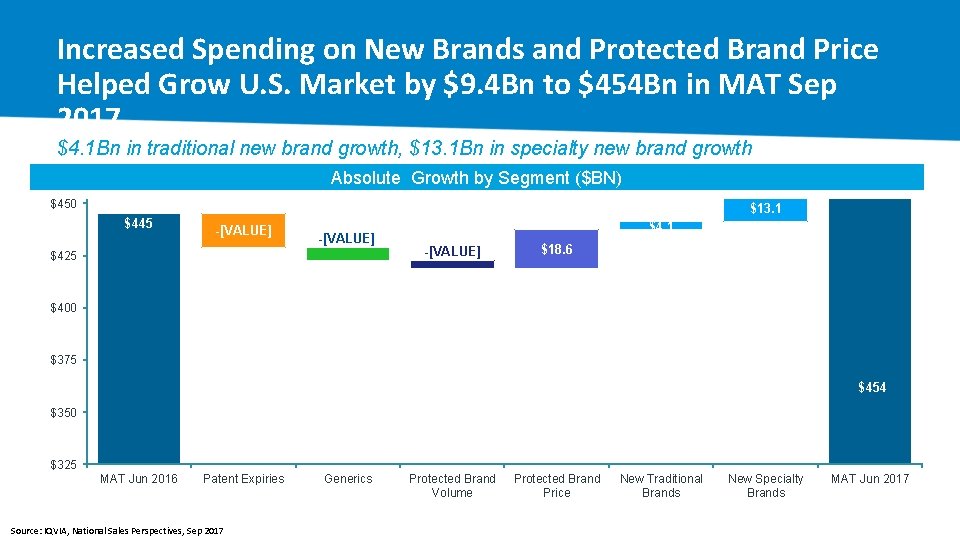
Increased Spending on New Brands and Protected Brand Price Helped Grow U. S. Market by $9. 4 Bn to $454 Bn in MAT Sep 2017 $4. 1 Bn in traditional new brand growth, $13. 1 Bn in specialty new brand growth Absolute Growth by Segment ($BN) $450 $13. 1 $445 -[VALUE] $425 $4. 1 -[VALUE] $18. 6 $400 $375 $454 $350 $325 MAT Jun 2016 Patent Expiries Source: IQVIA, National Sales Perspectives, Sep 2017 Generics Protected Brand Volume Protected Brand Price New Traditional Brands New Specialty Brands MAT Jun 2017
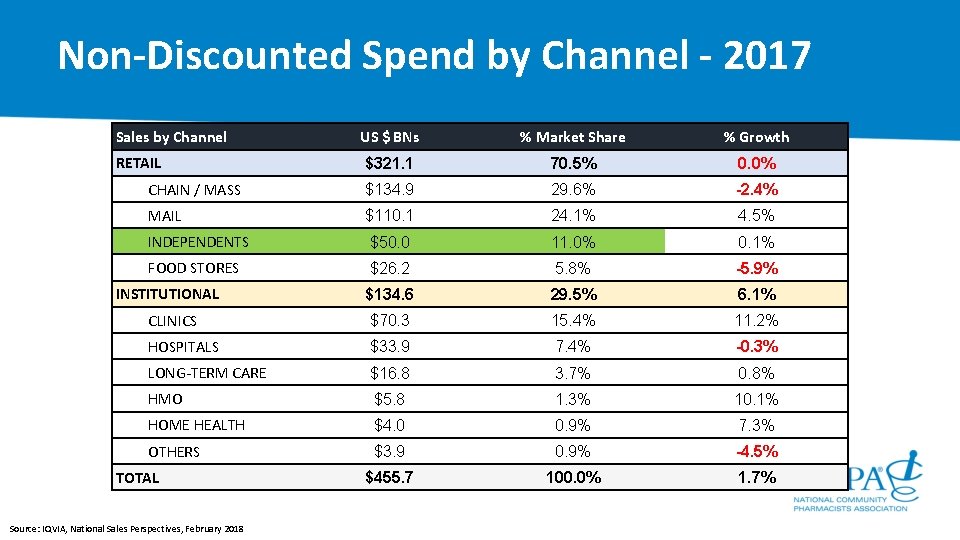
Non-Discounted Spend by Channel - 2017 Sales by Channel US $ BNs % Market Share % Growth $321. 1 70. 5% 0. 0% CHAIN / MASS $134. 9 29. 6% -2. 4% MAIL $110. 1 24. 1% 4. 5% INDEPENDENTS $50. 0 11. 0% 0. 1% FOOD STORES $26. 2 5. 8% -5. 9% $134. 6 29. 5% 6. 1% CLINICS $70. 3 15. 4% 11. 2% HOSPITALS $33. 9 7. 4% -0. 3% LONG TERM CARE $16. 8 3. 7% 0. 8% HMO $5. 8 1. 3% 10. 1% HOME HEALTH $4. 0 0. 9% 7. 3% OTHERS $3. 9 0. 9% -4. 5% $455. 7 100. 0% 1. 7% RETAIL INSTITUTIONAL TOTAL Source: IQVIA, National Sales Perspectives, February 2018
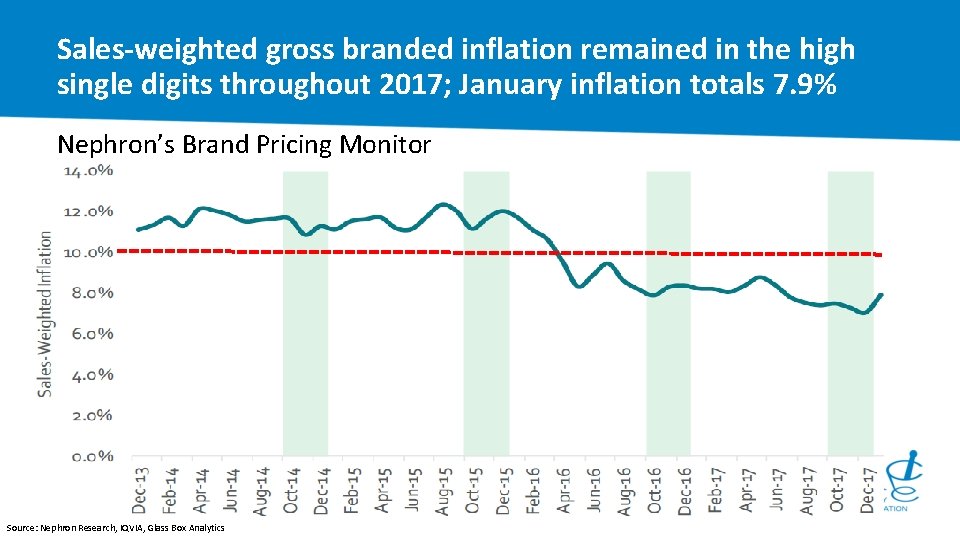
Sales-weighted gross branded inflation remained in the high single digits throughout 2017; January inflation totals 7. 9% Nephron’s Brand Pricing Monitor Source: Nephron Research, IQVIA, Glass Box Analytics
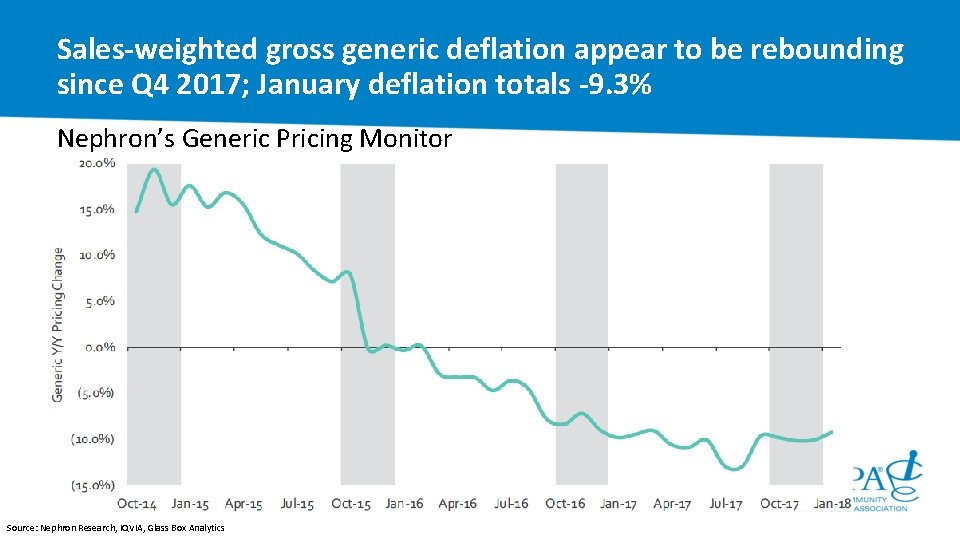
Sales-weighted gross generic deflation appear to be rebounding since Q 4 2017; January deflation totals -9. 3% Nephron’s Generic Pricing Monitor Source: Nephron Research, IQVIA, Glass Box Analytics
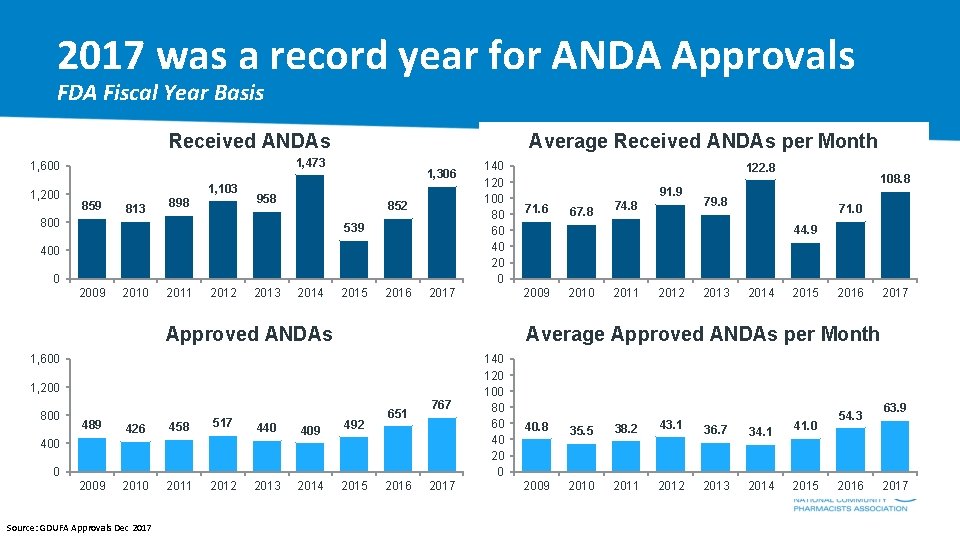
2017 was a record year for ANDA Approvals FDA Fiscal Year Basis Received ANDAs 1, 473 1, 600 1, 200 Average Received ANDAs per Month 1, 103 859 813 898 1, 306 958 852 800 539 400 0 2009 2010 2011 2012 2013 2014 2015 2016 140 120 100 80 60 40 2017 1, 200 489 426 458 517 440 409 492 2009 2010 2011 2012 2013 2014 2015 651 767 0 Source: GDUFA Approvals Dec 2017 71. 6 67. 8 74. 8 108. 8 79. 8 71. 0 44. 9 2010 2011 2012 2013 2014 2015 2016 2017 Average Approved ANDAs per Month 1, 600 400 91. 9 2009 Approved ANDAs 800 122. 8 2016 2017 140 120 100 80 60 40 20 0 40. 8 35. 5 38. 2 43. 1 36. 7 34. 1 41. 0 2009 2010 2011 2012 2013 2014 2015 54. 3 2016 63. 9 2017
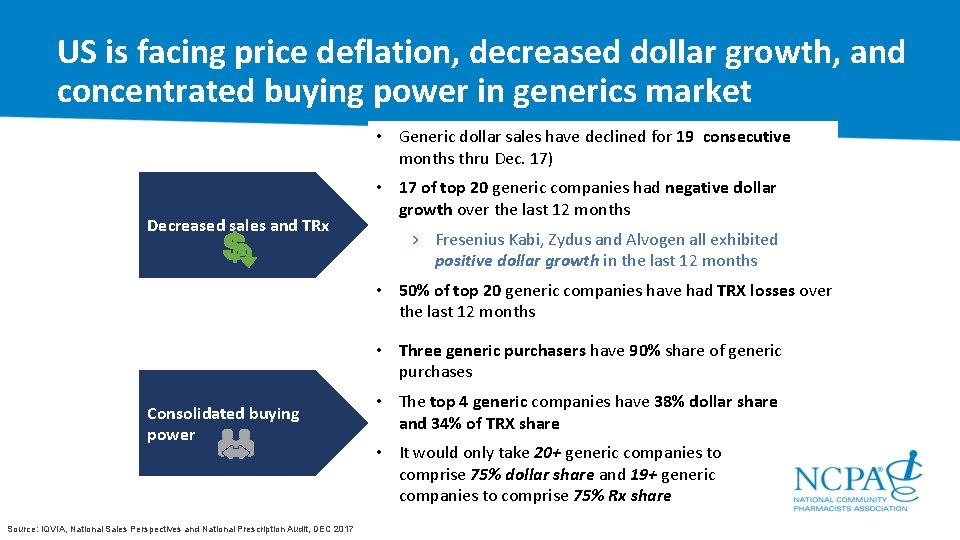
US is facing price deflation, decreased dollar growth, and concentrated buying power in generics market • Generic dollar sales have declined for 19 consecutive months thru Dec. 17) Decreased sales and TRx • 17 of top 20 generic companies had negative dollar growth over the last 12 months › Fresenius Kabi, Zydus and Alvogen all exhibited positive dollar growth in the last 12 months • 50% of top 20 generic companies have had TRX losses over the last 12 months • Three generic purchasers have 90% share of generic purchases Consolidated buying power Source: IQVIA, National Sales Perspectives and National Prescription Audit, DEC 2017 • The top 4 generic companies have 38% dollar share and 34% of TRX share • It would only take 20+ generic companies to comprise 75% dollar share and 19+ generic companies to comprise 75% Rx share
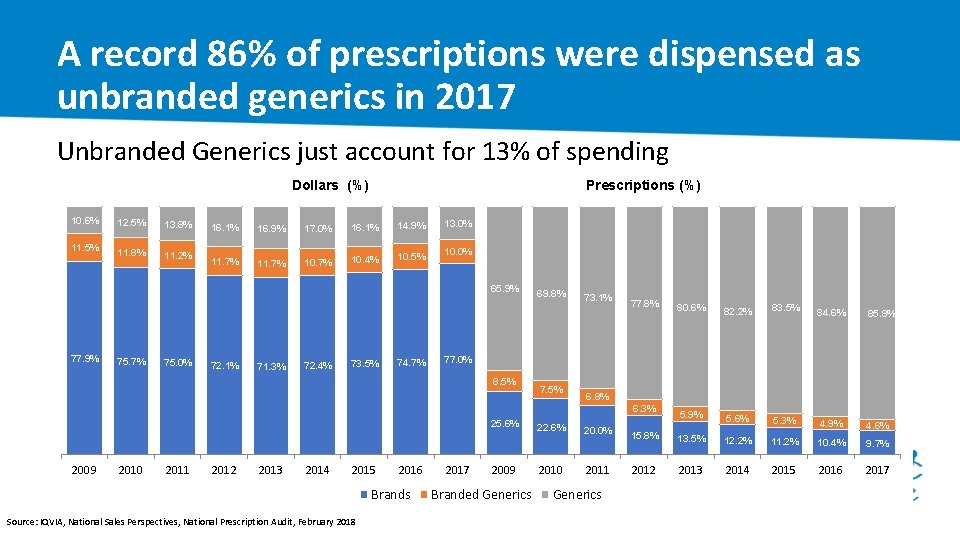
A record 86% of prescriptions were dispensed as unbranded generics in 2017 Unbranded Generics just account for 13% of spending Dollars (%) 10. 6% 11. 5% 12. 5% 13. 8% 11. 2% Prescriptions (%) 16. 1% 16. 9% 17. 0% 16. 1% 14. 9% 11. 7% 10. 4% 10. 5% 13. 0% 10. 0% 65. 9% 77. 9% 75. 7% 75. 0% 72. 1% 71. 3% 72. 4% 73. 5% 74. 7% 25. 6% 2010 2011 2012 2013 2014 2015 2016 Brands Source: IQVIA, National Sales Perspectives, National Prescription Audit, February 2018 73. 1% 77. 8% 80. 6% 82. 2% 83. 5% 84. 6% 85. 8% 5. 9% 5. 6% 5. 3% 4. 9% 15. 8% 4. 6% 13. 5% 12. 2% 11. 2% 10. 4% 9. 7% 2012 2013 2014 2015 2016 2017 77. 0% 8. 5% 2009 69. 8% 2017 2009 Branded Generics 7. 5% 22. 6% 2010 6. 8% 20. 0% 2011 Generics 6. 3%
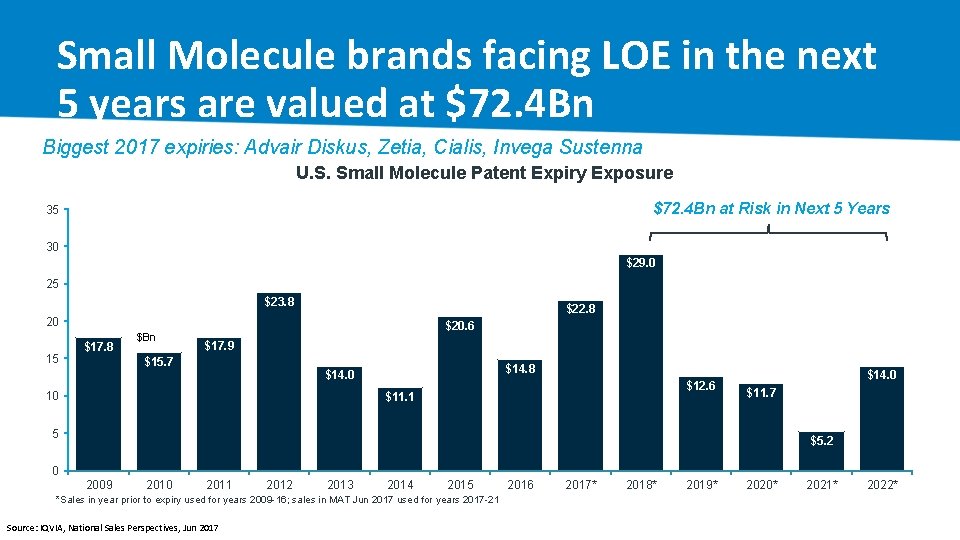
Small Molecule brands facing LOE in the next 5 years are valued at $72. 4 Bn Biggest 2017 expiries: Advair Diskus, Zetia, Cialis, Invega Sustenna U. S. Small Molecule Patent Expiry Exposure $72. 4 Bn at Risk in Next 5 Years 35 30 $29. 0 25 $23. 8 $22. 8 20 15 $17. 8 $Bn $20. 6 $17. 9 $15. 7 $14. 8 $14. 0 10 $12. 6 $11. 1 $14. 0 $11. 7 5 $5. 2 0 2009 2010 2011 2012 2013 2014 2015 *Sales in year prior to expiry used for years 2009 -16; sales in MAT Jun 2017 used for years 2017 -21 Source: IQVIA, National Sales Perspectives, Jun 2017 2016 2017* 2018* 2019* 2020* 2021* 2022*
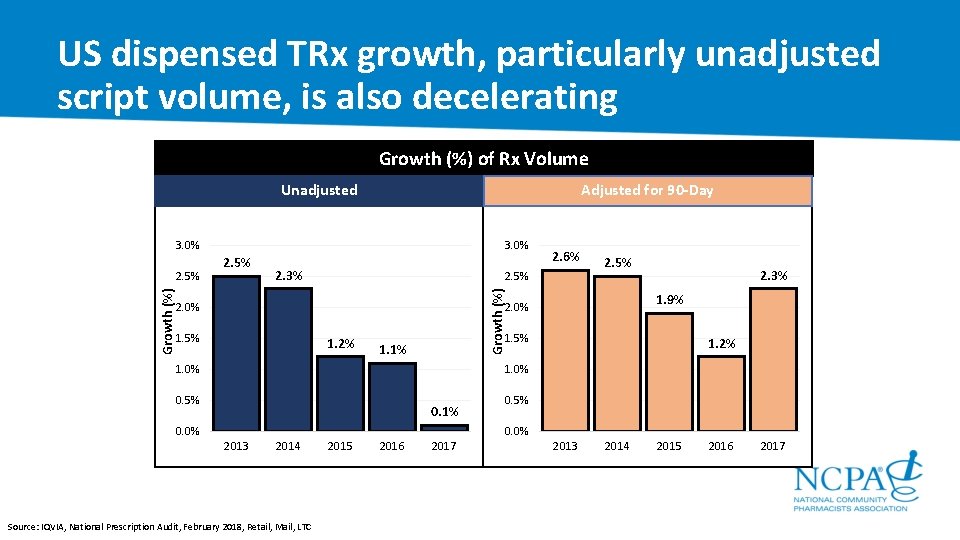
US dispensed TRx growth, particularly unadjusted script volume, is also decelerating Growth (%) of Rx Volume Adjusted for 90 -Day Unadjusted 3. 0% 2. 5% 2. 3% 2. 6% 2. 5% Growth (%) 2. 5% 3. 0% 2. 0% 1. 9% 2. 0% 1. 5% 1. 2% 2. 3% 1. 5% 1. 1% 1. 0% 1. 2% 1. 0% 0. 5% 0. 1% 0. 0% 0. 5% 0. 0% 2013 2014 Source: IQVIA, National Prescription Audit, February 2018, Retail, Mail, LTC 2015 2016 2017 2013 2014 2015 2016 2017
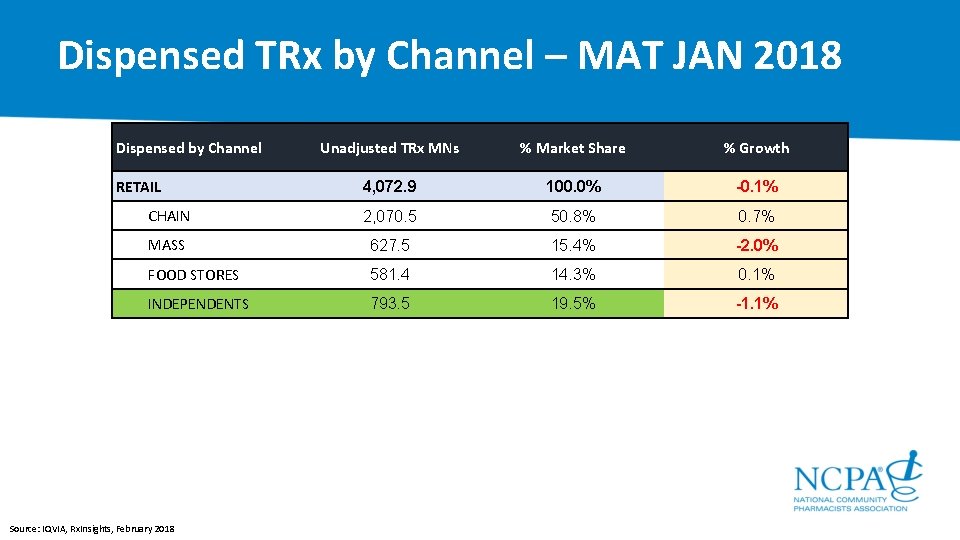
Dispensed TRx by Channel – MAT JAN 2018 Dispensed by Channel Unadjusted TRx MNs % Market Share % Growth 4, 072. 9 100. 0% -0. 1% CHAIN 2, 070. 5 50. 8% 0. 7% MASS 627. 5 15. 4% -2. 0% FOOD STORES 581. 4 14. 3% 0. 1% INDEPENDENTS 793. 5 19. 5% -1. 1% RETAIL Source: IQVIA, Rx. Insights, February 2018
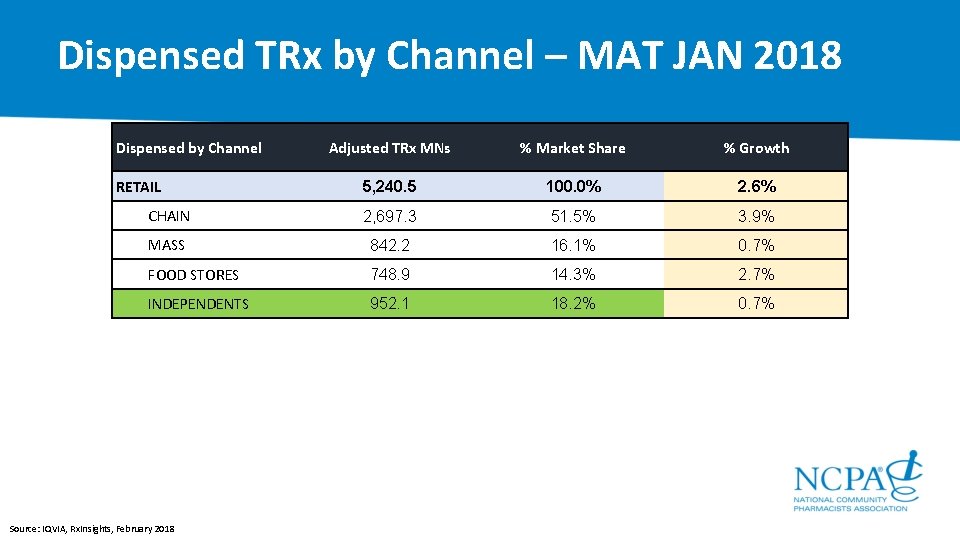
Dispensed TRx by Channel – MAT JAN 2018 Dispensed by Channel Adjusted TRx MNs % Market Share % Growth 5, 240. 5 100. 0% 2. 6% CHAIN 2, 697. 3 51. 5% 3. 9% MASS 842. 2 16. 1% 0. 7% FOOD STORES 748. 9 14. 3% 2. 7% INDEPENDENTS 952. 1 18. 2% 0. 7% RETAIL Source: IQVIA, Rx. Insights, February 2018
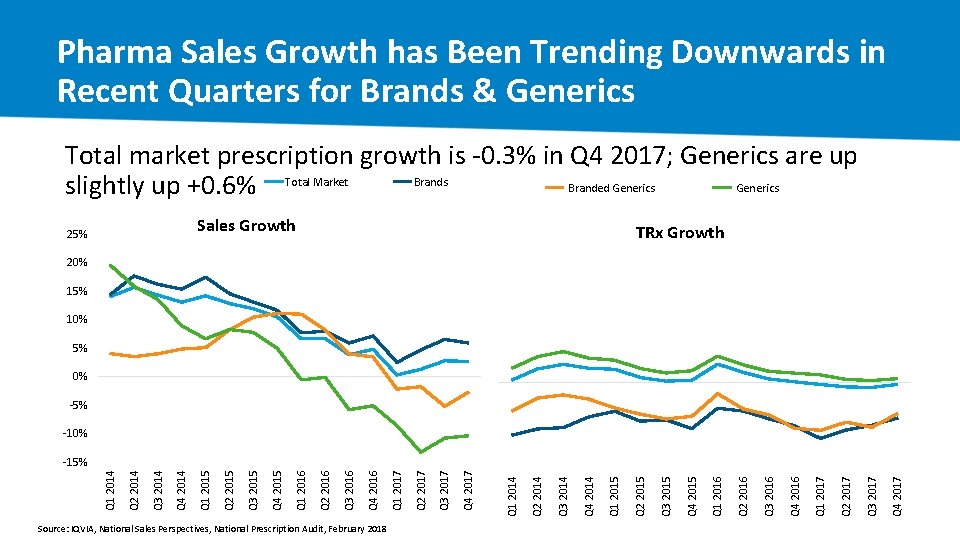
Pharma Sales Growth has Been Trending Downwards in Recent Quarters for Brands & Generics Total market prescription growth is 0. 3% in Q 4 2017; Generics are up Brands Branded Generics slightly up +0. 6% Total Market Sales Growth 25% TRx Growth 20% 15% 10% Source: IQVIA, National Sales Perspectives, National Prescription Audit, February 2018 Q 4 2017 Q 3 2017 Q 2 2017 Q 1 2017 Q 4 2016 Q 3 2016 Q 2 2016 Q 1 2016 Q 4 2015 Q 3 2015 Q 2 2015 Q 1 2015 Q 4 2014 Q 3 2014 Q 2 2014 Q 1 2014 15%
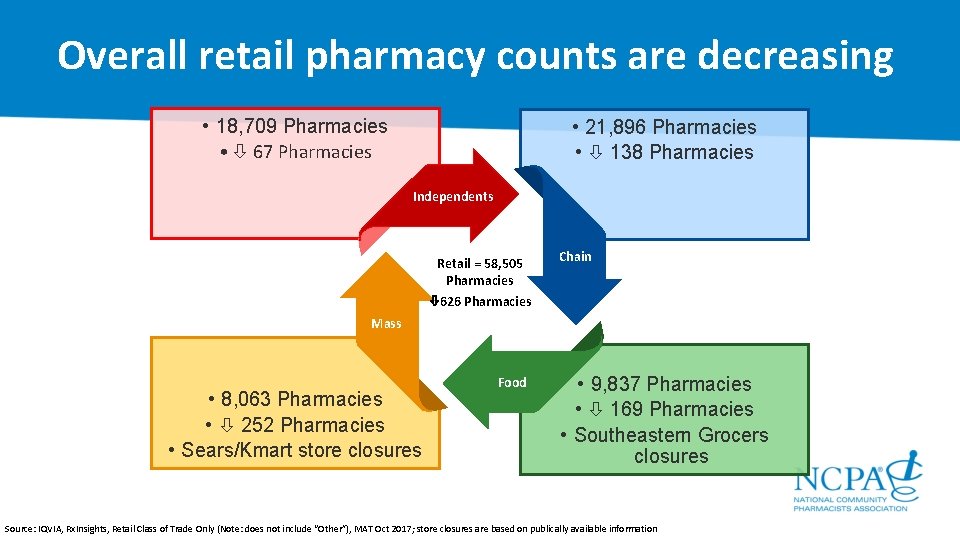
Overall retail pharmacy counts are decreasing • 18, 709 Pharmacies • 67 Pharmacies • 21, 896 Pharmacies • 138 Pharmacies Independents Retail = 58, 505 Pharmacies 626 Pharmacies Chain Mass • 8, 063 Pharmacies • 252 Pharmacies • Sears/Kmart store closures Food • 9, 837 Pharmacies • 169 Pharmacies • Southeastern Grocers closures Source: IQVIA, Rx. Insights, Retail Class of Trade Only (Note: does not include “Other”), MAT Oct 2017; store closures are based on publically available information
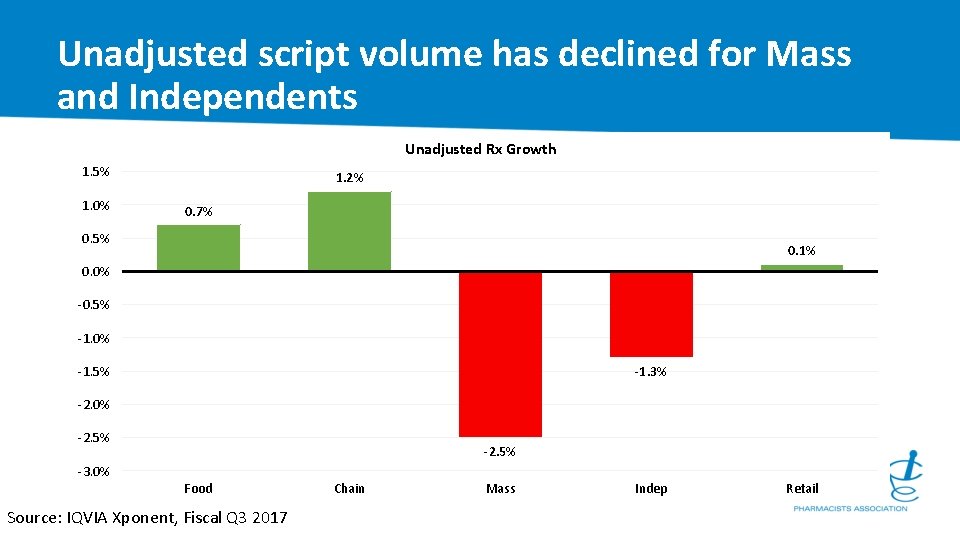
Unadjusted script volume has declined for Mass and Independents Unadjusted Rx Growth 1. 5% 1. 0% 1. 2% 0. 7% 0. 5% 0. 1% 0. 0% 0. 5% 1. 0% 1. 5% -1. 3% 2. 0% 2. 5% -2. 5% 3. 0% Food Source: IQVIA Xponent, Fiscal Q 3 2017 Chain Mass Indep Retail
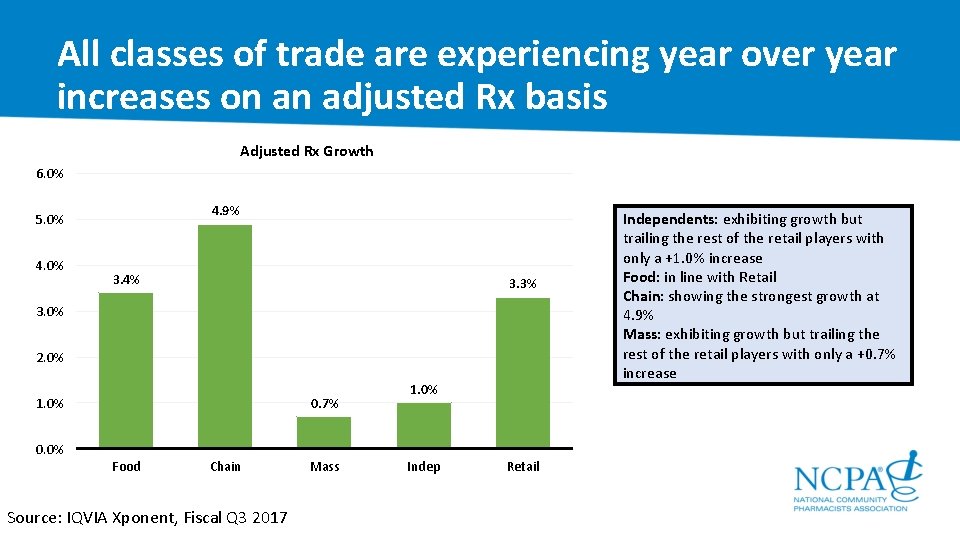
All classes of trade are experiencing year over year increases on an adjusted Rx basis Adjusted Rx Growth 6. 0% 4. 9% 5. 0% 4. 0% 3. 4% 3. 3% 3. 0% 2. 0% 0. 7% 1. 0% 0. 0% Food Chain Source: IQVIA Xponent, Fiscal Q 3 2017 Mass Indep Retail Independents: exhibiting growth but trailing the rest of the retail players with only a +1. 0% increase Food: in line with Retail Chain: showing the strongest growth at 4. 9% Mass: exhibiting growth but trailing the rest of the retail players with only a +0. 7% increase
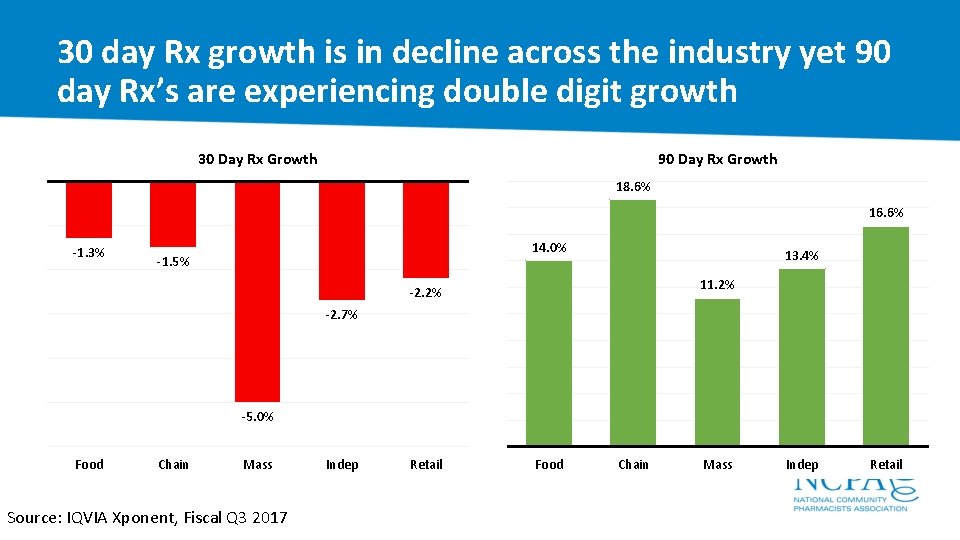
30 day Rx growth is in decline across the industry yet 90 day Rx’s are experiencing double digit growth 30 Day Rx Growth 90 Day Rx Growth 18. 6% 16. 6% -1. 3% 14. 0% -1. 5% 13. 4% 11. 2% -2. 7% -5. 0% Food Chain Mass Source: IQVIA Xponent, Fiscal Q 3 2017 Indep Retail Food Chain Mass Indep Retail
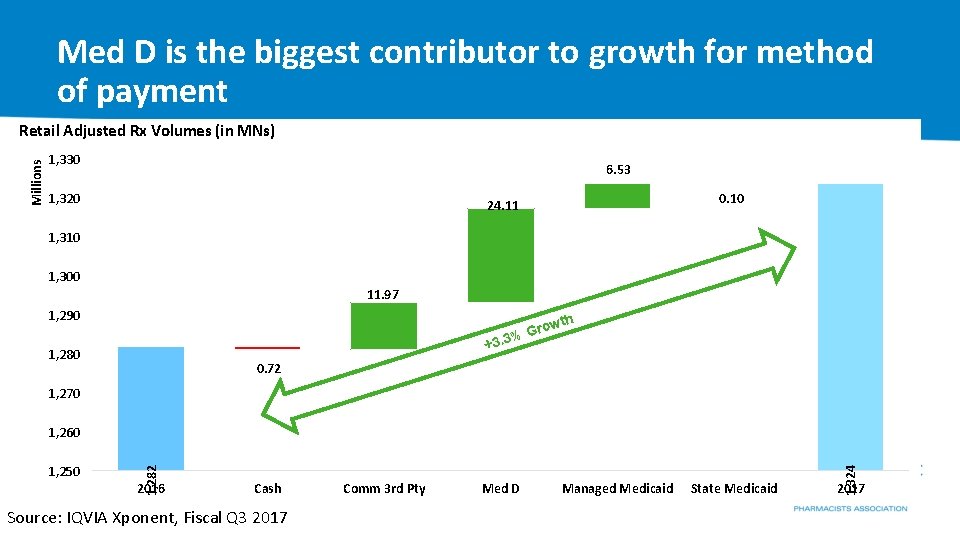
Med D is the biggest contributor to growth for method of payment Millions Retail Adjusted Rx Volumes (in MNs) 1, 330 6. 53 1, 320 0. 10 24. 11 1, 310 1, 300 11. 97 1, 290 1, 280 th row G % +3. 3 Growth 3. 3% + 0. 72 1, 270 2016 Cash Source: IQVIA Xponent, Fiscal Q 3 2017 Comm 3 rd Pty Med D Managed Medicaid State Medicaid 1, 324 1, 250 1, 282 1, 260 2017
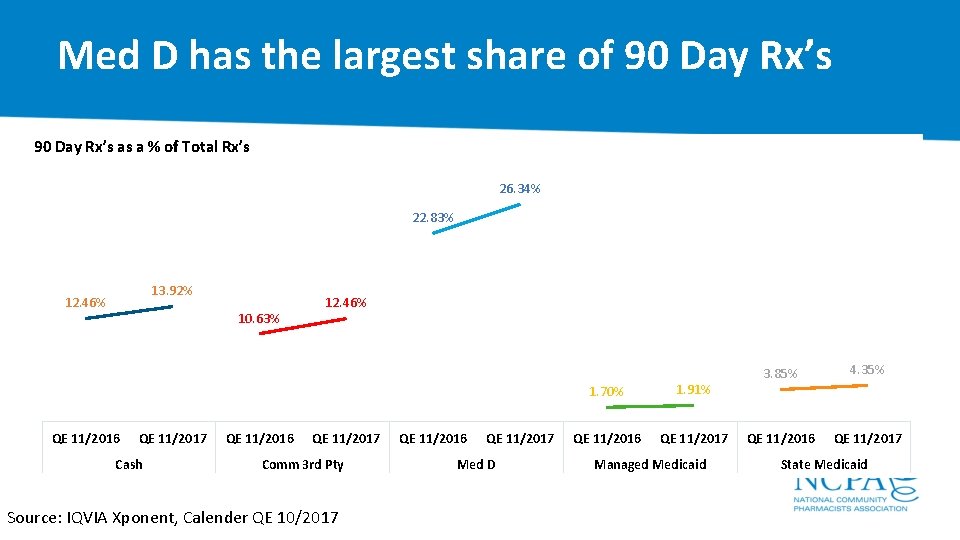
Med D has the largest share of 90 Day Rx’s as a % of Total Rx’s 26. 34% 22. 83% 13. 92% 12. 46% 10. 63% QE 11/2016 QE 11/2017 Cash QE 11/2016 12. 46% QE 11/2017 Comm 3 rd Pty Source: IQVIA Xponent, Calender QE 10/2017 QE 11/2016 QE 11/2017 Med D 1. 70% 1. 91% QE 11/2016 QE 11/2017 Managed Medicaid 3. 85% 4. 35% QE 11/2016 QE 11/2017 State Medicaid
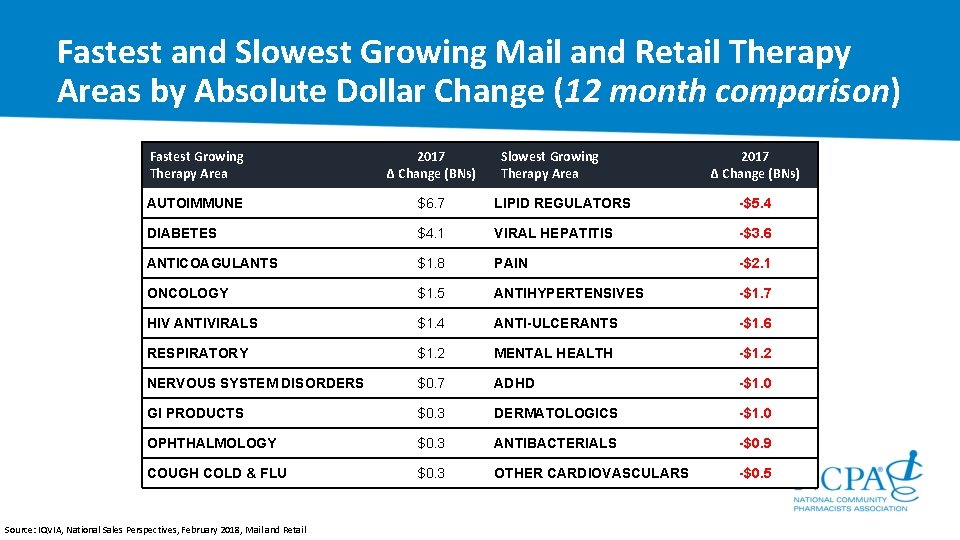
Fastest and Slowest Growing Mail and Retail Therapy Areas by Absolute Dollar Change (12 month comparison) Fastest Growing Therapy Area 2017 Δ Change (BNs) AUTOIMMUNE $6. 7 LIPID REGULATORS -$5. 4 DIABETES $4. 1 VIRAL HEPATITIS -$3. 6 ANTICOAGULANTS $1. 8 PAIN -$2. 1 ONCOLOGY $1. 5 ANTIHYPERTENSIVES -$1. 7 HIV ANTIVIRALS $1. 4 ANTI-ULCERANTS -$1. 6 RESPIRATORY $1. 2 MENTAL HEALTH -$1. 2 NERVOUS SYSTEM DISORDERS $0. 7 ADHD -$1. 0 GI PRODUCTS $0. 3 DERMATOLOGICS -$1. 0 OPHTHALMOLOGY $0. 3 ANTIBACTERIALS -$0. 9 COUGH COLD & FLU $0. 3 OTHER CARDIOVASCULARS -$0. 5 Source: IQVIA, National Sales Perspectives, February 2018, Mail and Retail Slowest Growing Therapy Area 2017 Δ Change (BNs)
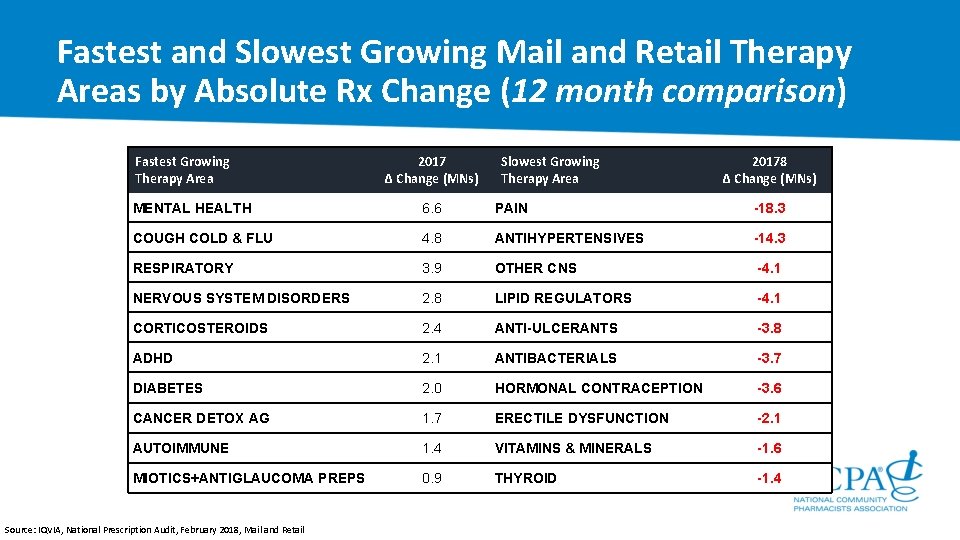
Fastest and Slowest Growing Mail and Retail Therapy Areas by Absolute Rx Change (12 month comparison) Fastest Growing Therapy Area 2017 Δ Change (MNs) Slowest Growing Therapy Area 20178 Δ Change (MNs) MENTAL HEALTH 6. 6 PAIN -18. 3 COUGH COLD & FLU 4. 8 ANTIHYPERTENSIVES -14. 3 RESPIRATORY 3. 9 OTHER CNS -4. 1 NERVOUS SYSTEM DISORDERS 2. 8 LIPID REGULATORS -4. 1 CORTICOSTEROIDS 2. 4 ANTI-ULCERANTS -3. 8 ADHD 2. 1 ANTIBACTERIALS -3. 7 DIABETES 2. 0 HORMONAL CONTRACEPTION -3. 6 CANCER DETOX AG 1. 7 ERECTILE DYSFUNCTION -2. 1 AUTOIMMUNE 1. 4 VITAMINS & MINERALS -1. 6 MIOTICS+ANTIGLAUCOMA PREPS 0. 9 THYROID -1. 4 Source: IQVIA, National Prescription Audit, February 2018, Mail and Retail
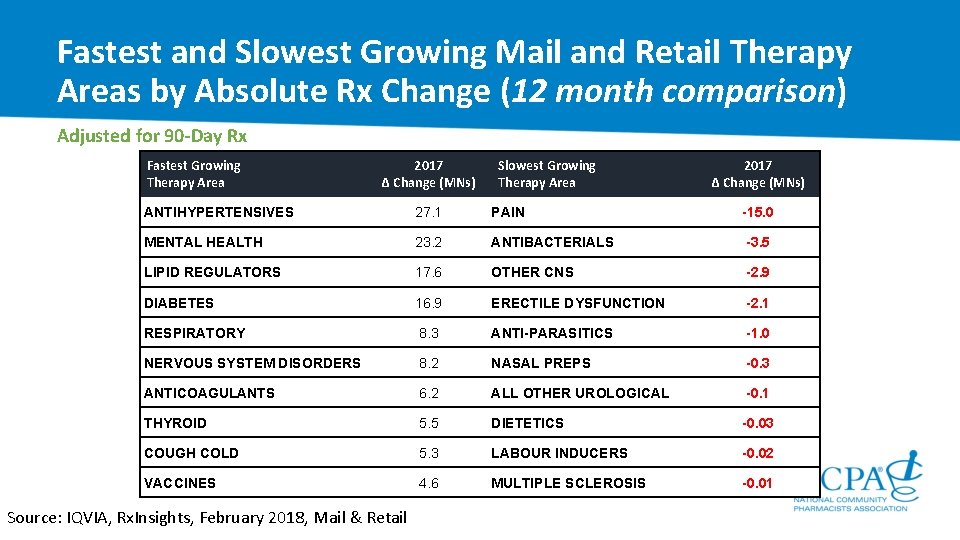
Fastest and Slowest Growing Mail and Retail Therapy Areas by Absolute Rx Change (12 month comparison) Adjusted for 90 -Day Rx Fastest Growing Therapy Area 2017 Δ Change (MNs) Slowest Growing Therapy Area 2017 Δ Change (MNs) ANTIHYPERTENSIVES 27. 1 PAIN -15. 0 MENTAL HEALTH 23. 2 ANTIBACTERIALS -3. 5 LIPID REGULATORS 17. 6 OTHER CNS -2. 9 DIABETES 16. 9 ERECTILE DYSFUNCTION -2. 1 RESPIRATORY 8. 3 ANTI-PARASITICS -1. 0 NERVOUS SYSTEM DISORDERS 8. 2 NASAL PREPS -0. 3 ANTICOAGULANTS 6. 2 ALL OTHER UROLOGICAL -0. 1 THYROID 5. 5 DIETETICS -0. 03 COUGH COLD 5. 3 LABOUR INDUCERS -0. 02 VACCINES 4. 6 MULTIPLE SCLEROSIS -0. 01 Source: IQVIA, Rx. Insights, February 2018, Mail & Retail
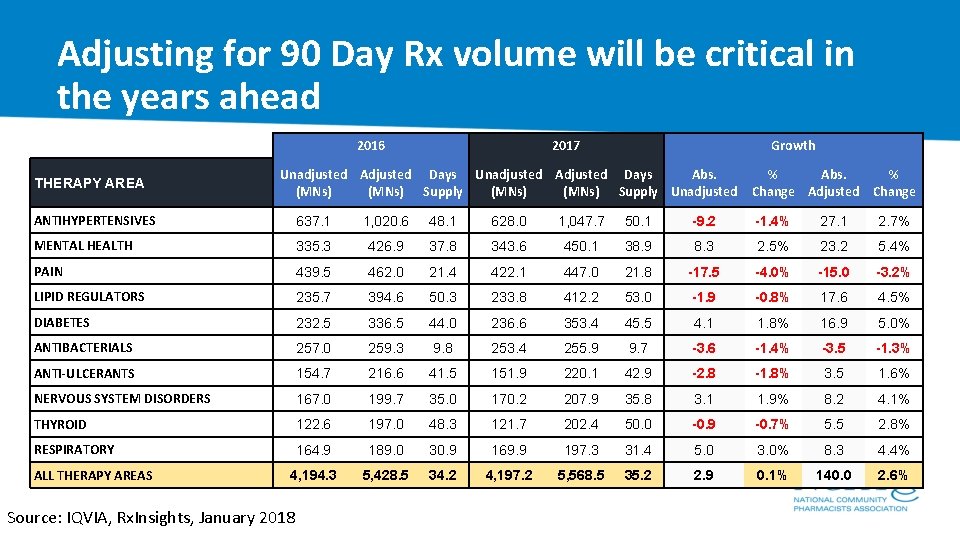
Adjusting for 90 Day Rx volume will be critical in the years ahead 2016 THERAPY AREA 2017 Growth Unadjusted Adjusted Days Abs. (MNs) Supply Unadjusted % Abs. % Change Adjusted Change ANTIHYPERTENSIVES 637. 1 1, 020. 6 48. 1 628. 0 1, 047. 7 50. 1 -9. 2 -1. 4% 27. 1 2. 7% MENTAL HEALTH 335. 3 426. 9 37. 8 343. 6 450. 1 38. 9 8. 3 2. 5% 23. 2 5. 4% PAIN 439. 5 462. 0 21. 4 422. 1 447. 0 21. 8 -17. 5 -4. 0% -15. 0 -3. 2% LIPID REGULATORS 235. 7 394. 6 50. 3 233. 8 412. 2 53. 0 -1. 9 -0. 8% 17. 6 4. 5% DIABETES 232. 5 336. 5 44. 0 236. 6 353. 4 45. 5 4. 1 1. 8% 16. 9 5. 0% ANTIBACTERIALS 257. 0 259. 3 9. 8 253. 4 255. 9 9. 7 -3. 6 -1. 4% -3. 5 -1. 3% ANTI-ULCERANTS 154. 7 216. 6 41. 5 151. 9 220. 1 42. 9 -2. 8 -1. 8% 3. 5 1. 6% NERVOUS SYSTEM DISORDERS 167. 0 199. 7 35. 0 170. 2 207. 9 35. 8 3. 1 1. 9% 8. 2 4. 1% THYROID 122. 6 197. 0 48. 3 121. 7 202. 4 50. 0 -0. 9 -0. 7% 5. 5 2. 8% RESPIRATORY 164. 9 189. 0 30. 9 169. 9 197. 3 31. 4 5. 0 3. 0% 8. 3 4. 4% 4, 194. 3 5, 428. 5 34. 2 4, 197. 2 5, 568. 5 35. 2 2. 9 0. 1% 140. 0 2. 6% ALL THERAPY AREAS Source: IQVIA, Rx. Insights, January 2018
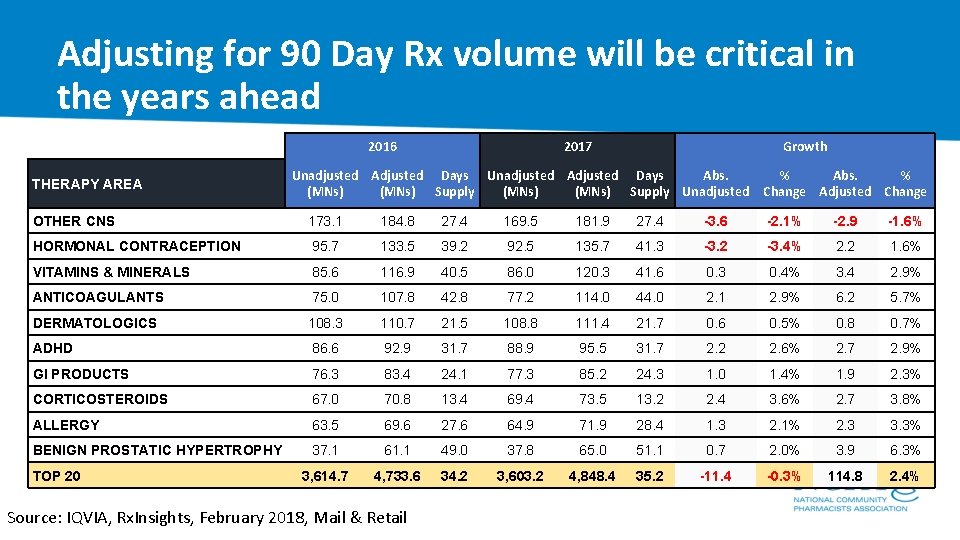
Adjusting for 90 Day Rx volume will be critical in the years ahead 2016 THERAPY AREA 2017 Growth Unadjusted Adjusted Days Abs. (MNs) Supply Unadjusted % Abs. % Change Adjusted Change OTHER CNS 173. 1 184. 8 27. 4 169. 5 181. 9 27. 4 -3. 6 -2. 1% -2. 9 -1. 6% HORMONAL CONTRACEPTION 95. 7 133. 5 39. 2 92. 5 135. 7 41. 3 -3. 2 -3. 4% 2. 2 1. 6% VITAMINS & MINERALS 85. 6 116. 9 40. 5 86. 0 120. 3 41. 6 0. 3 0. 4% 3. 4 2. 9% ANTICOAGULANTS 75. 0 107. 8 42. 8 77. 2 114. 0 44. 0 2. 1 2. 9% 6. 2 5. 7% DERMATOLOGICS 108. 3 110. 7 21. 5 108. 8 111. 4 21. 7 0. 6 0. 5% 0. 8 0. 7% ADHD 86. 6 92. 9 31. 7 88. 9 95. 5 31. 7 2. 2 2. 6% 2. 7 2. 9% GI PRODUCTS 76. 3 83. 4 24. 1 77. 3 85. 2 24. 3 1. 0 1. 4% 1. 9 2. 3% CORTICOSTEROIDS 67. 0 70. 8 13. 4 69. 4 73. 5 13. 2 2. 4 3. 6% 2. 7 3. 8% ALLERGY 63. 5 69. 6 27. 6 64. 9 71. 9 28. 4 1. 3 2. 1% 2. 3 3. 3% BENIGN PROSTATIC HYPERTROPHY 37. 1 61. 1 49. 0 37. 8 65. 0 51. 1 0. 7 2. 0% 3. 9 6. 3% 3, 614. 7 4, 733. 6 34. 2 3, 603. 2 4, 848. 4 35. 2 -11. 4 -0. 3% 114. 8 2. 4% TOP 20 Source: IQVIA, Rx. Insights, February 2018, Mail & Retail
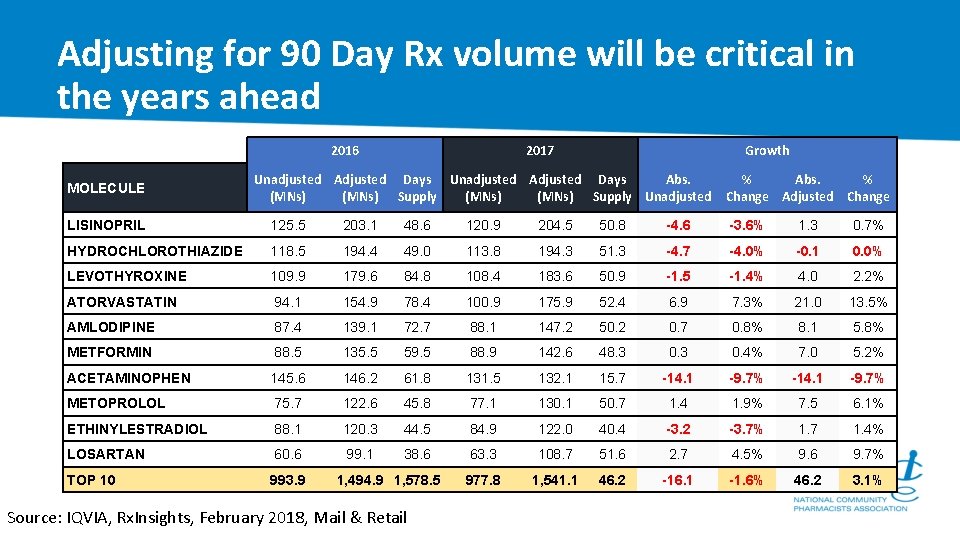
Adjusting for 90 Day Rx volume will be critical in the years ahead 2016 MOLECULE 2017 Growth Unadjusted Adjusted Days Abs. (MNs) Supply Unadjusted % Abs. % Change Adjusted Change LISINOPRIL 125. 5 203. 1 48. 6 120. 9 204. 5 50. 8 -4. 6 -3. 6% 1. 3 0. 7% HYDROCHLOROTHIAZIDE 118. 5 194. 4 49. 0 113. 8 194. 3 51. 3 -4. 7 -4. 0% -0. 1 0. 0% LEVOTHYROXINE 109. 9 179. 6 84. 8 108. 4 183. 6 50. 9 -1. 5 -1. 4% 4. 0 2. 2% ATORVASTATIN 94. 1 154. 9 78. 4 100. 9 175. 9 52. 4 6. 9 7. 3% 21. 0 13. 5% AMLODIPINE 87. 4 139. 1 72. 7 88. 1 147. 2 50. 2 0. 7 0. 8% 8. 1 5. 8% METFORMIN 88. 5 135. 5 59. 5 88. 9 142. 6 48. 3 0. 4% 7. 0 5. 2% ACETAMINOPHEN 145. 6 146. 2 61. 8 131. 5 132. 1 15. 7 -14. 1 -9. 7% METOPROLOL 75. 7 122. 6 45. 8 77. 1 130. 1 50. 7 1. 4 1. 9% 7. 5 6. 1% ETHINYLESTRADIOL 88. 1 120. 3 44. 5 84. 9 122. 0 40. 4 -3. 2 -3. 7% 1. 7 1. 4% LOSARTAN 60. 6 99. 1 38. 6 63. 3 108. 7 51. 6 2. 7 4. 5% 9. 6 9. 7% TOP 10 993. 9 977. 8 1, 541. 1 46. 2 -16. 1 -1. 6% 46. 2 3. 1% 1, 494. 9 1, 578. 5 Source: IQVIA, Rx. Insights, February 2018, Mail & Retail
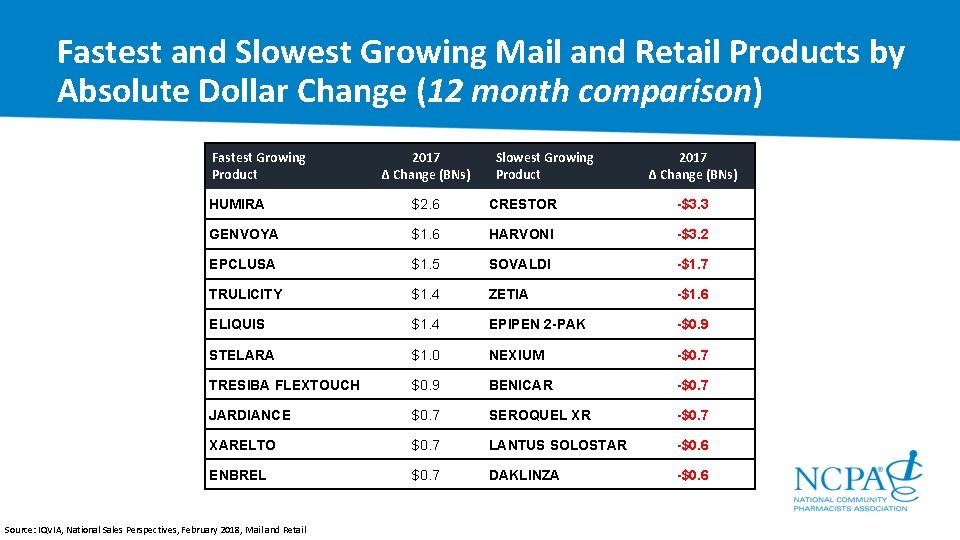
Fastest and Slowest Growing Mail and Retail Products by Absolute Dollar Change (12 month comparison) Fastest Growing Product 2017 Δ Change (BNs) Slowest Growing Product 2017 Δ Change (BNs) HUMIRA $2. 6 CRESTOR -$3. 3 GENVOYA $1. 6 HARVONI -$3. 2 EPCLUSA $1. 5 SOVALDI -$1. 7 TRULICITY $1. 4 ZETIA -$1. 6 ELIQUIS $1. 4 EPIPEN 2 -PAK -$0. 9 STELARA $1. 0 NEXIUM -$0. 7 TRESIBA FLEXTOUCH $0. 9 BENICAR -$0. 7 JARDIANCE $0. 7 SEROQUEL XR -$0. 7 XARELTO $0. 7 LANTUS SOLOSTAR -$0. 6 ENBREL $0. 7 DAKLINZA -$0. 6 Source: IQVIA, National Sales Perspectives, February 2018, Mail and Retail
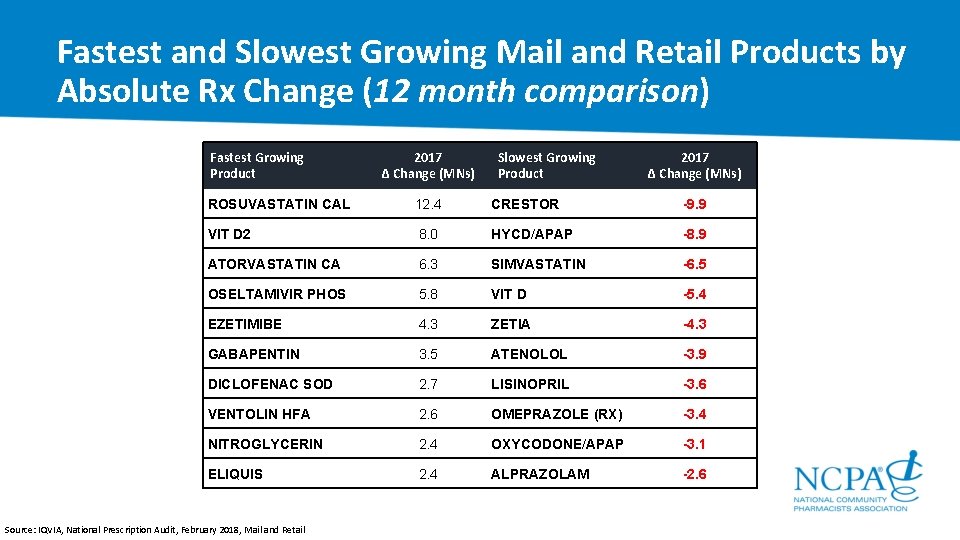
Fastest and Slowest Growing Mail and Retail Products by Absolute Rx Change (12 month comparison) Fastest Growing Product 2017 Δ Change (MNs) Slowest Growing Product 2017 Δ Change (MNs) ROSUVASTATIN CAL 12. 4 CRESTOR -9. 9 VIT D 2 8. 0 HYCD/APAP -8. 9 ATORVASTATIN CA 6. 3 SIMVASTATIN -6. 5 OSELTAMIVIR PHOS 5. 8 VIT D -5. 4 EZETIMIBE 4. 3 ZETIA -4. 3 GABAPENTIN 3. 5 ATENOLOL -3. 9 DICLOFENAC SOD 2. 7 LISINOPRIL -3. 6 VENTOLIN HFA 2. 6 OMEPRAZOLE (RX) -3. 4 NITROGLYCERIN 2. 4 OXYCODONE/APAP -3. 1 ELIQUIS 2. 4 ALPRAZOLAM -2. 6 Source: IQVIA, National Prescription Audit, February 2018, Mail and Retail
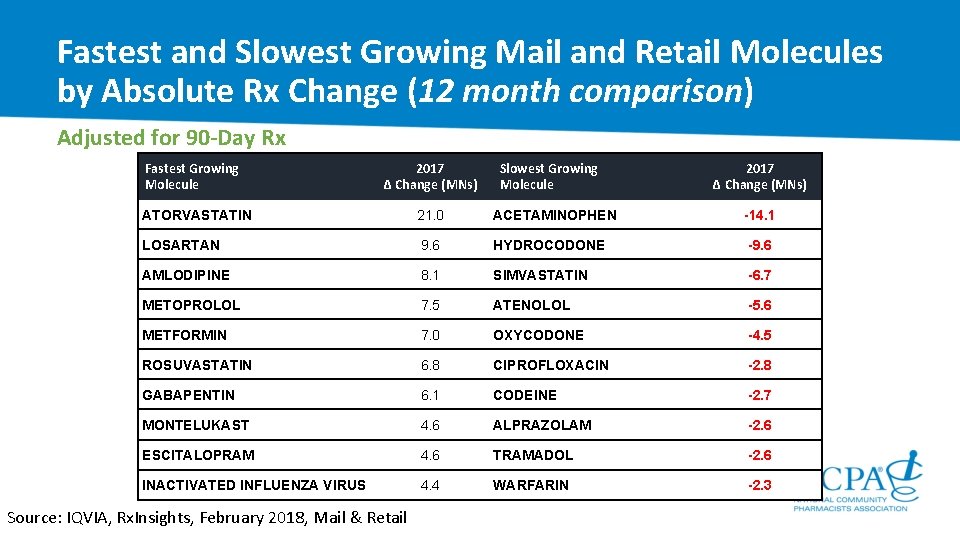
Fastest and Slowest Growing Mail and Retail Molecules by Absolute Rx Change (12 month comparison) Adjusted for 90 -Day Rx Fastest Growing Molecule 2017 Δ Change (MNs) Slowest Growing Molecule 2017 Δ Change (MNs) ATORVASTATIN 21. 0 ACETAMINOPHEN -14. 1 LOSARTAN 9. 6 HYDROCODONE -9. 6 AMLODIPINE 8. 1 SIMVASTATIN -6. 7 METOPROLOL 7. 5 ATENOLOL -5. 6 METFORMIN 7. 0 OXYCODONE -4. 5 ROSUVASTATIN 6. 8 CIPROFLOXACIN -2. 8 GABAPENTIN 6. 1 CODEINE -2. 7 MONTELUKAST 4. 6 ALPRAZOLAM -2. 6 ESCITALOPRAM 4. 6 TRAMADOL -2. 6 INACTIVATED INFLUENZA VIRUS 4. 4 WARFARIN -2. 3 Source: IQVIA, Rx. Insights, February 2018, Mail & Retail
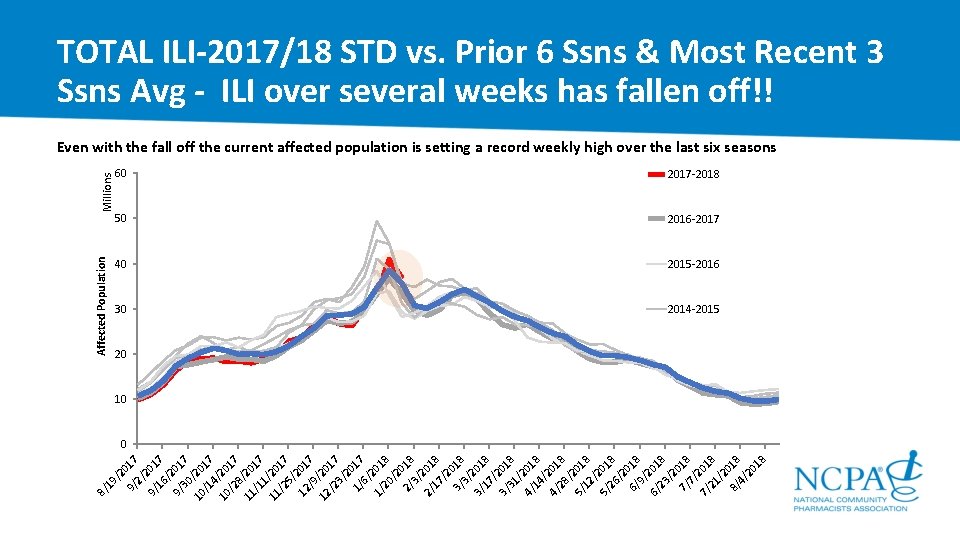
9/ 017 2/ 9/ 201 16 7 / 9/ 201 30 7 10 /20 /1 17 4 10 /2 17 8 11 /20 /1 17 1 11 /20 /2 17 5/ 12 201 /9 7 12 /20 /2 17 3/ 2 1/ 017 6/ 1/ 201 20 8 /2 2/ 018 3/ 2/ 201 17 8 /2 3/ 018 3/ 3/ 201 17 8 / 3/ 201 31 8 / 4/ 201 14 8 / 4/ 201 28 8 / 5/ 201 12 8 / 5/ 201 26 8 /2 6/ 018 9/ 6/ 201 23 8 /2 7/ 018 7/ 7/ 201 21 8 /2 8/ 018 4/ 20 18 /2 19 8/ Affected Population Millions TOTAL ILI-2017/18 STD vs. Prior 6 Ssns & Most Recent 3 Ssns Avg - ILI over several weeks has fallen off!! Even with the fall off the current affected population is setting a record weekly high over the last six seasons 60 2017 2018 50 2016 2017 40 2015 2016 30 2014 2015 20 10 0
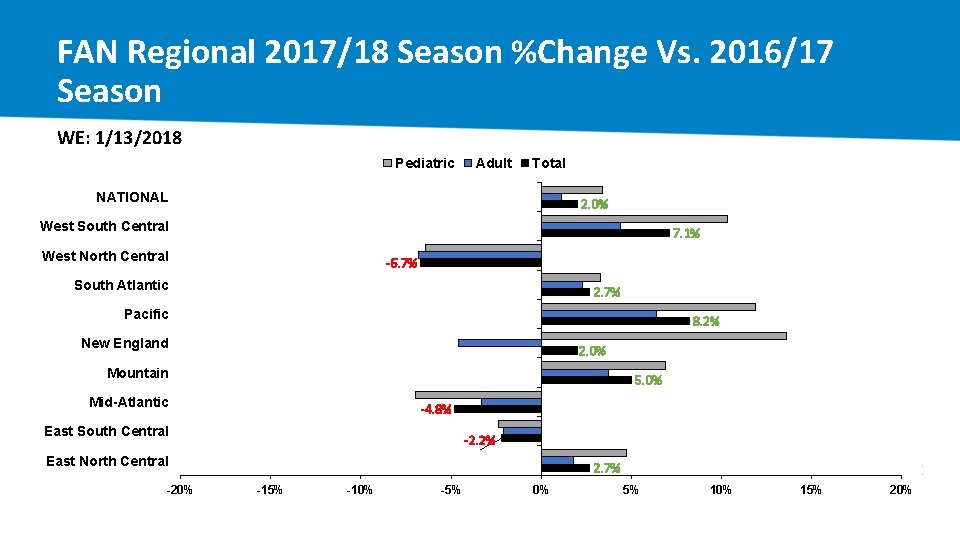
FAN Regional 2017/18 Season %Change Vs. 2016/17 Season WE: 1/13/2018 Pediatric Adult Total NATIONAL 2. 0% West South Central 7. 1% West North Central -6. 7% South Atlantic 2. 7% Pacific 8. 2% New England 2. 0% Mountain 5. 0% Mid-Atlantic -4. 8% East South Central -2. 2% East North Central -20% 2. 7% -15% -10% -5% 0% 5% 10% 15% 20%
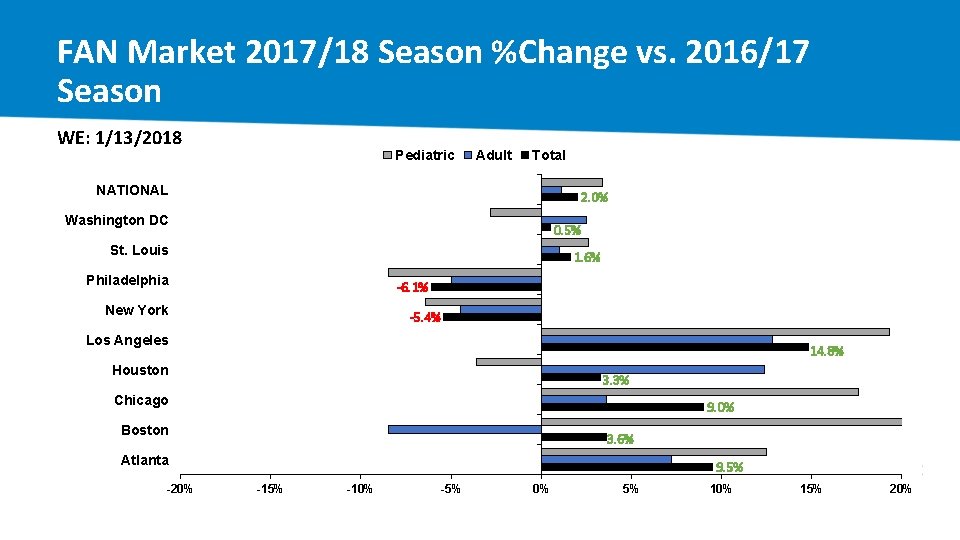
FAN Market 2017/18 Season %Change vs. 2016/17 Season WE: 1/13/2018 Pediatric Adult Total NATIONAL 2. 0% Washington DC 0. 5% St. Louis 1. 6% Philadelphia -6. 1% New York -5. 4% Los Angeles 14. 8% Houston 3. 3% Chicago 9. 0% Boston 3. 6% Atlanta -20% 9. 5% -10% -5% 0% 5% 10% 15% 20%
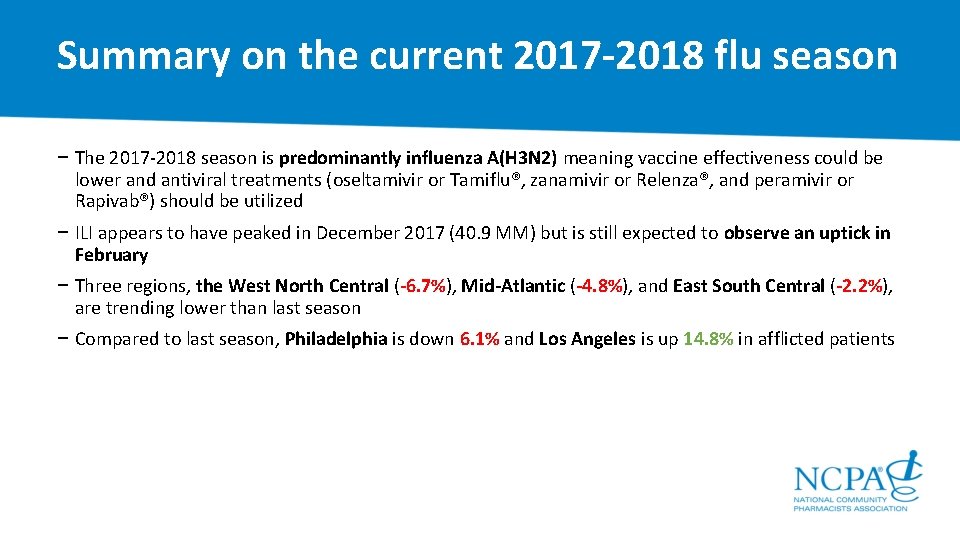
Summary on the current 2017 -2018 flu season − The 2017 2018 season is predominantly influenza A(H 3 N 2) meaning vaccine effectiveness could be lower and antiviral treatments (oseltamivir or Tamiflu®, zanamivir or Relenza®, and peramivir or Rapivab®) should be utilized − ILI appears to have peaked in December 2017 (40. 9 MM) but is still expected to observe an uptick in February − Three regions, the West North Central (-6. 7%), Mid-Atlantic (-4. 8%), and East South Central (-2. 2%), are trending lower than last season − Compared to last season, Philadelphia is down 6. 1% and Los Angeles is up 14. 8% in afflicted patients
A Year in Review Market Performance 01 Market Access, Deductibles, & Reimbursement 02 Hot Topic 1: “Cash Business” 03 Hot Topic 2: Adherence 04 Hot Topic 3: Opioids 05 A Look Forward to 2018 & Recap 06
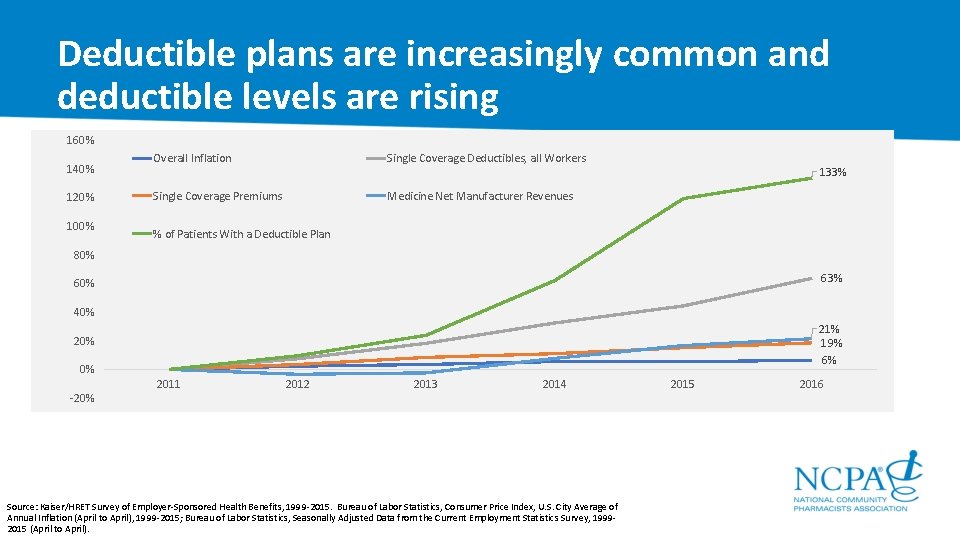
Deductible plans are increasingly common and deductible levels are rising 160% Overall Inflation Single Coverage Deductibles, all Workers Cumulative Increases in Deductibles, Premiums, Wages and 140% Single Coverage Premiums Medicine Net Manufacturer Revenues Inflation 120% 100% 133% % of Patients With a Deductible Plan 80% 63% 60% 40% 21% 19% 6% 20% 0% 2011 2012 2013 2014 Source: Kaiser/HRET Survey of Employer Sponsored Health Benefits, 1999 2015. Bureau of Labor Statistics, Consumer Price Index, U. S. City Average of Annual Inflation (April to April), 1999 2015; Bureau of Labor Statistics, Seasonally Adjusted Data from the Current Employment Statistics Survey, 1999 2015 (April to April). 2015 2016
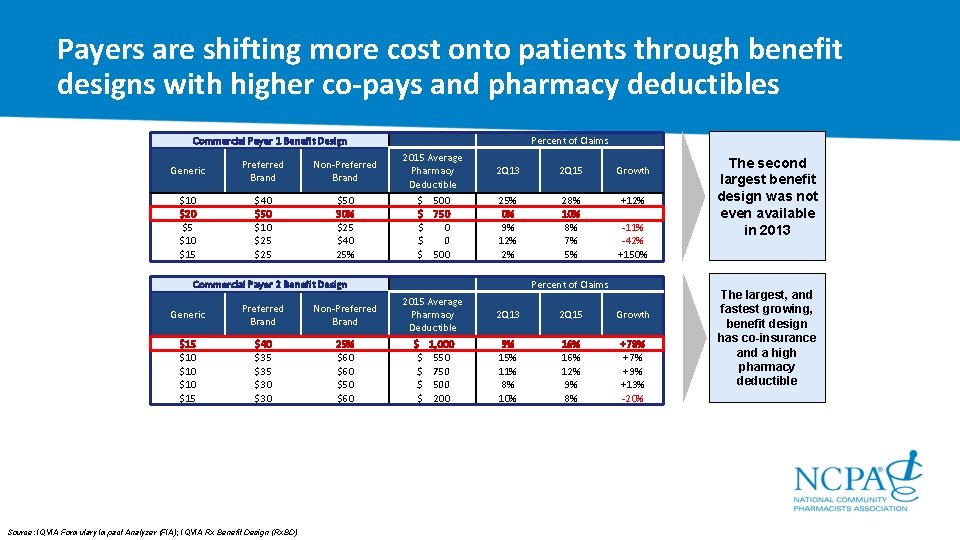
Payers are shifting more cost onto patients through benefit designs with higher co-pays and pharmacy deductibles Commercial Payer 1 Benefit Design Generic Preferred Brand Non-Preferred Brand $10 $20 $5 $10 $15 $40 $50 $10 $25 $50 30% $25 $40 25% Commercial Payer 2 Benefit Design Generic Preferred Brand Non-Preferred Brand $15 $10 $10 $15 $40 $35 $30 25% $60 $50 $60 Source: IQVIA Formulary Impact Analyzer (FIA); IQVIA Rx Benefit Design (Rx. BD) Percent of Claims 2015 Average Pharmacy Deductible $ 500 $ 750 $ 0 $ 500 2 Q 13 2 Q 15 Growth 25% 0% 9% 12% 2% 28% 10% 8% 7% 5% +12% -11% -42% +150% Percent of Claims 2015 Average Pharmacy Deductible $ 1, 000 $ 550 $ 750 $ 500 $ 200 2 Q 13 2 Q 15 Growth 9% 15% 11% 8% 10% 16% 12% 9% 8% +7% +9% +13% -20% The second largest benefit design was not even available in 2013 The largest, and fastest growing, benefit design has co-insurance and a high pharmacy deductible
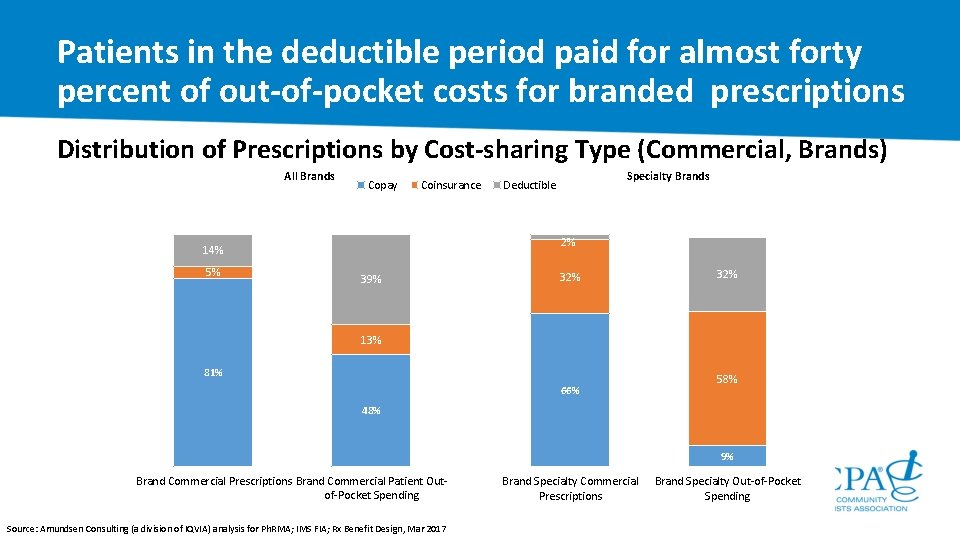
Patients in the deductible period paid for almost forty percent of out-of-pocket costs for branded prescriptions Distribution of Prescriptions by Cost-sharing Type (Commercial, Brands) All Brands Copay Coinsurance 2% 14% 5% Specialty Brands Deductible 39% 32% 13% 81% 66% 58% 48% 9% Brand Commercial Prescriptions Brand Commercial Patient Out of Pocket Spending Source: Amundsen Consulting (a division of IQVIA) analysis for Ph. RMA; IMS FIA; Rx Benefit Design, Mar 2017 Brand Specialty Commercial Prescriptions Brand Specialty Out of Pocket Spending
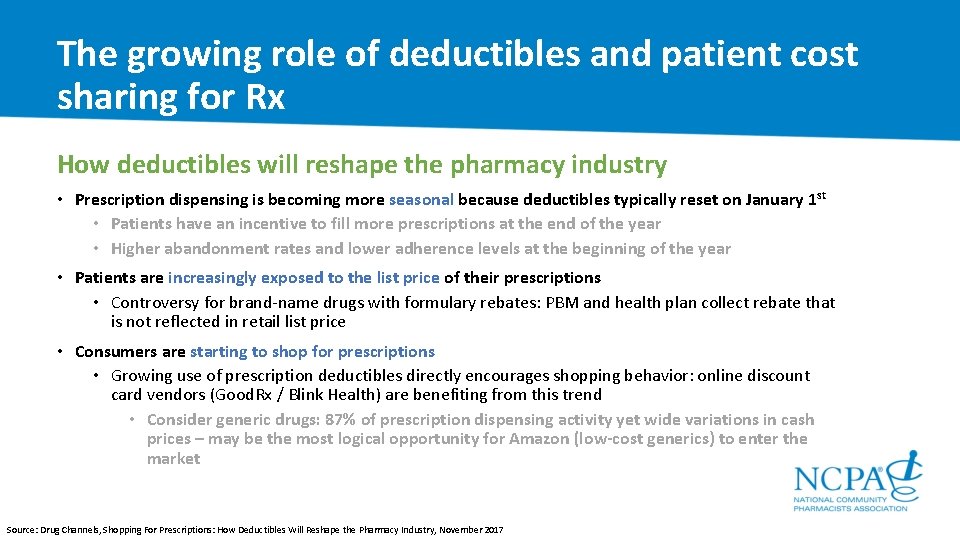
The growing role of deductibles and patient cost sharing for Rx How deductibles will reshape the pharmacy industry • Prescription dispensing is becoming more seasonal because deductibles typically reset on January 1 st • Patients have an incentive to fill more prescriptions at the end of the year • Higher abandonment rates and lower adherence levels at the beginning of the year • Patients are increasingly exposed to the list price of their prescriptions • Controversy for brand name drugs with formulary rebates: PBM and health plan collect rebate that is not reflected in retail list price • Consumers are starting to shop for prescriptions • Growing use of prescription deductibles directly encourages shopping behavior: online discount card vendors (Good. Rx / Blink Health) are benefiting from this trend • Consider generic drugs: 87% of prescription dispensing activity yet wide variations in cash prices – may be the most logical opportunity for Amazon (low-cost generics) to enter the market Source: Drug Channels, Shopping For Prescriptions: How Deductibles Will Reshape the Pharmacy Industry, November 2017
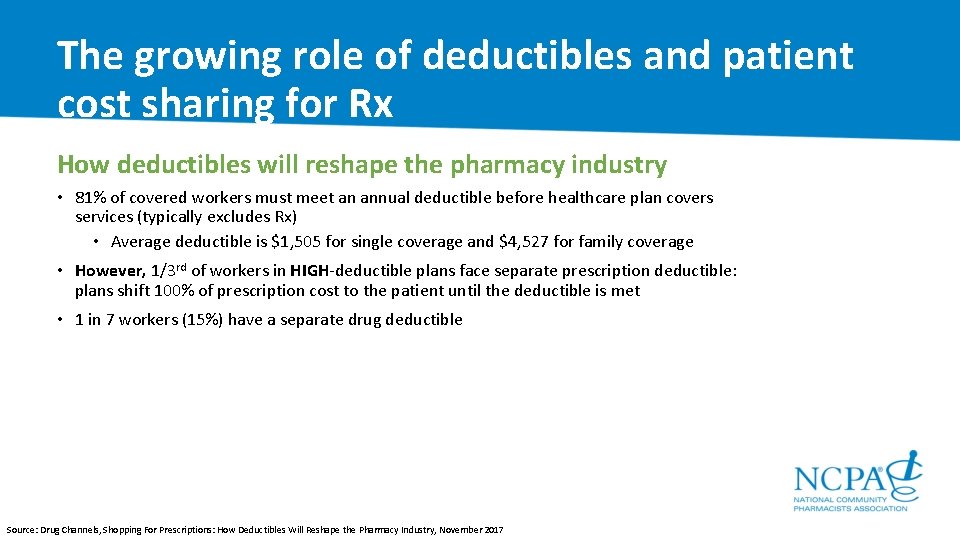
The growing role of deductibles and patient cost sharing for Rx How deductibles will reshape the pharmacy industry • 81% of covered workers must meet an annual deductible before healthcare plan covers services (typically excludes Rx) • Average deductible is $1, 505 for single coverage and $4, 527 for family coverage • However, 1/3 rd of workers in HIGH deductible plans face separate prescription deductible: plans shift 100% of prescription cost to the patient until the deductible is met • 1 in 7 workers (15%) have a separate drug deductible Source: Drug Channels, Shopping For Prescriptions: How Deductibles Will Reshape the Pharmacy Industry, November 2017
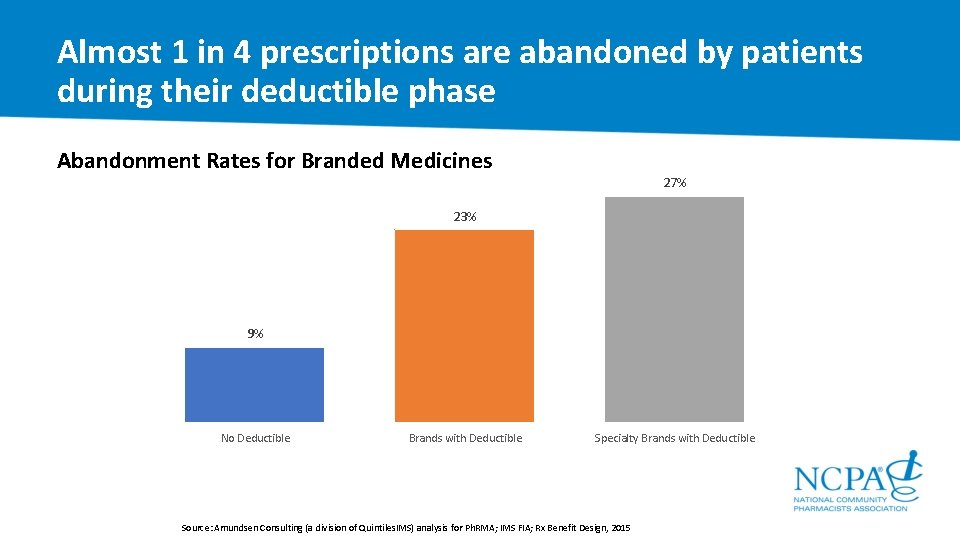
Almost 1 in 4 prescriptions are abandoned by patients during their deductible phase Abandonment Rates for Branded Medicines 27% 23% 9% No Deductible Brands with Deductible Specialty Brands with Deductible Source: Amundsen Consulting (a division of Quintiles. IMS) analysis for Ph. RMA; IMS FIA; Rx Benefit Design, 2015
A Year in Review Market Performance 01 Market Access, Deductibles, & Reimbursement 02 Hot Topic 1: “Cash Business” 03 Hot Topic 2: Adherence 04 Hot Topic 3: Opioids 05 A Look Forward to 2018 & Recap 06
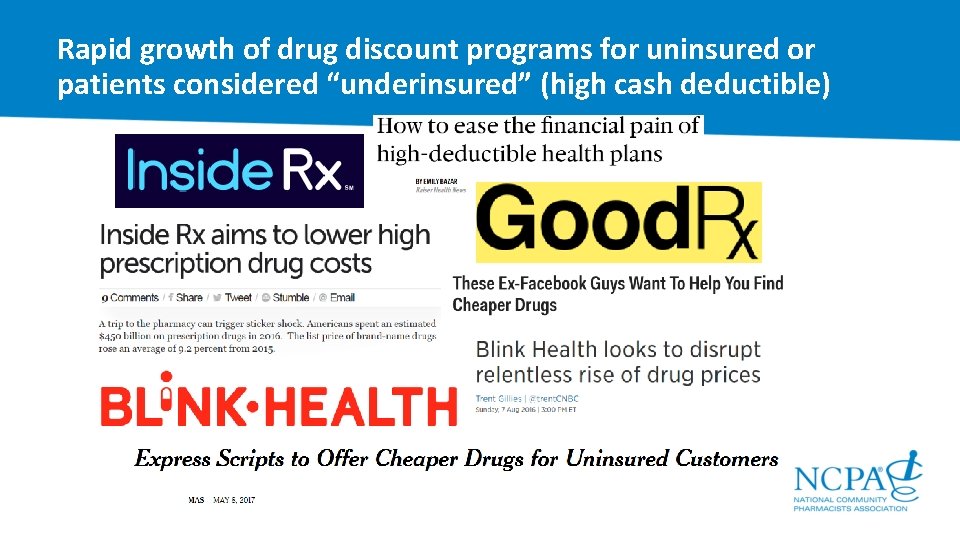
Rapid growth of drug discount programs for uninsured or patients considered “underinsured” (high cash deductible)
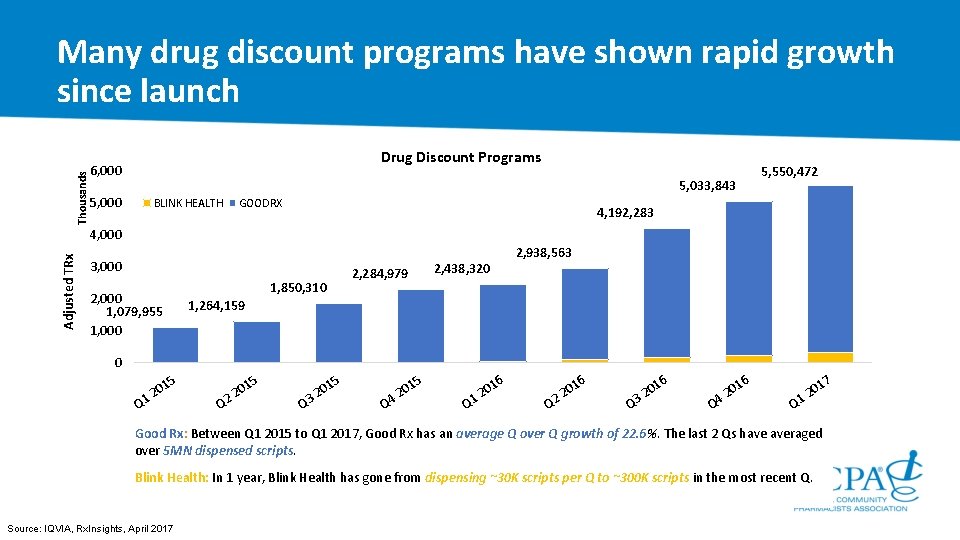
Thousands Many drug discount programs have shown rapid growth since launch Drug Discount Programs 6, 000 5, 550, 472 5, 033, 843 5, 000 BLINK HEALTH GOODRX 4, 192, 283 Adjusted TRx 4, 000 3, 000 2, 438, 320 2, 284, 979 1, 850, 310 2, 000 1, 079, 955 1, 000 2, 938, 563 1, 264, 159 0 Q 15 15 15 0 12 Q 0 22 Q 0 32 15 Q 0 42 16 Q 0 12 16 Q 0 22 16 16 Q 0 32 Q 0 42 17 0 12 Q Good Rx: Between Q 1 2015 to Q 1 2017, Good Rx has an average Q over Q growth of 22. 6%. The last 2 Qs have averaged over 5 MN dispensed scripts. Blink Health: In 1 year, Blink Health has gone from dispensing ~30 K scripts per Q to ~300 K scripts in the most recent Q. Source: IQVIA, Rx. Insights, April 2017
Inside Rx is an example of a drug discount program and was recently launched by Express Scripts / Good. Rx New York Times “Express Scripts to Offer Cheaper Drugs for Uninsured Customers” 1. Inside Rx offers discounts of 40+ common products (from cholesterol to diabetes prescriptions) to: • Patients without insurance • Patients with high-deductibles that could not otherwise afford medications • Addresses gross to net challenges of underinsured 2. Consumers sign-up for Inside Rx & either present a discount card or the mobile app to receive discounts • Average discount is one-third off the list price 3. Inside Rx is a subsidiary of Express Scripts and started in partnership with Good. Rx • Good. Rx is similarly structured to offer discounts on generic prescriptions 4. Inside Rx retail network includes 40, 000 pharmacy locations • Exclusively national and regional drug chains
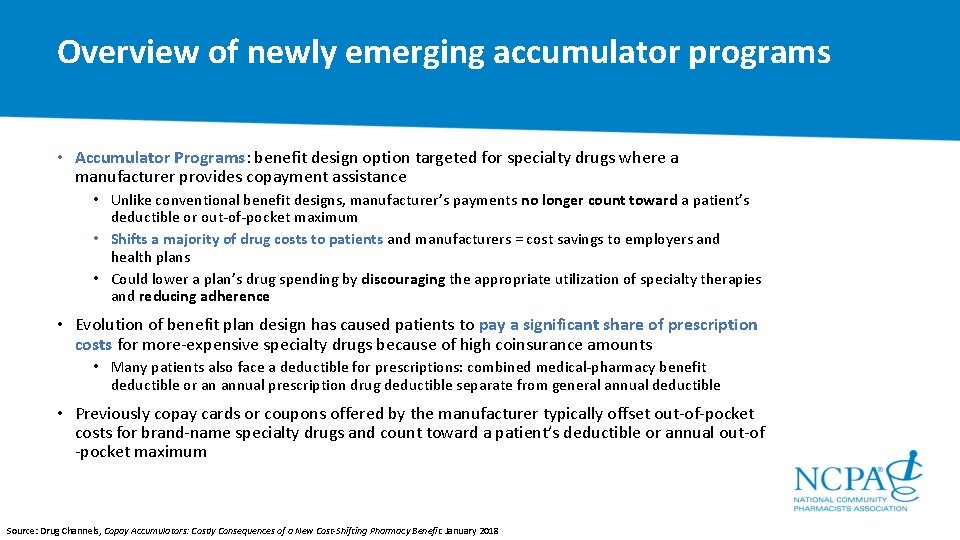
Overview of newly emerging accumulator programs • Accumulator Programs: benefit design option targeted for specialty drugs where a manufacturer provides copayment assistance • Unlike conventional benefit designs, manufacturer’s payments no longer count toward a patient’s deductible or out of pocket maximum • Shifts a majority of drug costs to patients and manufacturers = cost savings to employers and health plans • Could lower a plan’s drug spending by discouraging the appropriate utilization of specialty therapies and reducing adherence • Evolution of benefit plan design has caused patients to pay a significant share of prescription costs for more expensive specialty drugs because of high coinsurance amounts • Many patients also face a deductible for prescriptions: combined medical pharmacy benefit deductible or an annual prescription drug deductible separate from general annual deductible • Previously copay cards or coupons offered by the manufacturer typically offset out of pocket costs for brand name specialty drugs and count toward a patient’s deductible or annual out of pocket maximum Source: Drug Channels, Copay Accumulators: Costly Consequences of a New Cost-Shifting Pharmacy Benefit. January 2018
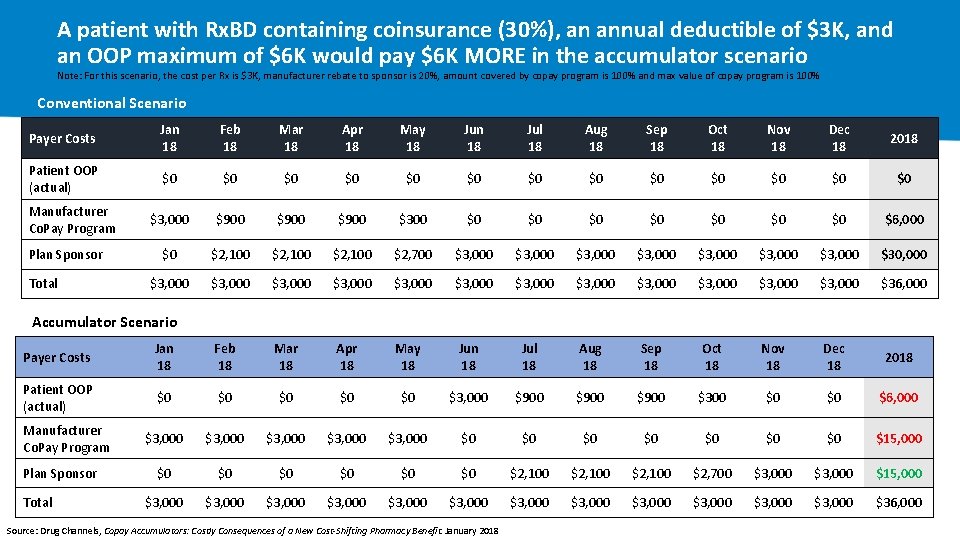
A patient with Rx. BD containing coinsurance (30%), an annual deductible of $3 K, and an OOP maximum of $6 K would pay $6 K MORE in the accumulator scenario Note: For this scenario, the cost per Rx is $3 K, manufacturer rebate to sponsor is 20%, amount covered by copay program is 100% and max value of copay program is 100% Conventional Scenario Payer Costs Jan 18 Feb 18 Mar 18 Apr 18 May 18 Jun 18 Jul 18 Aug 18 Sep 18 Oct 18 Nov 18 Dec 18 2018 Patient OOP (actual) $0 $0 $0 $0 $3, 000 $900 $300 $0 $0 $0 $6, 000 $0 $2, 100 $2, 700 $3, 000 $3, 000 $30, 000 $3, 000 $3, 000 $3, 000 $36, 000 Manufacturer Co. Pay Program Plan Sponsor Total Accumulator Scenario Payer Costs Jan 18 Feb 18 Mar 18 Apr 18 May 18 Jun 18 Jul 18 Aug 18 Sep 18 Oct 18 Nov 18 Dec 18 2018 Patient OOP (actual) $0 $0 $0 $3, 000 $900 $300 $0 $0 $6, 000 $3, 000 $3, 000 $0 $0 $0 $15, 000 $0 $0 $0 $2, 100 $2, 700 $3, 000 $15, 000 $3, 000 $3, 000 $3, 000 $36, 000 Manufacturer Co. Pay Program Plan Sponsor Total Source: Drug Channels, Copay Accumulators: Costly Consequences of a New Cost-Shifting Pharmacy Benefit. January 2018
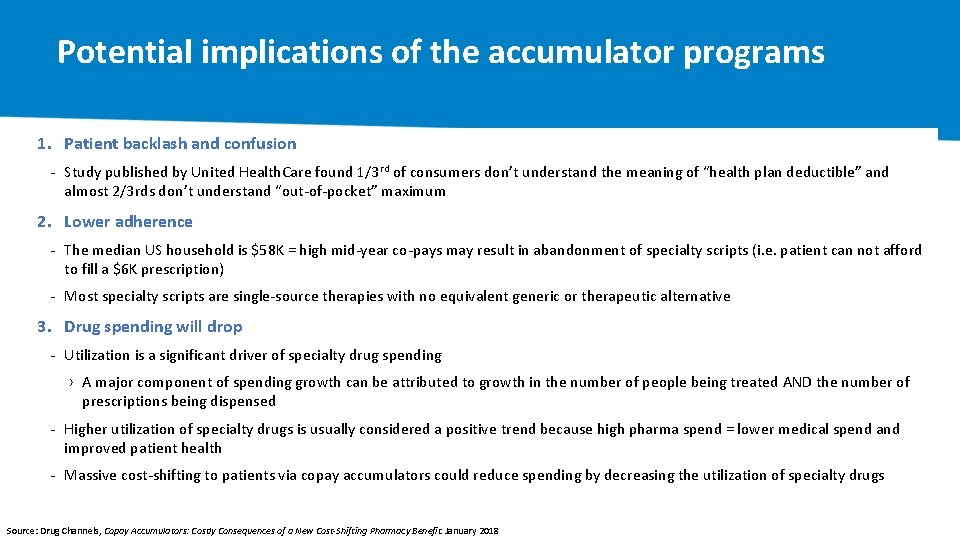
Potential implications of the accumulator programs 1. Patient backlash and confusion - Study published by United Health. Care found 1/3 rd of consumers don’t understand the meaning of “health plan deductible” and almost 2/3 rds don’t understand “out of pocket” maximum 2. Lower adherence - The median US household is $58 K = high mid year co pays may result in abandonment of specialty scripts (i. e. patient can not afford to fill a $6 K prescription) - Most specialty scripts are single source therapies with no equivalent generic or therapeutic alternative 3. Drug spending will drop - Utilization is a significant driver of specialty drug spending › A major component of spending growth can be attributed to growth in the number of people being treated AND the number of prescriptions being dispensed - Higher utilization of specialty drugs is usually considered a positive trend because high pharma spend = lower medical spend and improved patient health - Massive cost shifting to patients via copay accumulators could reduce spending by decreasing the utilization of specialty drugs Source: Drug Channels, Copay Accumulators: Costly Consequences of a New Cost-Shifting Pharmacy Benefit. January 2018
Is Amazon a potential retail contender?
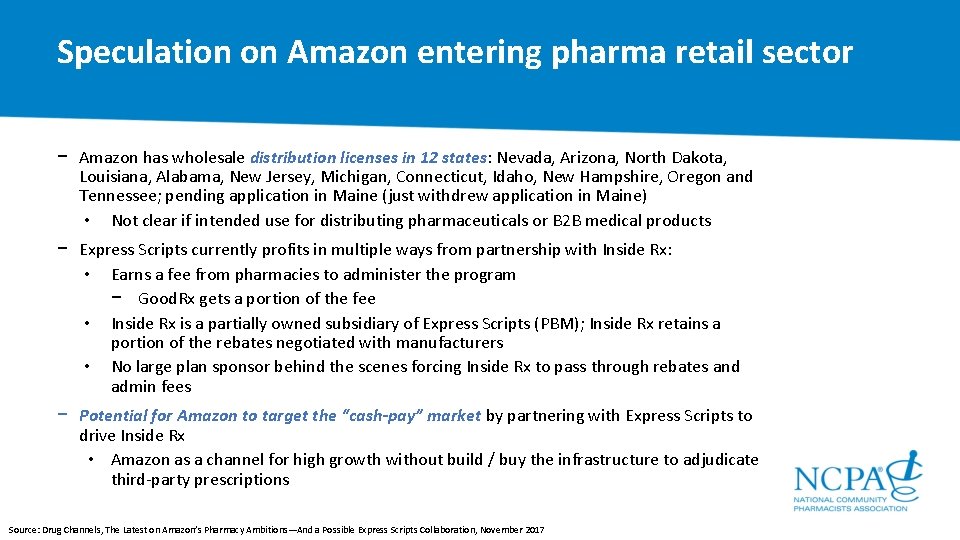
Speculation on Amazon entering pharma retail sector − Amazon has wholesale distribution licenses in 12 states: Nevada, Arizona, North Dakota, Louisiana, Alabama, New Jersey, Michigan, Connecticut, Idaho, New Hampshire, Oregon and Tennessee; pending application in Maine (just withdrew application in Maine) • Not clear if intended use for distributing pharmaceuticals or B 2 B medical products − Express Scripts currently profits in multiple ways from partnership with Inside Rx: • Earns a fee from pharmacies to administer the program − Good. Rx gets a portion of the fee • Inside Rx is a partially owned subsidiary of Express Scripts (PBM); Inside Rx retains a portion of the rebates negotiated with manufacturers • No large plan sponsor behind the scenes forcing Inside Rx to pass through rebates and admin fees − Potential for Amazon to target the “cash-pay” market by partnering with Express Scripts to drive Inside Rx • Amazon as a channel for high growth without build / buy the infrastructure to adjudicate third party prescriptions Source: Drug Channels, The Latest on Amazon’s Pharmacy Ambitions—And a Possible Express Scripts Collaboration, November 2017
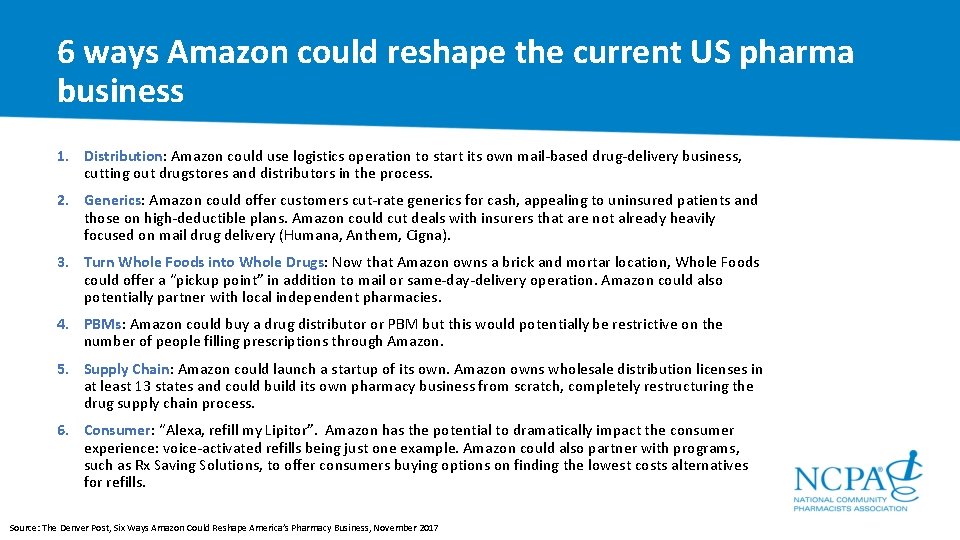
6 ways Amazon could reshape the current US pharma business 1. Distribution: Amazon could use logistics operation to start its own mail based drug delivery business, cutting out drugstores and distributors in the process. 2. Generics: Amazon could offer customers cut rate generics for cash, appealing to uninsured patients and those on high deductible plans. Amazon could cut deals with insurers that are not already heavily focused on mail drug delivery (Humana, Anthem, Cigna). 3. Turn Whole Foods into Whole Drugs: Now that Amazon owns a brick and mortar location, Whole Foods could offer a “pickup point” in addition to mail or same day delivery operation. Amazon could also potentially partner with local independent pharmacies. 4. PBMs: Amazon could buy a drug distributor or PBM but this would potentially be restrictive on the number of people filling prescriptions through Amazon. 5. Supply Chain: Amazon could launch a startup of its own. Amazon owns wholesale distribution licenses in at least 13 states and could build its own pharmacy business from scratch, completely restructuring the drug supply chain process. 6. Consumer: “Alexa, refill my Lipitor”. Amazon has the potential to dramatically impact the consumer experience: voice activated refills being just one example. Amazon could also partner with programs, such as Rx Saving Solutions, to offer consumers buying options on finding the lowest costs alternatives for refills. Source: The Denver Post, Six Ways Amazon Could Reshape America’s Pharmacy Business, November 2017
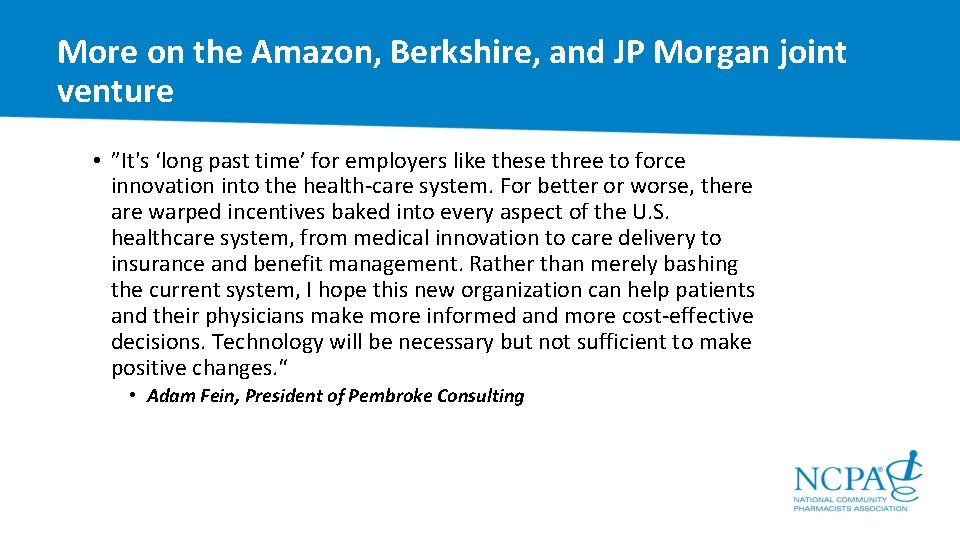
More on the Amazon, Berkshire, and JP Morgan joint venture • ”It's ‘long past time’ for employers like these three to force innovation into the health care system. For better or worse, there are warped incentives baked into every aspect of the U. S. healthcare system, from medical innovation to care delivery to insurance and benefit management. Rather than merely bashing the current system, I hope this new organization can help patients and their physicians make more informed and more cost effective decisions. Technology will be necessary but not sufficient to make positive changes. “ • Adam Fein, President of Pembroke Consulting
A Year in Review Market Performance 01 Market Access, Deductibles, & Reimbursement 02 Hot Topic 1: “Cash Business” 03 Hot Topic 2: Adherence 04 Hot Topic 3: Opioids 05 A Look Forward to 2018 & Recap 06
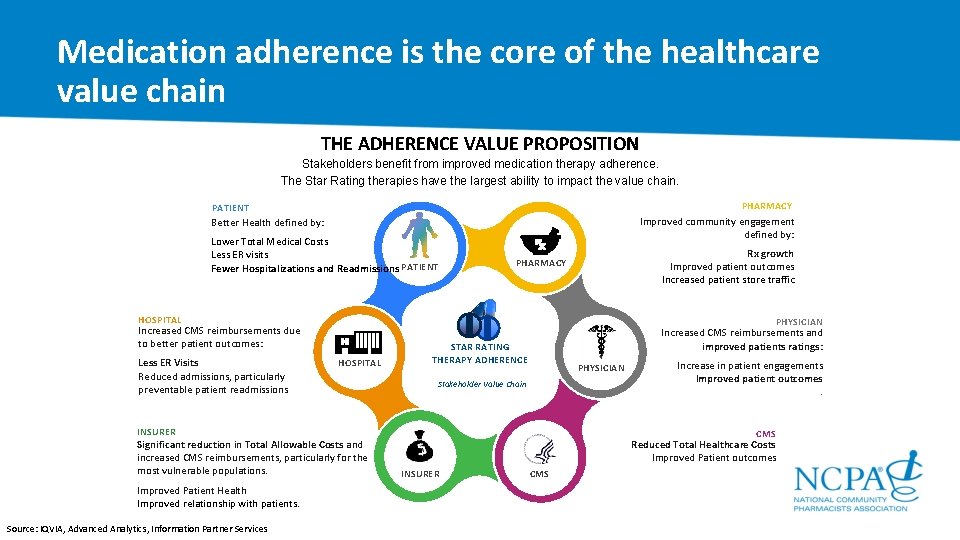
Medication adherence is the core of the healthcare value chain THE ADHERENCE VALUE PROPOSITION Stakeholders benefit from improved medication therapy adherence. The Star Rating therapies have the largest ability to impact the value chain. PHARMACY Improved community engagement defined by: PATIENT Better Health defined by: Lower Total Medical Costs Less ER visits Fewer Hospitalizations and Readmissions PATIENT HOSPITAL Increased CMS reimbursements due to better patient outcomes: Less ER Visits Reduced admissions, particularly preventable patient readmissions HOSPITAL INSURER Significant reduction in Total Allowable Costs and increased CMS reimbursements, particularly for the most vulnerable populations. Improved Patient Health Improved relationship with patients. Source: IQVIA, Advanced Analytics, Information Partner Services Rx growth Improved patient outcomes Increased patient store traffic PHARMACY PHYSICIAN Increased CMS reimbursements and improved patients ratings: STAR RATING THERAPY ADHERENCE PHYSICIAN Stakeholder Value Chain Increase in patient engagements Improved patient outcomes. CMS Reduced Total Healthcare Costs Improved Patient outcomes INSURER CMS
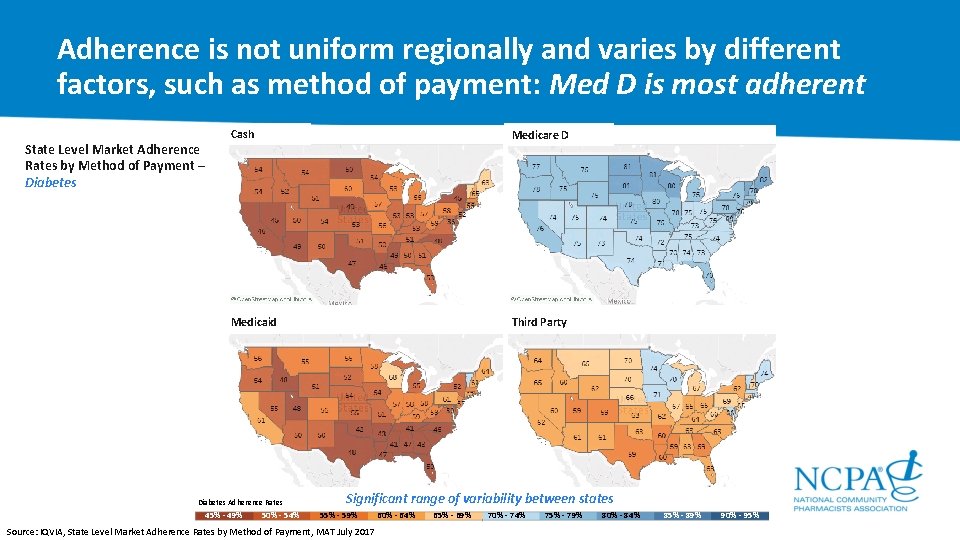
Adherence is not uniform regionally and varies by different factors, such as method of payment: Med D is most adherent State Level Market Adherence Rates by Method of Payment – Diabetes Cash Medicare D Medicaid Third Party Diabetes Adherence Rates 45% 49% 50% 54% Significant range of variability between states 55% 59% Source: IQVIA, State Level Market Adherence Rates by Method of Payment, MAT July 2017 60% 64% 65% 69% 70% 74% 75% 79% 80% 84% 85% 89% 90% 95%
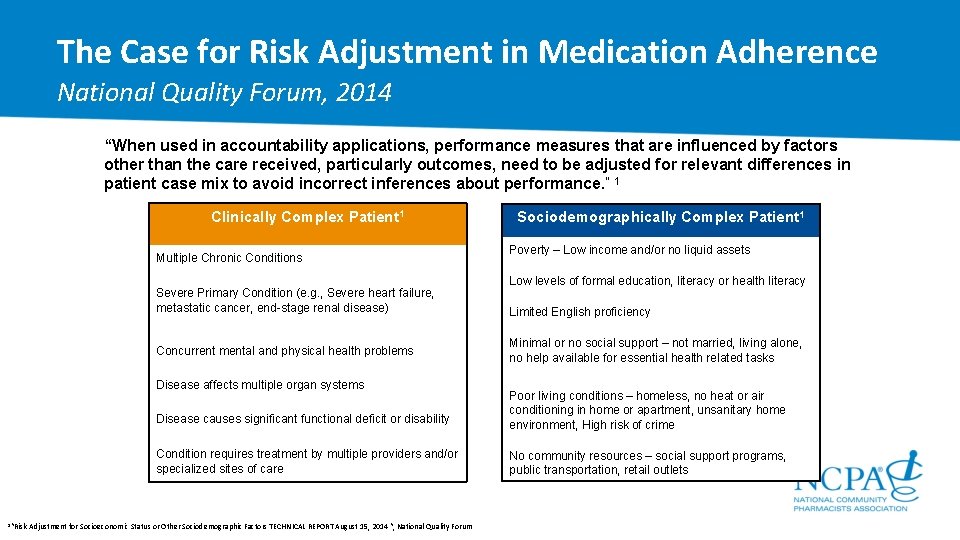
The Case for Risk Adjustment in Medication Adherence National Quality Forum, 2014 “When used in accountability applications, performance measures that are influenced by factors other than the care received, particularly outcomes, need to be adjusted for relevant differences in patient case mix to avoid incorrect inferences about performance. “ 1 Clinically Complex Patient 1 Multiple Chronic Conditions Severe Primary Condition (e. g. , Severe heart failure, metastatic cancer, end-stage renal disease) Concurrent mental and physical health problems Disease affects multiple organ systems 1“Risk Sociodemographically Complex Patient 1 Poverty – Low income and/or no liquid assets Low levels of formal education, literacy or health literacy Limited English proficiency Minimal or no social support – not married, living alone, no help available for essential health related tasks Disease causes significant functional deficit or disability Poor living conditions – homeless, no heat or air conditioning in home or apartment, unsanitary home environment, High risk of crime Condition requires treatment by multiple providers and/or specialized sites of care No community resources – social support programs, public transportation, retail outlets Adjustment for Socioeconomic Status or Other Sociodemographic Factors TECHNICAL REPORT August 15, 2014 “, National Quality Forum
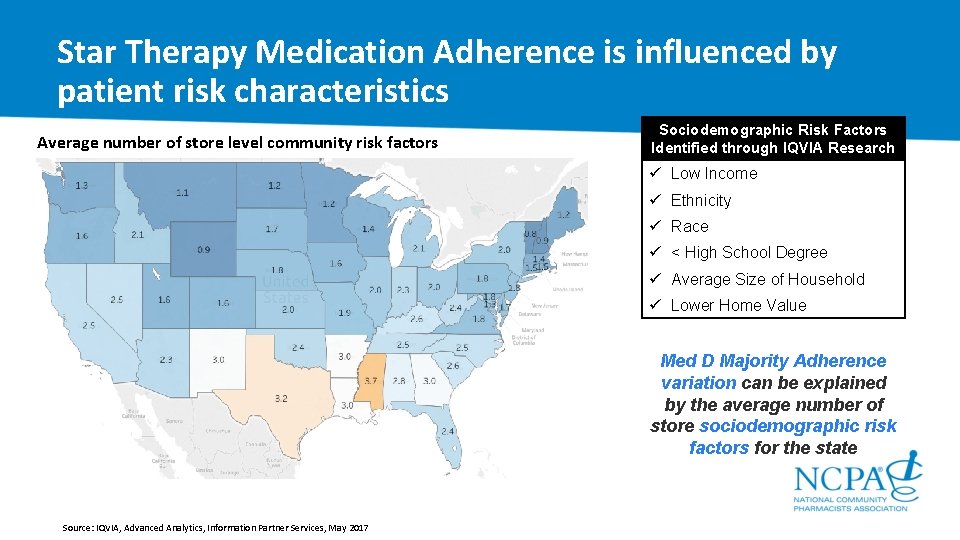
Star Therapy Medication Adherence is influenced by patient risk characteristics Average number of store level community risk factors Sociodemographic Risk Factors Identified through IQVIA Research ü Low Income ü Ethnicity ü Race ü < High School Degree ü Average Size of Household ü Lower Home Value Med D Majority Adherence variation can be explained by the average number of store sociodemographic risk factors for the state Source: IQVIA, Advanced Analytics, Information Partner Services, May 2017
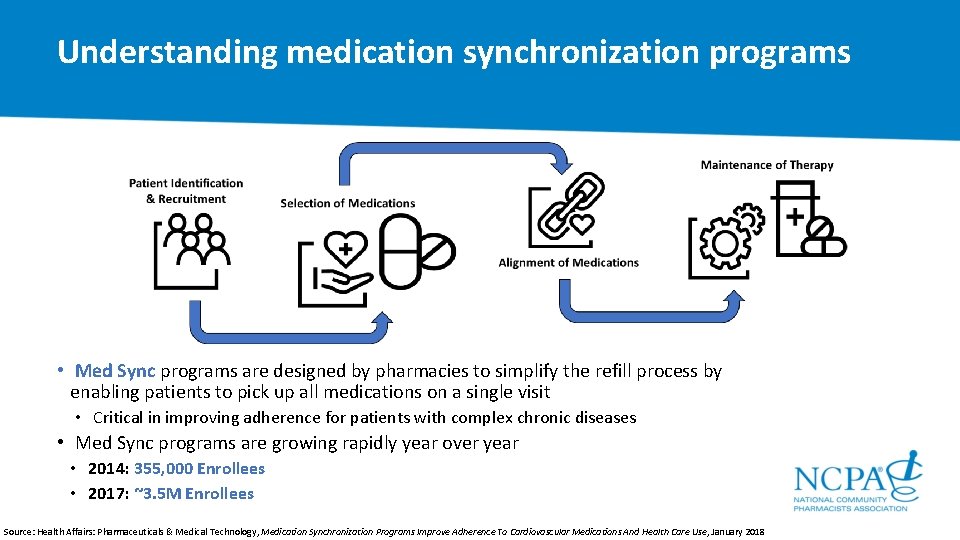
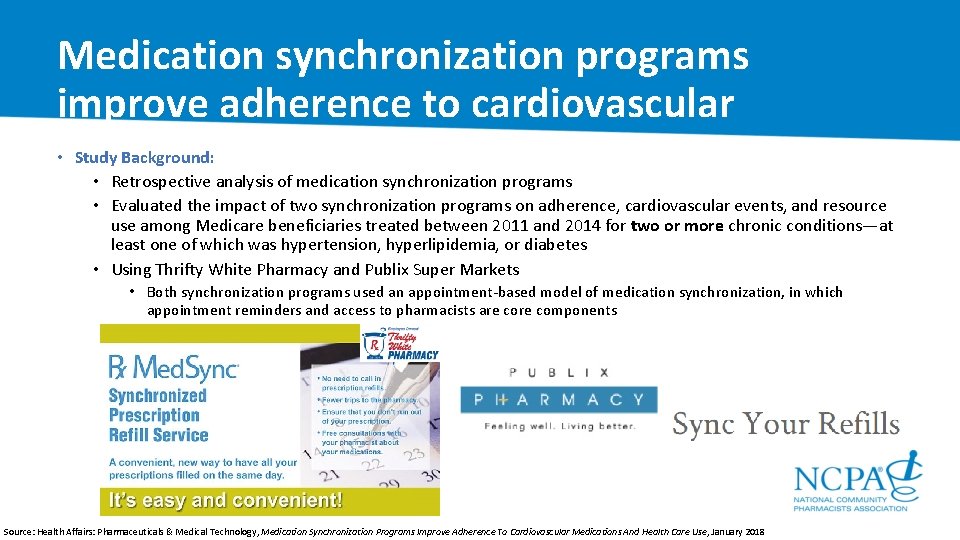
Understanding medication synchronization programs • Med Sync programs are designed by pharmacies to simplify the refill process by enabling patients to pick up all medications on a single visit • Critical in improving adherence for patients with complex chronic diseases • Med Sync programs are growing rapidly year over year • 2014: 355, 000 Enrollees • 2017: ~3. 5 M Enrollees Source: Health Affairs: Pharmaceuticals & Medical Technology, Medication Synchronization Programs Improve Adherence To Cardiovascular Medications And Health Care Use, January 2018
Medication synchronization programs improve adherence to cardiovascular • medications Study Background: and health care use • Retrospective analysis of medication synchronization programs • Evaluated the impact of two synchronization programs on adherence, cardiovascular events, and resource use among Medicare beneficiaries treated between 2011 and 2014 for two or more chronic conditions—at least one of which was hypertension, hyperlipidemia, or diabetes • Using Thrifty White Pharmacy and Publix Super Markets • Both synchronization programs used an appointment based model of medication synchronization, in which appointment reminders and access to pharmacists are components Source: Health Affairs: Pharmaceuticals & Medical Technology, Medication Synchronization Programs Improve Adherence To Cardiovascular Medications And Health Care Use, January 2018
Medication synchronization programs improve adherence to cardiovascular medications and health care use • Adherence improvement in synchronized versus control patients was three times greater in patients with low baseline adherence compared to those with higher baseline adherence • Synchronization programs were associated with improved adherence for patients with cardiovascular disease, especially those with low baseline adherence - Rates of hospitalization and emergency department visits and rates of outpatient visits were 9 percent and 3 percent lower in the synchronized group compared to the control group › Cardiovascular event rates were similar Source: Health Affairs: Pharmaceuticals & Medical Technology, Medication Synchronization Programs Improve Adherence To Cardiovascular Medications And Health Care Use, January 2018
Taking diabetes medications as prescribed, exercising frequently and managing weight linked to better blood sugar control Kaiser Permanente, June 2017 − The National Health and Nutrition Examination Survey estimates 21% of adults with diabetes have poorly controlled blood sugar • African Americans and other racial / ethnic minorities are more likely than non Hispanic whites to have poorly controlled blood sugar − According to study published by the American Journal of Pharmacy Benefits, people with diabetes who… 1. Are 80% adherent with their medication − Patients who took oral diabetes at least 80% of the time were 46% less likely to have poorly controlled blood sugar − “If patients are refilling medications when they’re supposed to, they’re also likely taking them when they’re supposed to, ” David Mosen, Ph. D & Investigator at the Kaiser Permanente Center for Health Research 2. Exercised ≥ 4 times per week were …at lower risk for poorly controlled blood sugar. The study also found clinically obese patients are at higher risk for poorly controlled blood sugar
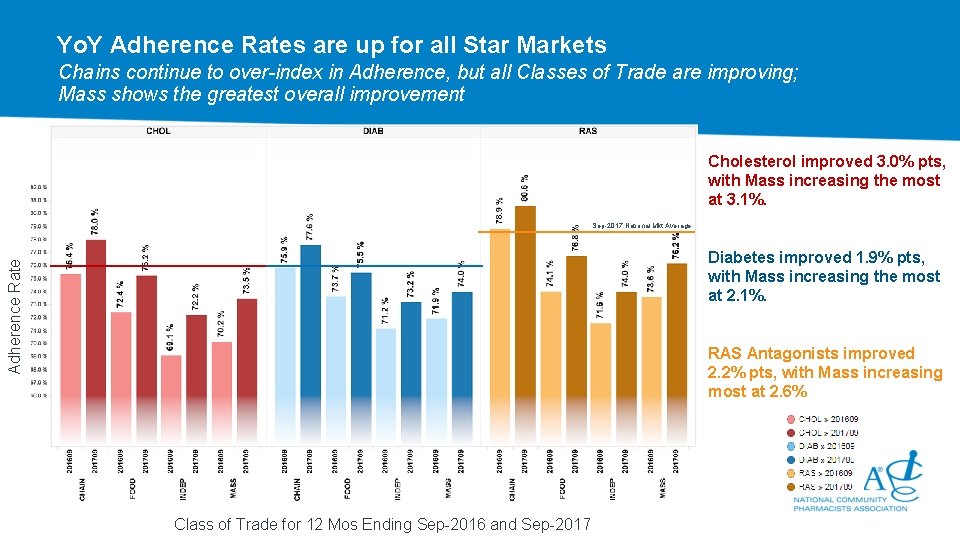
Yo. Y Adherence Rates are up for all Star Markets Chains continue to over-index in Adherence, but all Classes of Trade are improving; Mass shows the greatest overall improvement Cholesterol improved 3. 0% pts, with Mass increasing the most at 3. 1%. Sep-2017 National Mkt Average Adherence Rate Diabetes improved 1. 9% pts, with Mass increasing the most at 2. 1%. RAS Antagonists improved 2. 2% pts, with Mass increasing most at 2. 6% Class of Trade for 12 Mos Ending Sep-2016 and Sep-2017
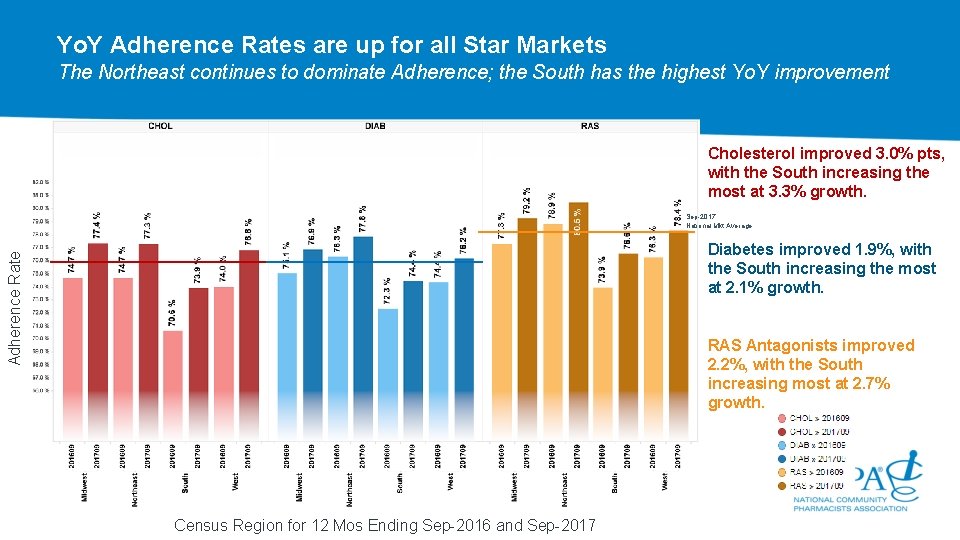
Yo. Y Adherence Rates are up for all Star Markets The Northeast continues to dominate Adherence; the South has the highest Yo. Y improvement Cholesterol improved 3. 0% pts, with the South increasing the most at 3. 3% growth. Sep-2017 National Mkt Average Adherence Rate Diabetes improved 1. 9%, with the South increasing the most at 2. 1% growth. RAS Antagonists improved 2. 2%, with the South increasing most at 2. 7% growth. Census Region for 12 Mos Ending Sep-2016 and Sep-2017
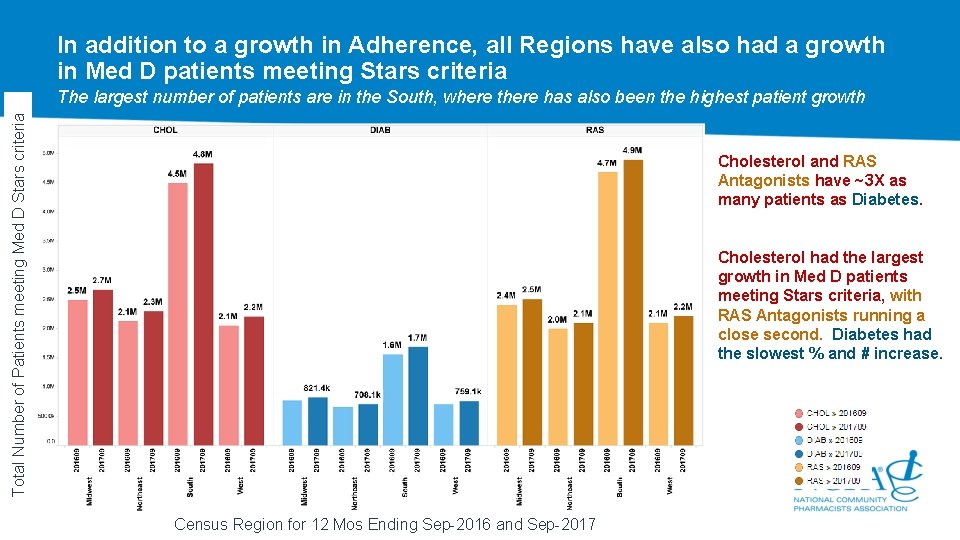
In addition to a growth in Adherence, all Regions have also had a growth in Med D patients meeting Stars criteria Total Number of Patients meeting Med D Stars criteria The largest number of patients are in the South, where there has also been the highest patient growth Cholesterol and RAS Antagonists have ~3 X as many patients as Diabetes. Cholesterol had the largest growth in Med D patients meeting Stars criteria, with RAS Antagonists running a close second. Diabetes had the slowest % and # increase. Census Region for 12 Mos Ending Sep-2016 and Sep-2017
A Year in Review Market Performance 01 Market Access, Deductibles, & Reimbursement 02 Hot Topic 1: “Cash Business” 03 Hot Topic 2: Adherence 04 Hot Topic 3: Opioids 05 A Look Forward to 2018 & Recap 06
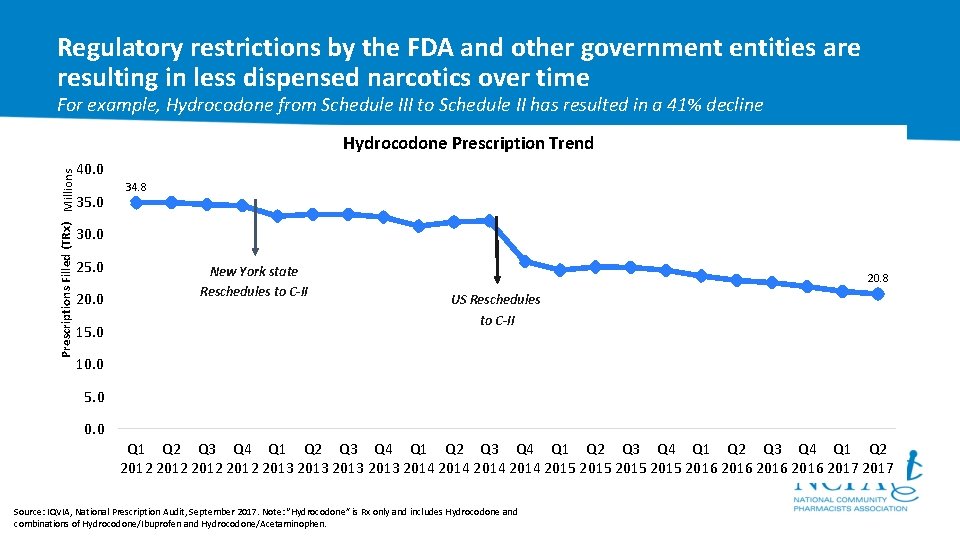
Regulatory restrictions by the FDA and other government entities are resulting in less dispensed narcotics over time For example, Hydrocodone from Schedule III to Schedule II has resulted in a 41% decline Prescriptions Filled (TRx) Millions Hydrocodone Prescription Trend 40. 0 35. 0 34. 8 30. 0 25. 0 20. 0 15. 0 New York state Reschedules to C-II 20. 8 US Reschedules to C-II 10. 0 5. 0 0. 0 Q 1 Q 2 Q 3 Q 4 Q 1 Q 2 Q 3 Q 4 Q 1 Q 2 2012 2013 2014 2015 2016 2017 Source: IQVIA, National Prescription Audit, September 2017. Note: “Hydrocodone” is Rx only and includes Hydrocodone and combinations of Hydrocodone/Ibuprofen and Hydrocodone/Acetaminophen.
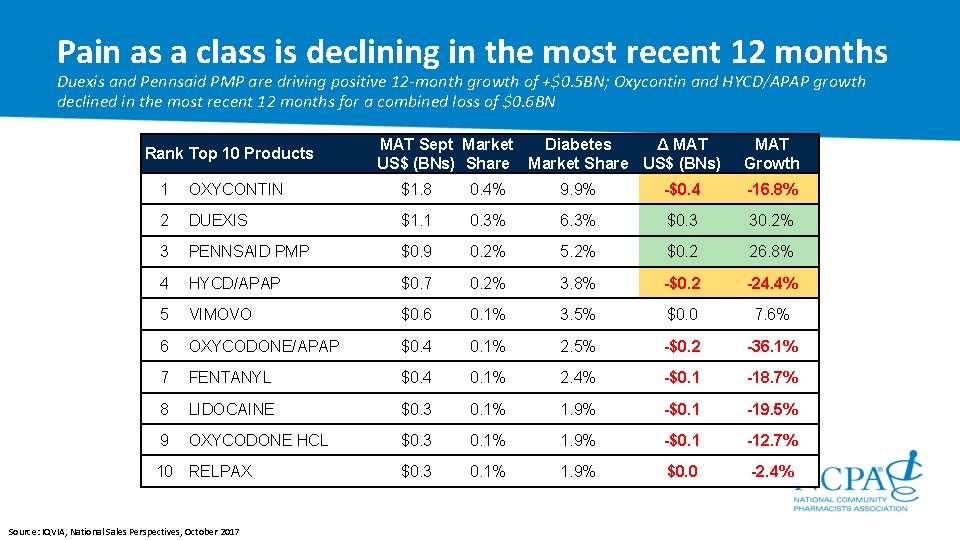
Pain as a class is declining in the most recent 12 months Duexis and Pennsaid PMP are driving positive 12 -month growth of +$0. 5 BN; Oxycontin and HYCD/APAP growth declined in the most recent 12 months for a combined loss of $0. 6 BN Rank Top 10 Products MAT Sept Market Diabetes Δ MAT US$ (BNs) Share Market Share US$ (BNs) MAT Growth 1 OXYCONTIN $1. 8 0. 4% 9. 9% -$0. 4 -16. 8% 2 DUEXIS $1. 1 0. 3% 6. 3% $0. 3 30. 2% 3 PENNSAID PMP $0. 9 0. 2% 5. 2% $0. 2 26. 8% 4 HYCD/APAP $0. 7 0. 2% 3. 8% -$0. 2 -24. 4% 5 VIMOVO $0. 6 0. 1% 3. 5% $0. 0 7. 6% 6 OXYCODONE/APAP $0. 4 0. 1% 2. 5% -$0. 2 -36. 1% 7 FENTANYL $0. 4 0. 1% 2. 4% -$0. 1 -18. 7% 8 LIDOCAINE $0. 3 0. 1% 1. 9% -$0. 1 -19. 5% 9 OXYCODONE HCL $0. 3 0. 1% 1. 9% -$0. 1 -12. 7% $0. 3 0. 1% 1. 9% $0. 0 -2. 4% 10 RELPAX Source: IQVIA, National Sales Perspectives, October 2017
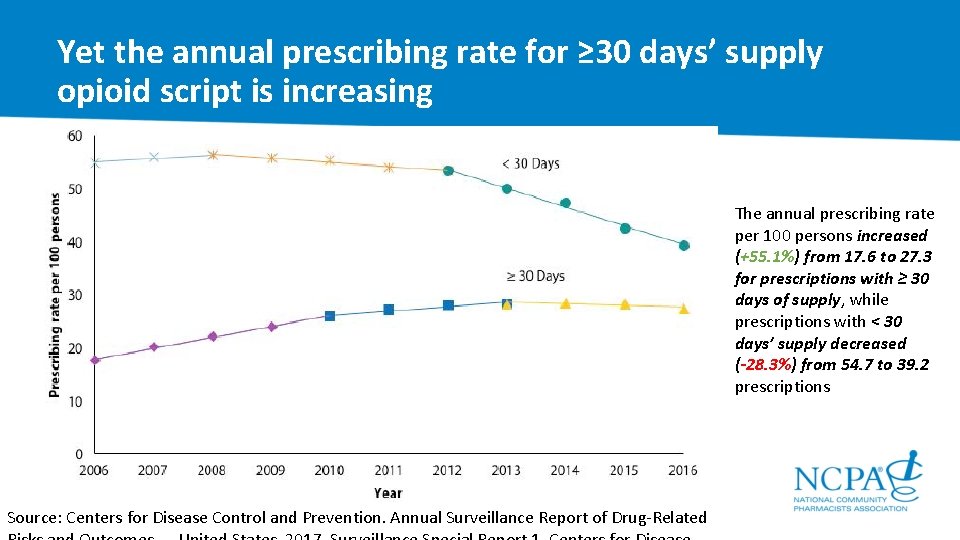
Yet the annual prescribing rate for ≥ 30 days’ supply opioid script is increasing The annual prescribing rate per 100 persons increased (+55. 1%) from 17. 6 to 27. 3 for prescriptions with ≥ 30 days of supply, while prescriptions with < 30 days’ supply decreased (-28. 3%) from 54. 7 to 39. 2 prescriptions Source: Centers for Disease Control and Prevention. Annual Surveillance Report of Drug Related
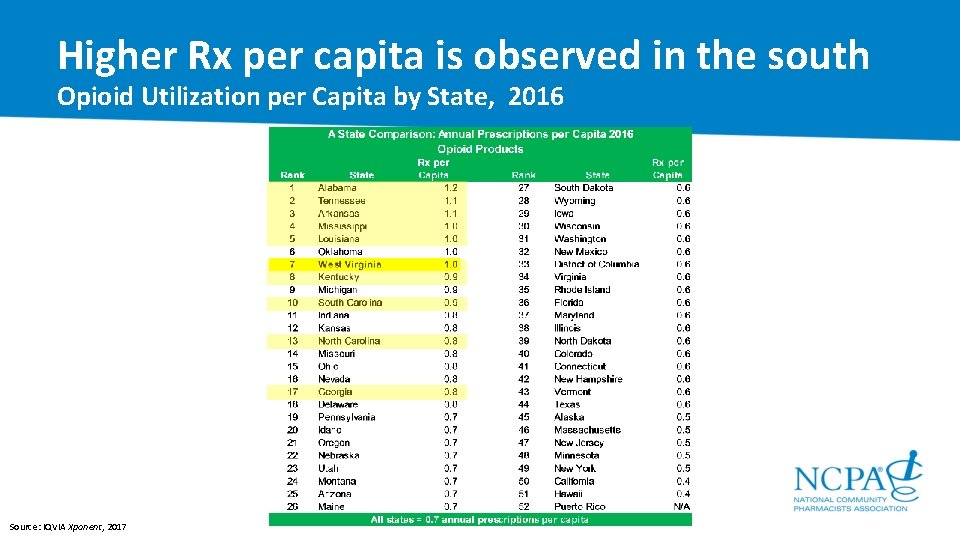
Higher Rx per capita is observed in the south Opioid Utilization per Capita by State, 2016 Source: IQVIA Xponent, 2017
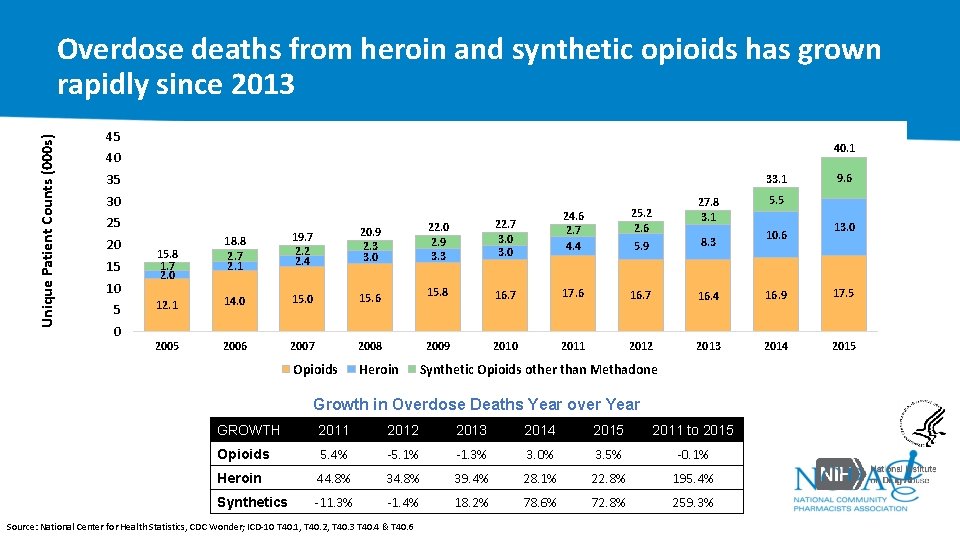
Unique Patient Counts (000 s) Overdose deaths from heroin and synthetic opioids has grown rapidly since 2013 45 40. 1 40 35 33. 1 30 25 20 15 10 5 0 18. 8 2. 7 2. 1 19. 7 2. 2 2. 4 20. 9 2. 3 3. 0 12. 1 14. 0 15. 6 2005 2006 2007 2008 Opioids Heroin 15. 8 1. 7 2. 0 27. 8 3. 1 5. 5 24. 6 2. 7 4. 4 25. 2 2. 6 5. 9 8. 3 16. 7 17. 6 16. 7 16. 4 16. 9 17. 5 2010 2011 2012 2013 2014 2015 22. 0 2. 9 3. 3 22. 7 3. 0 15. 8 2009 Synthetic Opioids other than Methadone Growth in Overdose Deaths Year over Year GROWTH 2011 2012 2013 2014 2015 2011 to 2015 Opioids 5. 4% -5. 1% -1. 3% 3. 0% 3. 5% -0. 1% Heroin 44. 8% 39. 4% 28. 1% 22. 8% 195. 4% Synthetics -11. 3% -1. 4% 18. 2% 78. 6% 72. 8% 259. 3% Source: National Center for Health Statistics, CDC Wonder; ICD 10 T 40. 1, T 40. 2, T 40. 3 T 40. 4 & T 40. 6 9. 6 10. 6 13. 0
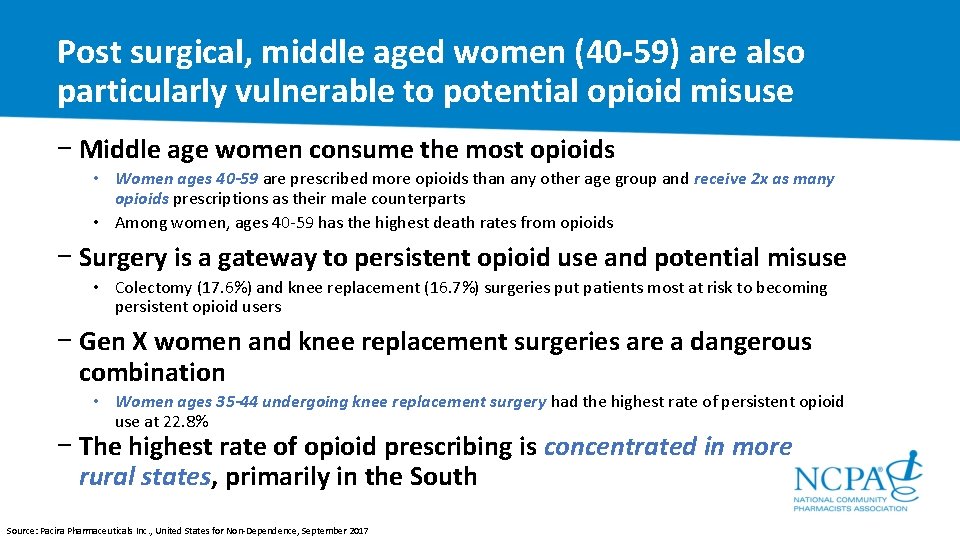
Post surgical, middle aged women (40 -59) are also particularly vulnerable to potential opioid misuse − Middle age women consume the most opioids • Women ages 40 -59 are prescribed more opioids than any other age group and receive 2 x as many opioids prescriptions as their male counterparts • Among women, ages 40 59 has the highest death rates from opioids − Surgery is a gateway to persistent opioid use and potential misuse • Colectomy (17. 6%) and knee replacement (16. 7%) surgeries put patients most at risk to becoming persistent opioid users − Gen X women and knee replacement surgeries are a dangerous combination • Women ages 35 -44 undergoing knee replacement surgery had the highest rate of persistent opioid use at 22. 8% − The highest rate of opioid prescribing is concentrated in more rural states, primarily in the South Source: Pacira Pharmaceuticals Inc. , United States for Non Dependence, September 2017
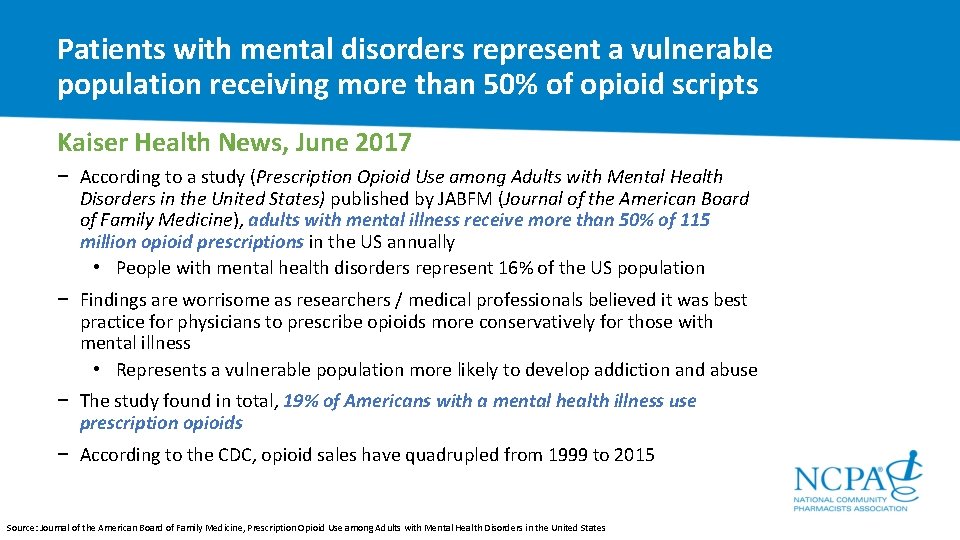
Patients with mental disorders represent a vulnerable population receiving more than 50% of opioid scripts Kaiser Health News, June 2017 − According to a study (Prescription Opioid Use among Adults with Mental Health Disorders in the United States) published by JABFM (Journal of the American Board of Family Medicine), adults with mental illness receive more than 50% of 115 million opioid prescriptions in the US annually • People with mental health disorders represent 16% of the US population − Findings are worrisome as researchers / medical professionals believed it was best practice for physicians to prescribe opioids more conservatively for those with mental illness • Represents a vulnerable population more likely to develop addiction and abuse − The study found in total, 19% of Americans with a mental health illness use prescription opioids − According to the CDC, opioid sales have quadrupled from 1999 to 2015 Source: Journal of the American Board of Family Medicine, Prescription Opioid Use among Adults with Mental Health Disorders in the United States
A Year in Review Market Performance 01 Market Access, Deductibles, & Reimbursement 02 Hot Topic 1: “Cash Business” 03 Hot Topic 2: Adherence 04 Hot Topic 3: Opioids 05 A Look Forward to 2018 & Recap 06
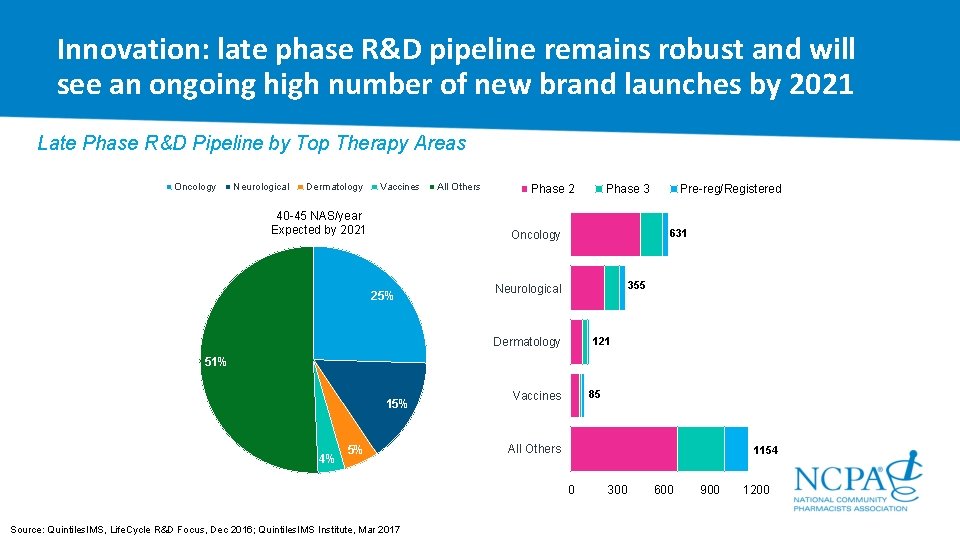
Innovation: late phase R&D pipeline remains robust and will see an ongoing high number of new brand launches by 2021 Late Phase R&D Pipeline by Top Therapy Areas Oncology Neurological Dermatology Vaccines 40 -45 NAS/year Expected by 2021 All Others Phase 2 Phase 3 631 Oncology 25% Pre-reg/Registered 355 Neurological 121 Dermatology 51% 15% 4% 5% 85 Vaccines All Others 1154 0 Source: Quintiles. IMS, Life. Cycle R&D Focus, Dec 2016; Quintiles. IMS Institute, Mar 2017 300 600 900 1200
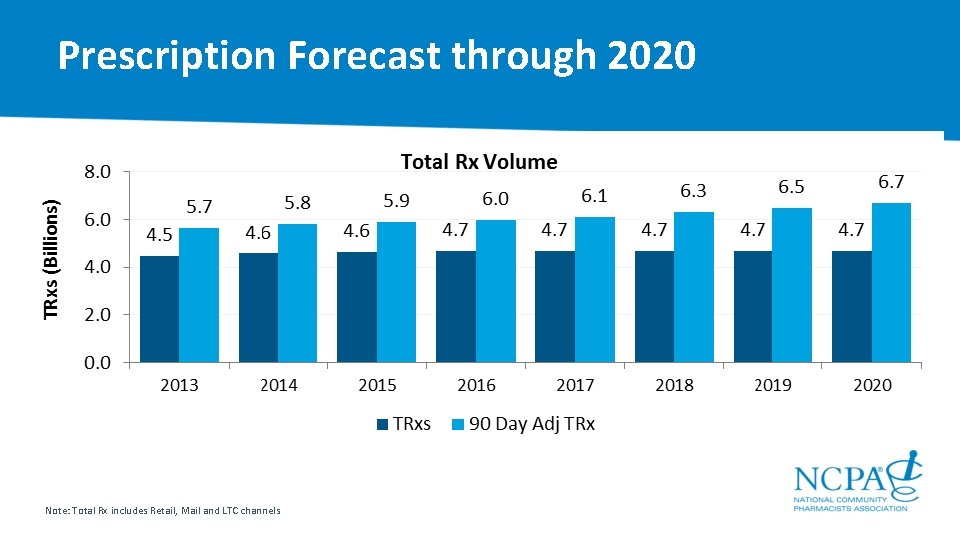
Prescription Forecast through 2020 • Total TRx demand (unadjusted) in 2017 was 4. 7 B prescriptions, up 0. 1% from 2016, yet when adjusted for 90 day Rxs, the adjusted TRx growth rate actually rebounded, growing by 2. 3% in 2017, to 6. 1 B TRxs Note: Total Rx includes Retail, Mail and LTC channels
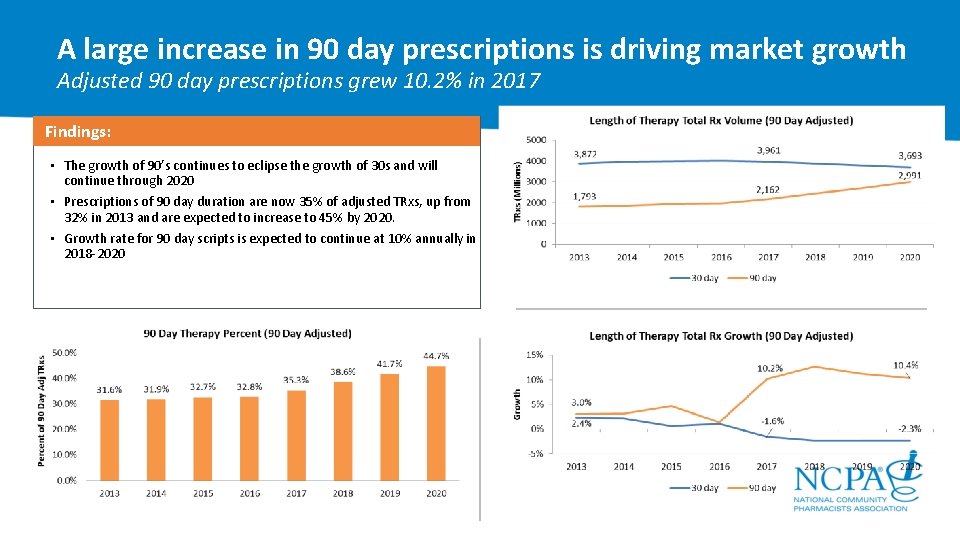
A large increase in 90 day prescriptions is driving market growth Adjusted 90 day prescriptions grew 10. 2% in 2017 Findings: • The growth of 90’s continues to eclipse the growth of 30 s and will continue through 2020 • Prescriptions of 90 day duration are now 35% of adjusted TRxs, up from 32% in 2013 and are expected to increase to 45% by 2020. • Growth rate for 90 day scripts is expected to continue at 10% annually in 2018 2020
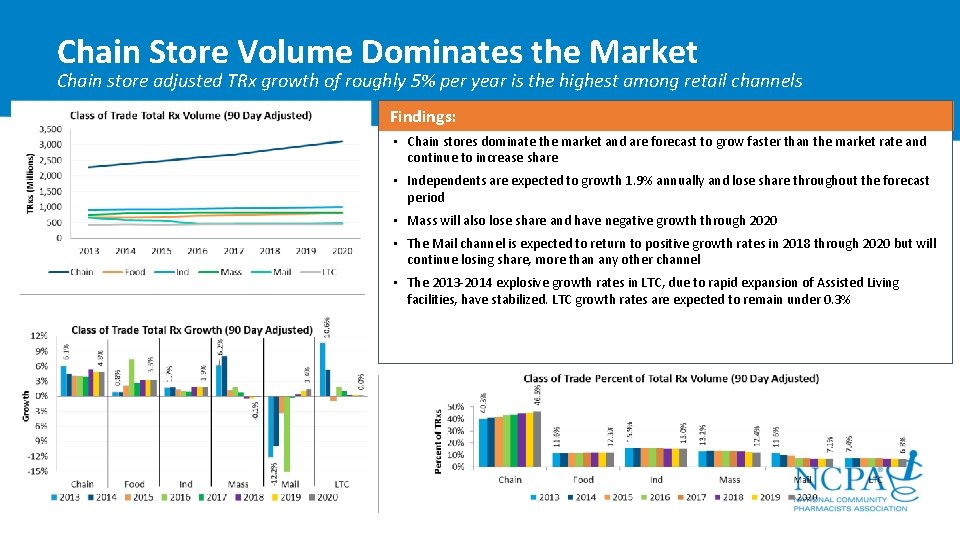
Chain Store Volume Dominates the Market Chain store adjusted TRx growth of roughly 5% per year is the highest among retail channels Findings: • Chain stores dominate the market and are forecast to grow faster than the market rate and continue to increase share • Independents are expected to growth 1. 9% annually and lose share throughout the forecast period • Mass will also lose share and have negative growth through 2020 • The Mail channel is expected to return to positive growth rates in 2018 through 2020 but will continue losing share, more than any other channel • The 2013 2014 explosive growth rates in LTC, due to rapid expansion of Assisted Living facilities, have stabilized. LTC growth rates are expected to remain under 0. 3%
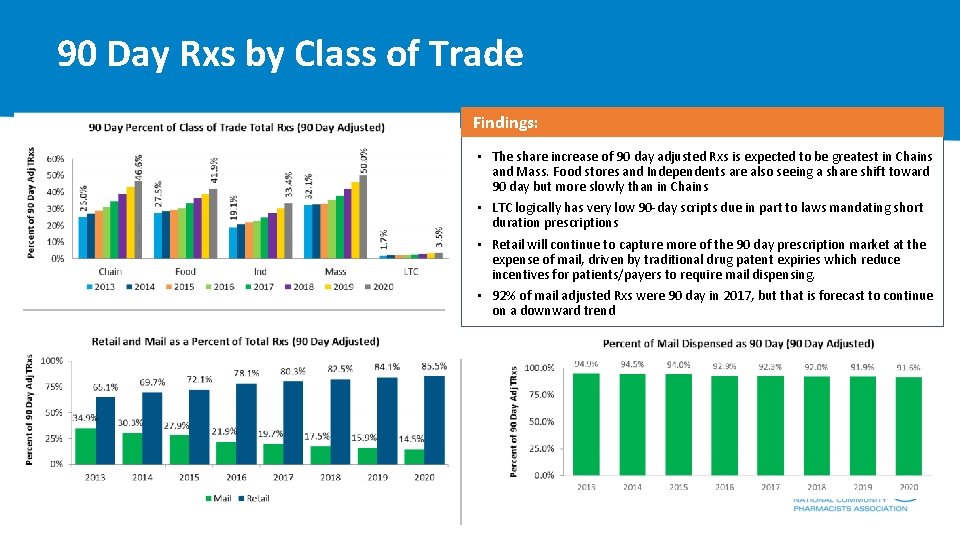
90 Day Rxs by Class of Trade Findings: share increase of 90 day adjusted Rxs is expected to be greatest in Chains • 90 Day TRx share is growing rapidly • in. The all retail classes, most and Mass. Food stores and Independents are also seeing a share shift toward 90 day but more slowly than in Chains especially in chains • LTC logically has very low 90 day scripts due in part to laws mandating short duration prescriptions • Retail will continue to capture more of the 90 day prescription market at the expense of mail, driven by traditional drug patent expiries which reduce incentives for patients/payers to require mail dispensing. • 92% of mail adjusted Rxs were 90 day in 2017, but that is forecast to continue on a downward trend
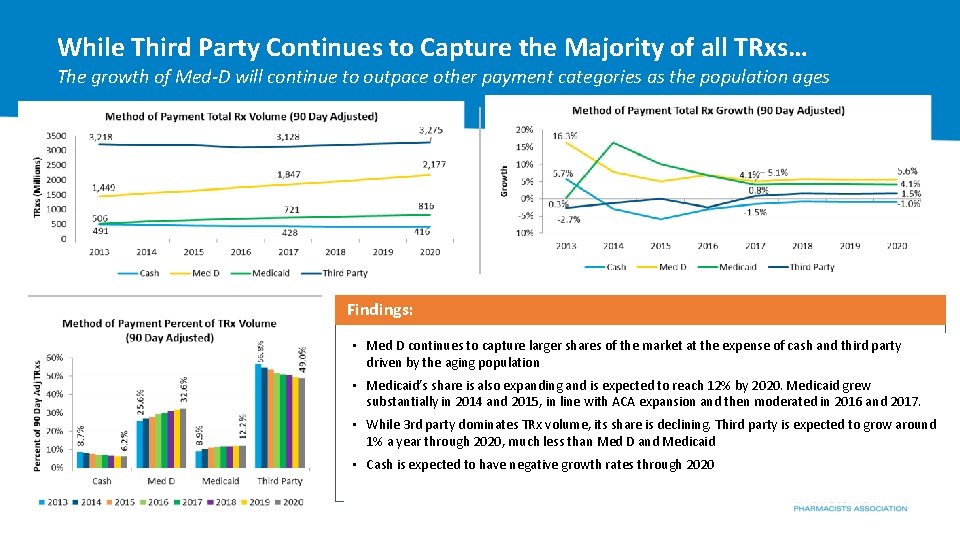
While Third Party Continues to Capture the Majority of all TRxs… The growth of Med-D will continue to outpace other payment categories as the population ages Findings: • Med D continues to capture larger shares of the market at the expense of cash and third party driven by the aging population • Medicaid’s share is also expanding and is expected to reach 12% by 2020. Medicaid grew substantially in 2014 and 2015, in line with ACA expansion and then moderated in 2016 and 2017. • While 3 rd party dominates TRx volume, its share is declining. Third party is expected to grow around 1% a year through 2020, much less than Med D and Medicaid • Cash is expected to have negative growth rates through 2020
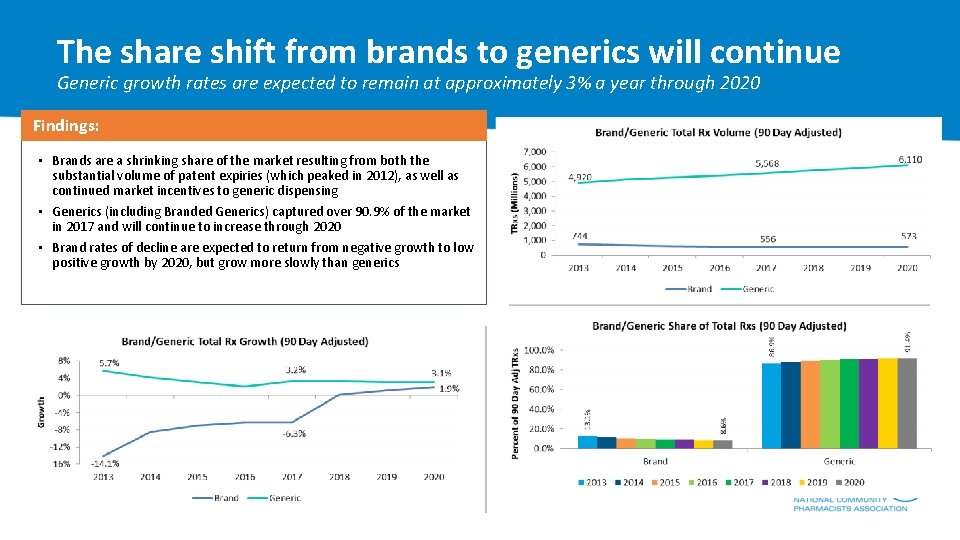
The share shift from brands to generics will continue Generic growth rates are expected to remain at approximately 3% a year through 2020 Findings: • Brands are a shrinking share of the market resulting from both the substantial volume of patent expiries (which peaked in 2012), as well as continued market incentives to generic dispensing • Generics (including Branded Generics) captured over 90. 9% of the market in 2017 and will continue to increase through 2020 • Brand rates of decline are expected to return from negative growth to low positive growth by 2020, but grow more slowly than generics
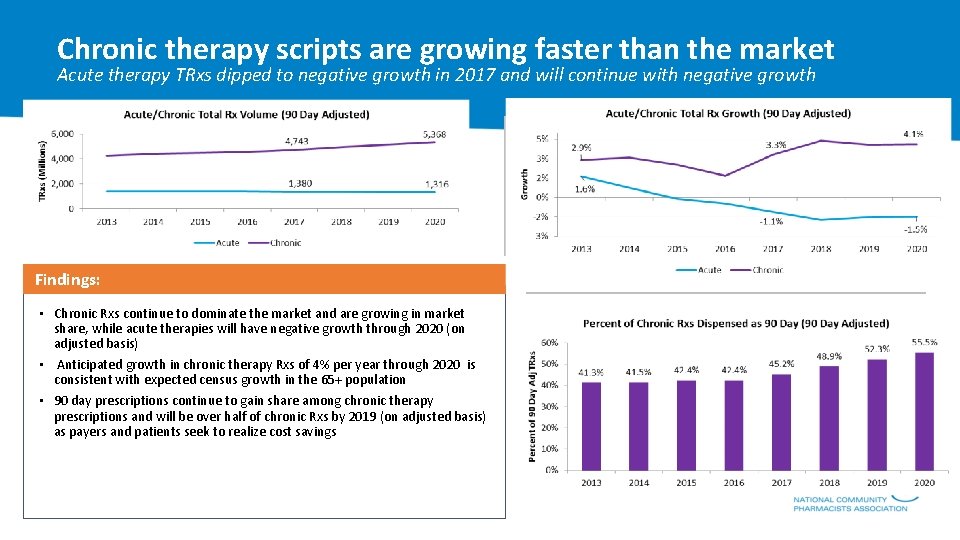
Chronic therapy scripts are growing faster than the market Acute therapy TRxs dipped to negative growth in 2017 and will continue with negative growth %Findings: • Chronic Rxs continue to dominate the market and are growing in market share, while acute therapies will have negative growth through 2020 (on adjusted basis) • Anticipated growth in chronic therapy Rxs of 4% per year through 2020 is consistent with expected census growth in the 65+ population • 90 day prescriptions continue to gain share among chronic therapy prescriptions and will be over half of chronic Rxs by 2019 (on adjusted basis) as payers and patients seek to realize cost savings
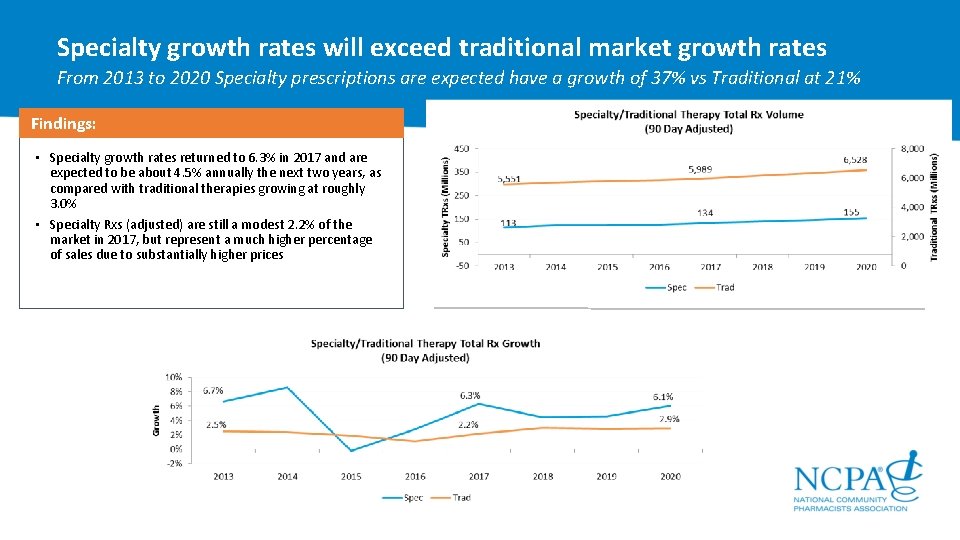
Specialty growth rates will exceed traditional market growth rates From 2013 to 2020 Specialty prescriptions are expected have a growth of 37% vs Traditional at 21% Findings: • Specialty growth rates returned to 6. 3% in 2017 and are expected to be about 4. 5% annually the next two years, as compared with traditional therapies growing at roughly 3. 0% • Specialty Rxs (adjusted) are still a modest 2. 2% of the market in 2017, but represent a much higher percentage of sales due to substantially higher prices
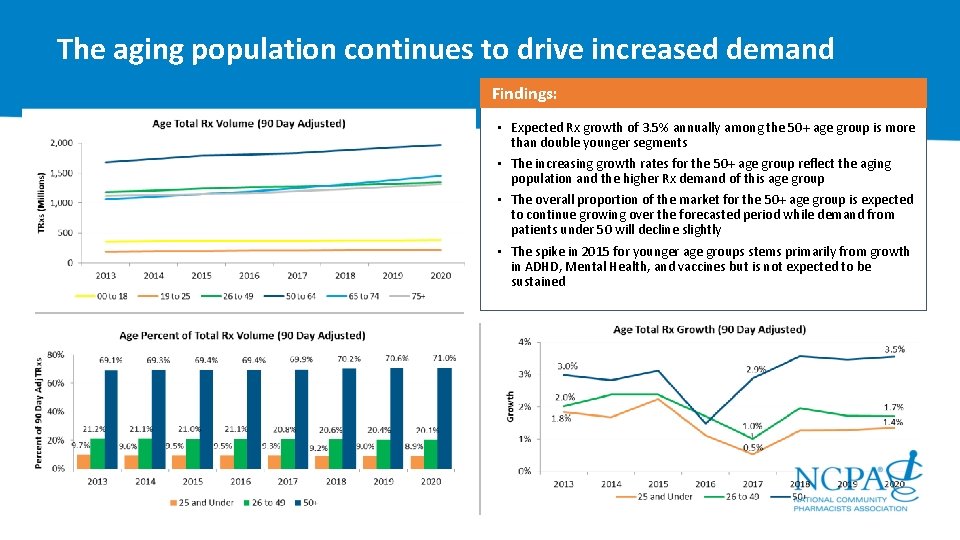
The aging population continues to drive increased demand Findings: • Expected Rx growth of 3. 5% annually among the 50+ age group is more than double younger segments • The increasing growth rates for the 50+ age group reflect the aging population and the higher Rx demand of this age group • The overall proportion of the market for the 50+ age group is expected to continue growing over the forecasted period while demand from patients under 50 will decline slightly • The spike in 2015 for younger age groups stems primarily from growth in ADHD, Mental Health, and vaccines but is not expected to be sustained
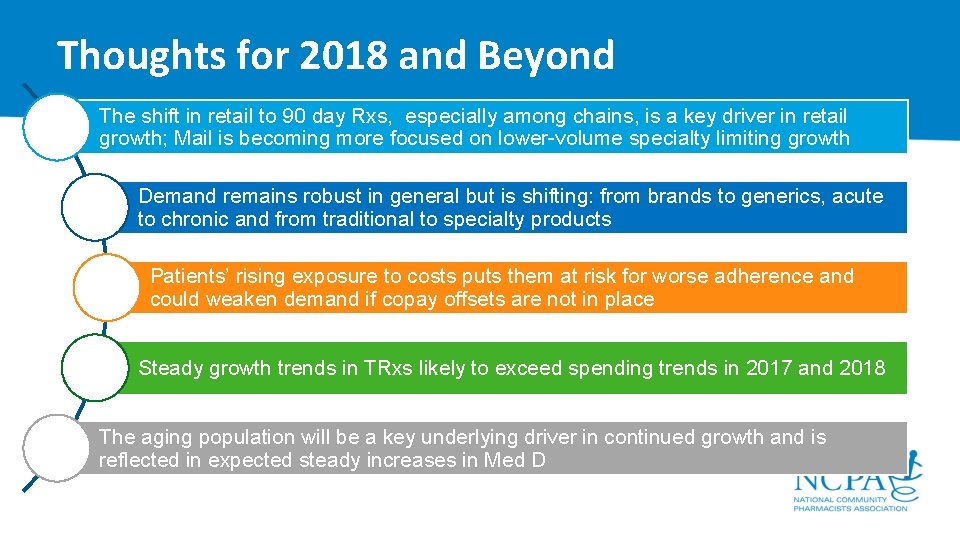
Thoughts for 2018 and Beyond The shift in retail to 90 day Rxs, especially among chains, is a key driver in retail growth; Mail is becoming more focused on lower-volume specialty limiting growth Demand remains robust in general but is shifting: from brands to generics, acute to chronic and from traditional to specialty products Patients’ rising exposure to costs puts them at risk for worse adherence and could weaken demand if copay offsets are not in place Steady growth trends in TRxs likely to exceed spending trends in 2017 and 2018 The aging population will be a key underlying driver in continued growth and is reflected in expected steady increases in Med D
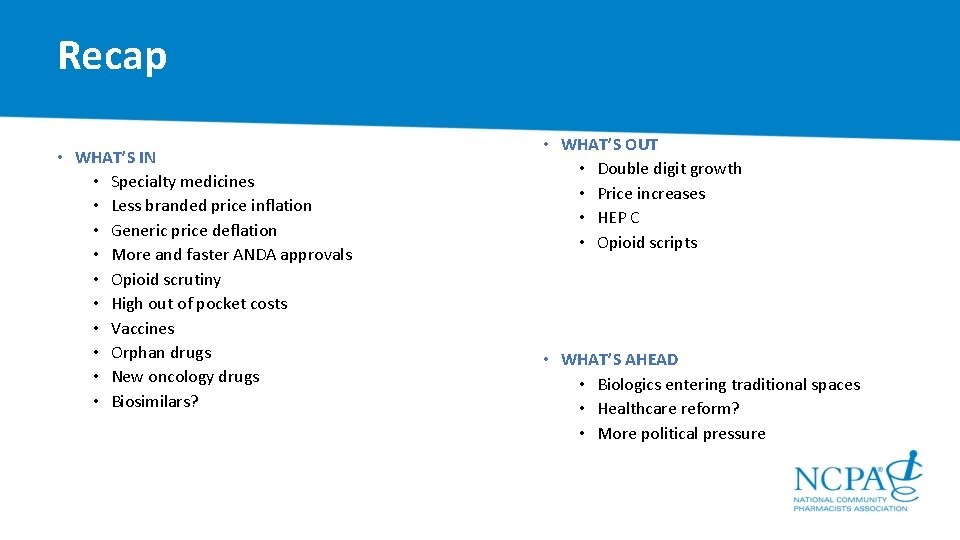
Recap • WHAT’S IN • Specialty medicines • Less branded price inflation • Generic price deflation • More and faster ANDA approvals • Opioid scrutiny • High out of pocket costs • Vaccines • Orphan drugs • New oncology drugs • Biosimilars? • WHAT’S OUT • Double digit growth • Price increases • HEP C • Opioid scripts • WHAT’S AHEAD • Biologics entering traditional spaces • Healthcare reform? • More political pressure
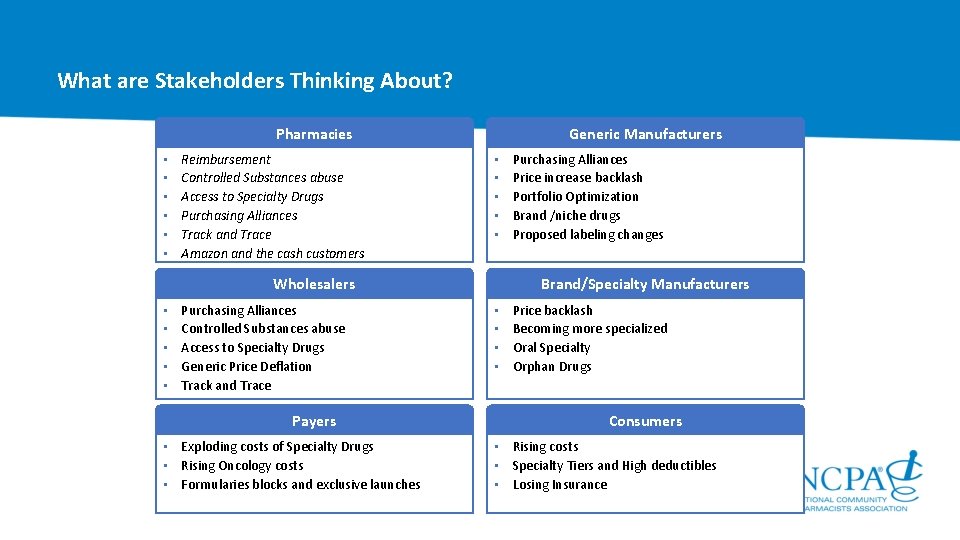
What are Stakeholders Thinking About? Pharmacies • • • Reimbursement Controlled Substances abuse Access to Specialty Drugs Purchasing Alliances Track and Trace Amazon and the cash customers Generic Manufacturers • • • Wholesalers • • • Purchasing Alliances Controlled Substances abuse Access to Specialty Drugs Generic Price Deflation Track and Trace Payers • Exploding costs of Specialty Drugs • Rising Oncology costs • Formularies blocks and exclusive launches Purchasing Alliances Price increase backlash Portfolio Optimization Brand /niche drugs Proposed labeling changes Brand/Specialty Manufacturers • • Price backlash Becoming more specialized Oral Specialty Orphan Drugs Consumers • Rising costs • Specialty Tiers and High deductibles • Losing Insurance
Thank you Disclaimer: • The analyses, their interpretation, and related information contained herein are made and provided subject to the assumptions, methodologies, caveats, and variables described in this report and are based on third party sources and data reasonably believed to be reliable. No warranty is made as to the completeness or accuracy of such third party sources or data. • As with any attempt to estimate future events, the forecasts, projections, conclusions, and other information included herein are subject to certain risks and uncertainties, and are not to be considered guarantees of any particular outcome. • All reproduction rights, quotations, broadcasting, publications reserved. No part of this presentation may be reproduced or transmitted in any form or by any means, electronic or mechanical, including photocopy, recording, or any information storage and retrieval system, without express written consent of IQVIA. • © 2017 IQVIA Incorporated and its affiliates. All rights reserved. Trademarks are registered in the United States and in various other countries.
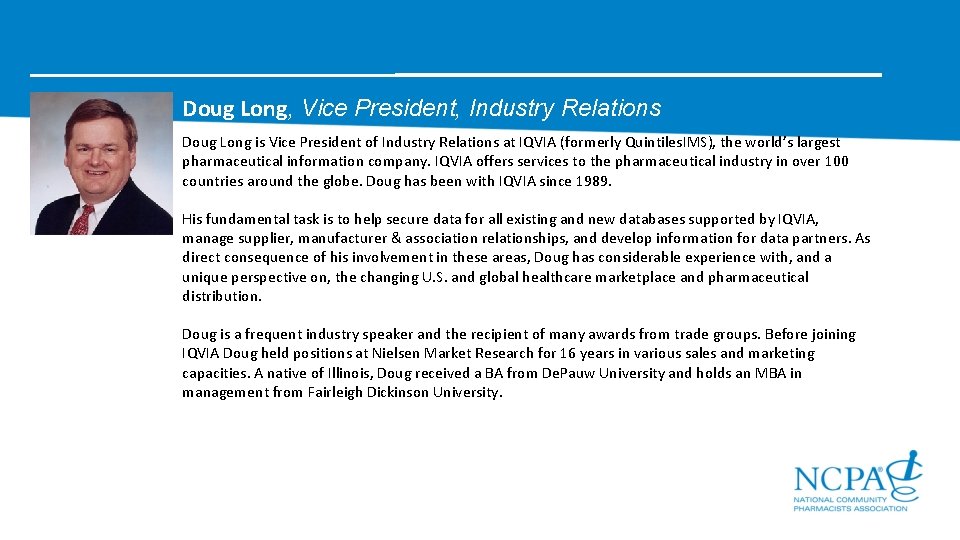
Doug Long, Vice President, Industry Relations Doug Long is Vice President of Industry Relations at IQVIA (formerly Quintiles. IMS), the world’s largest pharmaceutical information company. IQVIA offers services to the pharmaceutical industry in over 100 countries around the globe. Doug has been with IQVIA since 1989. His fundamental task is to help secure data for all existing and new databases supported by IQVIA, manage supplier, manufacturer & association relationships, and develop information for data partners. As direct consequence of his involvement in these areas, Doug has considerable experience with, and a unique perspective on, the changing U. S. and global healthcare marketplace and pharmaceutical distribution. Doug is a frequent industry speaker and the recipient of many awards from trade groups. Before joining IQVIA Doug held positions at Nielsen Market Research for 16 years in various sales and marketing capacities. A native of Illinois, Doug received a BA from De. Pauw University and holds an MBA in management from Fairleigh Dickinson University.
Appendix