PFT Part 2 By Dr Nermine Mounir Lecturer
 By Dr. Nermine Mounir Lecturer of Chest Diseases Faculty of Medicine")
PFT (Part 2) By Dr. Nermine Mounir Lecturer of Chest Diseases Faculty of Medicine Ain shams University

Ventilation � The distribution of ventilation across the lung is related to the position of each area on the compliance curve at the start of a normal tidal inspiration (the point of the FRC) � Because the bases are on a more favourable part of the compliance curve than the apices, they gain more volume change from the pressure change applied and thus receive a greater degree of ventilation. � Although the inequality between bases and apices is less marked for ventilation than for perfusion, overall there is still good V/Q matching and efficient oxygenation of blood passing through the lungs.

Ventilation-Perfusion Coupling Ventilation � Perfusion � Ventilation and perfusion must be tightly regulated for efficient gas exchange � Changes in alveoli PO 2 � Low PO 2 � High PO 2 � � Changes in PCO 2 in the alveoli � Dilate � Constrict

V/Q Mismatching Diseased lungs may have marked mismatch between ventilation and perfusion. Some alveoli are relatively overventilated while others are relatively overperfused q Even normal lungs have some degree of ventilation/perfusion mismatch; the upper zones are relatively overventilated while the lower zones are relatively overperfused & underventilated �

Lung Ventilation/Perfusion Ratios Normally, alveoli at apex of lungs are underperfused & overventilated � Alveoli at base are overperfused & underventilated � Insert fig. 16. 24 16 -44

Ventilation During Exercise � During exercise, arterial PO 2, PCO 2, & p. H remain fairly constant Fig 16. 41 16 -86

� Oxygen consumption increase from 250 ml/min to 4000 ml/min. � CO 2 excretion increase from 200 ml/min to 8000 ml/min.

Ventilation During Exercise � During exercise, breathing becomes deeper & more rapid, delivering much more air to lungs (hyperpnea) � 2 mechanisms have been proposed to underlie this increase: ○ With neurogenic mechanism, sensory activity from exercising muscles stimulates ventilation; and/or motor activity from cerebral cortex stimulates CNS respiratory centers ○ With humoral mechanism, either PC 02 & p. H may be different at chemoreceptors than in arteries �Or there may be cyclic variations in their values that cannot be detected by blood samples 16 -87

Lactate Threshold � Is maximum rate of oxygen consumption before blood lactic acid levels rise as a result of anaerobic respiration �Occurs when 50 -70% maximum 02 uptake has been reached � Endurance-trained athletes have higher lactate threshold, because of higher cardiac output �Have higher rate of oxygen delivery to muscles & greater numbers of mitochondria & aerobic enzymes 16 -88

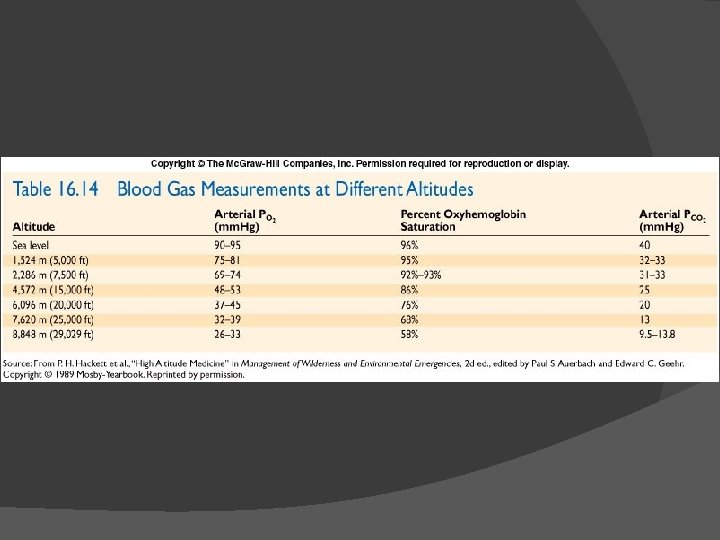
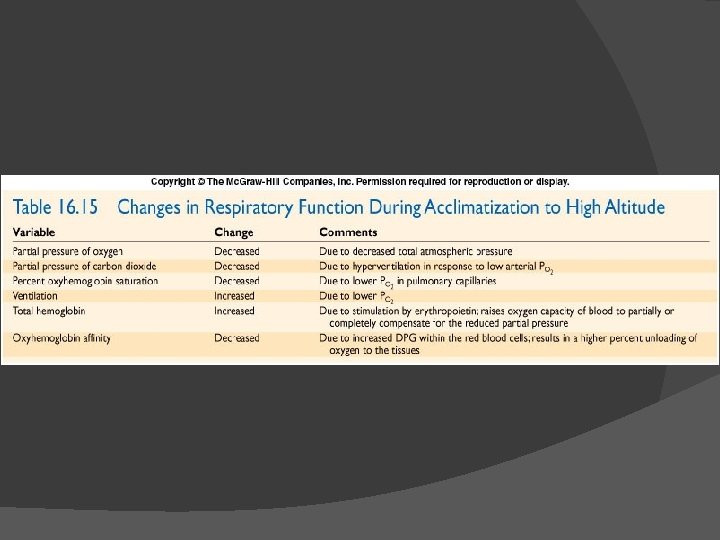
Acclimatization to High Altitude Involves increased ventilation, increased DPG, & increased Hb levels � Hypoxic ventilatory response initiates hyperventilation which decreases PC 02 which slows ventilation �Chronic hypoxia increases NO production in lungs which dilates capillaries there ○ NO binds to Hb & is unloaded in tissues where may also increase dilation & blood flow ○ NO may also stimulate CNS respiratory centers � Altitude increases DPG, causing Hb-02 curve to shift to right � Hypoxia causes kidneys to secrete EPO which increases RBCs � 16 -89
 • 2 -agonists = bronchodilators Response of the bronchial")
REVERSIBILITY TO 2 AGONISTS (Bronchospasmolysis) • 2 -agonists = bronchodilators Response of the bronchial smooth muscle? • Method – – baseline spirometry (FEV 1) inhalation of a 2 -agonists (e. g. , 200 mg salbutamol) 10 min later: spirometry (FEV 1) if FEV 1 12% or 200 ml: positive test Reversibility of the obstruction (e. g. , asthma but not COPD differential diagnosis)

The extend of the immediate spasmolysis depends on: � Circadian rhythm � Airway width � The patient discpline during therapy

BRONCHIAL PROVOCATION TESTS • Exposure of the airways to a stimulus – allergen – exercise – pharmacological bronchoconstrictive agent • Response of the bronchial smooth muscle? – baseline FEV 1 drop in FEV 1 – post-exposure FEV 1 Airway hyperresponsiveness

bronchoprovocation Specific � Reactivity towards allergens Non-specific � Reactivity of the bronchial muscles towards chemical and physical stimulus such as acetylcholine, methacholine, carbachol, cold air, histamine.

� The test considered positive if FEV 1 is reduced by 20% as compared to the initial value. � The patient should not leave the lab before FEV 1 ≥ 90% of the reference value before the test. � FEV 1, PEF 50, PEF less than 70% of the predicted provocation test should not performed.

EXERCISE TESTS • Why exercise? – at rest, the normal lung has enormous reserves of function – during exercise: reserves exercise can reveal minor dysfunctions – to assess disability • Progressive exercise test to exhaustion - ergocycle - VO 2 max “symptom-limited” • Common variables – – work load total ventilation respiratory frequency tidal volume – – – HR ECG blood pressure VO 2, VCO 2 arterial PO 2, PCO 2 and p. H

Indications : � Evaluation of dyspnea � Evaluation of certain pulmonary disorders. � Evaluation of certain cardiovascular disorders. � Assessment of general physical fitness.

Contraindications: General: limiting neurologic , neuromuscular or orthopedic disorders. � Pulmonary: FEV 1 less than 30% of predicted. Pa. O 2 less than 40 mm. Hg at room air. Pa. CO 2 greater than 70 mm. Hg. Severe pulmonary HTN. � Cardiovascular: acute pericarditis – congestive HF – recent MI – Second or third degree heart blocks – tachyarrhythmias – uncontrolled HTN – unstable angina - recent systemic or pulmonary embolism – severe aortic stenosis – thrombophlebitis or intracardiac thrombi. �

DYSPNEA • Sensation of difficulty with breathing - demand of ventilation out of proportion to the patient’s ability to respond to that demand - index of exercise tolerance • Inability to adjust CO 2 and p. H • Common in - unfit people - elderly people - respiratory patients • Poor perception of dyspnea in children undiagnosed asthma (Van Gent et al. , Eur Respir J, 2007)

Respiratory muscle assessment � Measurement of respiratory muscle function is important in the diagnosis of respiratory muscle disease , or respiratory muscle dysfunction. � It may also be helpful in the assessment of the impact of chronic diseases or their treatment on the respiratory muscles.
 unexplained reduction")
Clinical signs of respiratory muscle weakness � � � � � 1) unexplained reduction in vital capacity 2) CO 2 retention while awake or during sleep, specifically in the absence of severe airflow obstruction 3) shortness of breath 4) orthopnoea (shortness of breath while supine), or dyspnoea during bathing or swimming 5) short sentences during speech 6) tachypnoea 7) paradoxical movement of the abdominal or thoracic wall 8) problems with cough (and recurrent infections) 9) generalised muscle weakness
 Unilateral paralysis: mild restriction Bilateral paralysis: severe restriction � ↓VC,")
Pulmonary function test (a) Unilateral paralysis: mild restriction Bilateral paralysis: severe restriction � ↓VC, MVV: 55, 45 % (inspiratory muscle weakness) � ↓ FRC, RV: 35 -40% (pulmonary atelectasis) � Supine VC < 75% of upright (b)

Respiratory muscle force is indirectly measured through the pressure generated during inspiration or expiration. � Maximal voluntary inspiratory (PI, max) and expiratory (PE, max) pressures (or MIP and MEP) are probably the most frequently reported noninvasive estimates of respiratory muscle force. � The PE, max is roughly the double of PI, max �

EMG � One of the most specific tests
 a thin-walled balloon at the lower end")
Transdiaphragmatic pressure Criterion standard for diagnosis (A) a thin-walled balloon at the lower end of the esophagus (pleural pressure) (B) a second balloon manometer in the stomach (intra-abdominal pressure) Pdi= difference between A and B
- Slides: 27