Pesticide Risk Assessment What is FIFRA n n


")


 n n Kd and Koc - rate of soil")


")


 n n Goal is to implement mitigation measures")
- Slides: 38
Pesticide Risk Assessment
What is FIFRA? n n n Federal Insecticide, Fungicide, and Rodenticide Act Requires pesticides sold or used in U. S. to be registered by EPA registration standard: will not cause “unreasonable adverse effects on the environment”
FIFRA REGISTRATION n n Section 3 - Authorizes EPA to register new pesticide products Section 4 - Reregistration of pesticides by EPA to ensure they meet current standards Section 18 - Emergency use requests can be granted by EPA for unregistered pesticide uses Section 24(C) - Special local needs requests can be granted by EPA for new uses of registered products
EPA-OPP Standard Evaluation Procedure for Ecological Risk Assessment n n n Assumes risk is a function of toxicity and exposure RQ = Estimated Environmental Concentration / Toxicity Endpoint RQ compared to levels of concern (LOC’s)
Toxicity Tests Terrestrial Animals Test Species Exposure Endpoint LD 50 Bobwhite/ Mallard Single oral Mortality LC 50 Repro. 5 -d Dietary Mortality 10 -wk Dietary LOEC, NOEC
Toxicity Tests: Aquatic Animals Test Species LC 50 Rainbow, bluegill, sheepshead LC 50 Daphnia, mysid, eastern oyster ELS Fathead, Rainbow, Sheepshead Life Daphnia, mysid, Cycle fish spp. Exposure Endpoint 96 h Mortality 48 -96 h Mortality 30 -100 d LOEC, NOEC 21 -300 d LOEC, NOEC
Toxicity Tests: Terrestrial Invertebrate n Honey bee n n n Acute oral LD 50 Acute dermal LD 50 Residue studies LD 50
Toxicity Test: Plants n n Aquatic plants n Blue-green and green algae (EC 50) n Marine and freshwater diatom (EC 50) n Duckweed (EC 50) Terrestrial plants (EC 25, NOEC) n Six dicots and four monocots (crops) n Root-shoot length, weight, visual
Other Sources of Toxicity Information n Registrant generated test to satisfy registration requirements for other countries n OECD Studies: n Beneficial arthropods n Soil microorganisms n Formulation/mixture studies n Metabolite studies
Human Health Toxicity Studies n n n Rat LD 50 2 generation chronic rat 90 -day sub-chronic rat Inhalation (rat/mouse) Dermal (rabbit)
Other Sources of Toxicity Information n Open Literature Internet Sources (USGS acute toxicity test database, EXTOXNET, PAN pesticide database, WHO/FAO pesticide data sheets) EPA-OPP “One-liner” ecotoxicity and environmental fate databases n www. epa. gov/pesticides/
Laboratory Environmental Fate Studies n n Aerobic Soil Metabolism - rate of degradation by soil microorganisms Hydrolysis - chemical reaction with water forming new molecule (often p. H dependent) Aqueous Photolysis - breakdown of molecules in water through the absorption of light Aerobic and Anaerobic Aquatic Metabolism - rate of metabolism in aqueous environment with and without oxygen.
Laboratory Environmental Fate Studies (continued) n n Kd and Koc - rate of soil adsorption Bioconcentration Factor (BCF) - Ratio of concentration in organism (fish) compared to surrounding medium (water)
Field Environmental Fate Studies n Field Dissipation - evaluate pesticide mobility, degradation and dissipation under actual use conditions n n n agricultural, aquatic, forestry Field Volatility - evaluate pesticide movement when volatilization is concern Dislodgeable residue
Chemical/Physical Studies n n Vapor pressure - measure of a chemicals volatility Solubility - measure of ability to dissolve in a solvent (water) Henry’s Law Constant - ratio of vapor pressure to water solubility Octanol-water partition coefficient (Kow) - ratio of partitioning in octanol to water
EPA-OPP Exposure Analysis n Terrestrial: n n n Aquatic: n n Kenaga Nomogram Monitoring Data GENEEC PRZM/EXAMS Monitoring Data Terrestrial/Aquatic: n Ag. Drift
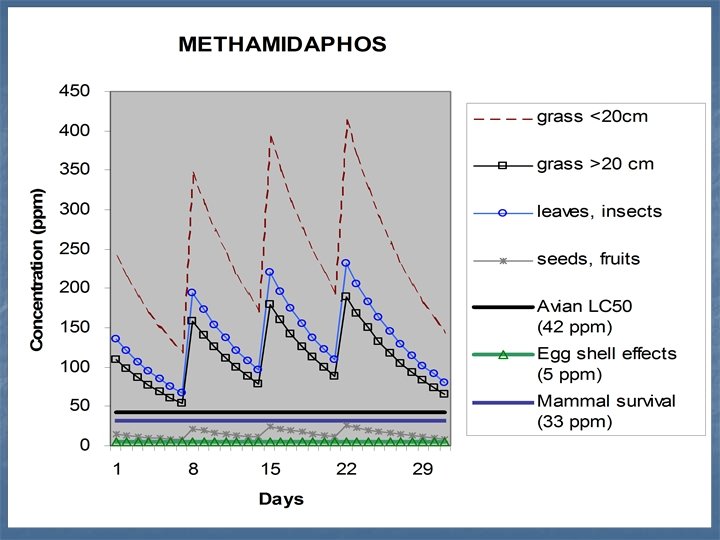
Kenaga Nomogram Review n n Dietary exposure model for liquid broadcast applications Determines maximum and median concentrations on various food items Residue based on application rate and structure of plant/insect Residues independent of application method
Granular, Bait, and Treated Seed Exposure Applications n n n In-furrow applications assume 1% of granules, bait or seed unincorporated Incorporated banded treatments assume 15% material unincorporated Broadcast treatment w/o incorporation assumes 100% of granules, bait, seed unincorporated
Terrestrial Plant Exposure Analysis n n Runoff based on solubility Drift based on standard assumptions for ground (1%) and aerial (5%) applications Scenario based on runoff from 1 -ha to adjacent hectare for terrestrial plants Scenario based on runoff from 10 -ha to adjacent hectare for semi-aquatic plants
Ag. Drift Model Summary n n n Model based on field and wind tunnel studies to determine drift from different application methods Simulates ground, orchard air blast and aerial applications Predicts off-site terrestrial and aquatic concentrations into standard or userdefined waterbodies
Factors that affect drift n n n Droplet size distribution Wind speed/direction Release height Application method Environmental factors (temperature, humidity)
GENEEC Input Parameters n n n Application Rate Koc Application Method # of applications Application Interval Depth of Incorporation n n Aerobic Aquatic Metabolism Solubility Aquatic Photolysis Hydrolysis Aerobic Soil Metabolism
GENEEC Aquatic Screening Model Assumptions n n n Applications occur on a 10 ha field that drains into a one hectare pond 2 -m in depth No buffer between the pond and treated field Runoff is from a single large rainfall event over a 24 -hour period Soil type is considered a high runoff soil (MS silt loam) Drift contribution: n Based on contributions from Ag. Drift
Atrazine estimated environmental concentrations (1 lb/ai)
PRZM/EXAMS Aquatic Exposure Model n n n Site specific model that determines pesticide load from agricultural applications Each simulation is conducted using 36 years of rainfall data to determine variability in loading Calculates edge of field pesticide loadings in surface water and sediment
PRZM/EXAMS Aquatic Exposure Model n n Environmental fate model that simulates the process that occur in the water body Steady state model that has a constant volume Calculates peak maximum, 96 -hour, 21 day and 60 -day average. The 1 in 10 year maximum value is used in calculating risk quotient values
Use of Monitoring Data in Pesticide Risk Assessment n n n Typically used for currently registered pesticides (reregistration, special review) Sources: n NAWQA – USGS n open literature n registrants Considerations for use: n temporal and spatial sampling n storm events vs. base flow
Temporal variability of atrazine and chlorpyrifos in water and sediment
Risk Presumption for Terrestrial Animals Risk Presumption RQ LOC Acute High Risk EEC/LC 50 or LD 50/ft 2 EEC/NOEC 0. 5 Acute Restricted Use Acute Endangered Species Chronic RQ 0. 2 0. 1 1
LOC and Dose Response
Risk Presumption for Aquatic Animals Risk Presumption RQ LOC Acute High Risk EEC/LC 50 or EC 50 EEC/NOEC 0. 5 Acute Restricted Use Acute Endangered Species Chronic RQ 0. 1 0. 05 1
Risk Presumption for Terrestrial Plants Risk RQ LOC Presumption Terrestrial and semiaquatic plants Acute high risk EEC/EC 25 1 Acute ES EEC/NOEC 1 Aquatic plants Acute high risk EEC/EC 50 1 Acute ES EEC/NOEC 1
Exceedance of LOC’s in the Screening Assessment n n Request additional effects data Request additional environmental fate data n n Ex. aerobic aquatic metabolism, foliar dissipation Use higher tier modeling/monitoring to refine exposure analysis and provide site specific exposure distribution
NAWQA Maximum Atrazine Concentrations for 40 Agricultural Sites 130 * Mortality in Phytoplankton & Macrophytes Estimated to Occur at 32 µg/L * Invertebrate Populations Likely to be Reduced at 22 µg/L * Mortality to Macrophytes Estimated to Occur at 18 µg/L * Reduction in Primary Production Likely to Occur at 10 µg/L * Reduction in Primary Production Likely to Occur at 2. 62 µg/L and Reductions in Primary Productivity & Macrophytes Estimated to Occur at 2. 3 µg/L 120 Measured Concenrations (ug/L) 110 100 90 80 70 60 50 40 30 20 10 0 0 10 20 30 40 50 Exceedence % % Sites w/ Atrazine Concs >= Y Source: Reregistration Eligibility Decision: Environmental Fate and Effects Chapter. 2002. 60
EPA-OPP Risk Mitigation for Fish and Wildlife n n n Eliminate use on specific crop Buffer zones Time of application Application method and rates Number of applications Spray drift best management practices
OPP Endangered Species Protection Program (ESPP) n n Goal is to implement mitigation measures to eliminate adverse impact to listed spp. Currently ESPP defers to “county bulletins” Program in place since 1989 n Voluntary BMPs for listed species n Very few county bulletins complete n Service has not consulted on county bulletins n n Service currently working with OPP to review ESPP