PERT CHART PROGRAM EVALUATION REVIEW TECHNIQUE PERT chart


 that represent key milestones within a")


- Slides: 18
PERT CHART
PROGRAM EVALUATION REVIEW TECHNIQUE PERT chart is a project management multipurpose tool that allows getting a graphical representation of a project timeline. It used to schedule, organize, and coordinate tasks within a project. It is basically a method to analyze the tasks involved in completing a given project, especially the time needed to complete each task, and to identify the minimum time needed to complete the total project.
A PERT diagram formula was described in 1958 for the US Navy’s projects. They wanted to find a simple system to manage and organize complex objectives.
These diagrams consist of circles or rectangles (nodes) that represent key milestones within a project. Lines or vectors that represent different tasks connect the nodes. When an arrow is drawn from task A to task B, it means that task A must be completed before task B. You can create parallel tasks that can be located at the same stage of production but on different task lines. They are not dependent on one another.
The diagram represents events that must be implemented within a project’s lifetime. • Arrows show directions and indicate flows of events that need to occur. • Dotted lines represent dummy activities, which are items located on another path. • Numbers assigned to each task regulate them. They are located inside each vector.
HOW TO READ A PERT CHART PERT charts are all about estimating, tracking and managing time. Your tasks and time estimates are represented in very specific ways so that you can read a lot of information at a glance. Dependent events have to be completed in order. Non-dependent events can be worked on at the same time. A complete chart also includes time estimates for each task using expected time
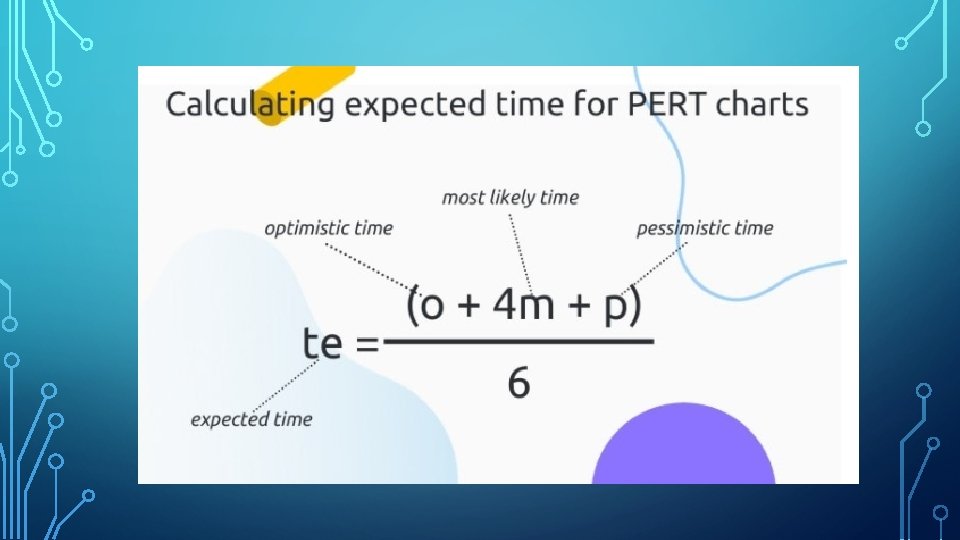
In PERT analysis, there are three estimate points. They include optimistic, pessimistic, most likely and expected estimates. Optimistic (o) means it is unlikely that a task can take a shorter period. Pessimistic (p) means that it is unlikely that a task can take a longer period. Most likely time (m) is the strongest estimate of how long it will take to finish an activity if no problems come up. This should be between your optimistic and pessimistic estimates. Expected time (te) is a weighted average of your first three times estimates. It leans strongly towards the most likely time, but takes into account that some parts of your project will go smoothly and others will likely encounter some problems. Calculate expected time using this formula: te = (o + 4 m + p) ÷ 6
CONSISTENT STEPS TO CREATE A PERT DIAGRAM • List the levels and steps in a project, define the time required to complete each event. • Add dependencies to create relationships between events. • Lines show the time that each event takes. They should begin and end above the point on the timeline. • Each line in your diagram should come to a step that’s dependent on the completion of the event that the line comes from. This diagram also demonstrates the critical path with task sequences that need to be managed carefully to finish all objectives on time.
1. DEFINE MILESTONES Start by choosing milestones that represent major events in your timeline. Break each milestone down into the individual tasks needed to accomplish it. These will go in your nodes. Example: Next, think through the tasks that move from milestone to milestone. 1. 2. 3. Beginning 4. 5. 6. Website product pages designed Website requirements complete Product photography uploaded to website New product pages developed New products website (end) launched • Create an outline of requirements • Design product pages • Complete product photography • Build new product pages in the correct digital catalog on • Get QA approval to publish
2. PUT TASKS IN ORDER To figure out how long your project will take, put your milestones and tasks in order. The sequence of your project tasks might not be a straight line. Identify which are dependent and which are non-dependent. Let’s check in. Each task is placed in chronological order and identifies which are dependent and non-dependent. Events 3 and 4 are non-dependent. They can happen at the same time as long as event 2 is done. Event 5 is dependent on both events 3 and 4, so it can only happen when both are done. In other words, work can be sent to the designer and photographer at the same time, but the product pages can’t be developed until the design and photography are both finished.
3. CREATE THE DIAGRAM
4. CALCULATE EXPECTED TIME Create a time estimate for each task using the 3 types of PERT estimates: optimistic (o), pessimistic (p), and most Likely (m). You’ll use these to calculate expected time (te).
5. IDENTIFY THE CRITICAL PATH AND SLACK The critical path is the longest timeline for your project. Slack is the extra time you have to complete tasks because other non-dependent tasks are expected to take longer. To find the critical path and slack highlight the longest estimates between each node. This shows overall critical path and the greatest amount of time is needed for the entire project — 19 days.
This process also shows her slack, which means tasks with more wiggle room. The photographer only needs two days to get her work done between events 2 and 3, but the designer needs five days between events 2 and 4 on the critical path. The photography task has three days of slack. While the photographer can be a few days late without impacting project delivery, the designer must be on time.
6. UPDATE AS NEEDED Update your PERT chart as your project progresses. Otherwise, you’ll look back at it halfway through and realize it’s no longer accurate or useful. PERT chart is a living document. If there are delays or other changes, adjust it and calculate the new expected delivery date. By keeping the PERT chart up to date, it remains valuable throughout the project.
PERT СHARTS BENEFITS FOR PROJECT MANAGERS: • Using the charts, project managers can evaluate and analyze time and resources required for a project. • The ability to track and manage assets needed during any production stage. • Diagram analysis contains data and information from different departments. It optimizes communication during the project’s course, defines responsible parties across the organization and encourages responsibility. • Program Evaluation Review Technique charts help project managers to perform “what-if” analysis. This kind of analysis identifies possibilities and uncertain points related to activities and helps to minimize surprises and waste. “What-if” also highlights all activities with a risk that require careful analyzing and monitoring during the project.
SOME PERT СHART PROJECT MANAGEMENT DISADVANTAGES: • PERT technique requires the activities arrangement in time sequence. The analysis process is subjective in nature, that’s why these charts can not accurately estimate cost and time. • The method determines labor and material equipment requirements for some project activities. However, PERT is primarily a time-focused method. • The method requires a detailed research and study of the comments from many people and project activities. • Program Evaluation Review Technique is quite expensive to support because of the labor-intensive nature of the method.