Peritoneal dialysis Dr Ejaz Ahmed Barrier to transport

Peritoneal dialysis Dr Ejaz Ahmed
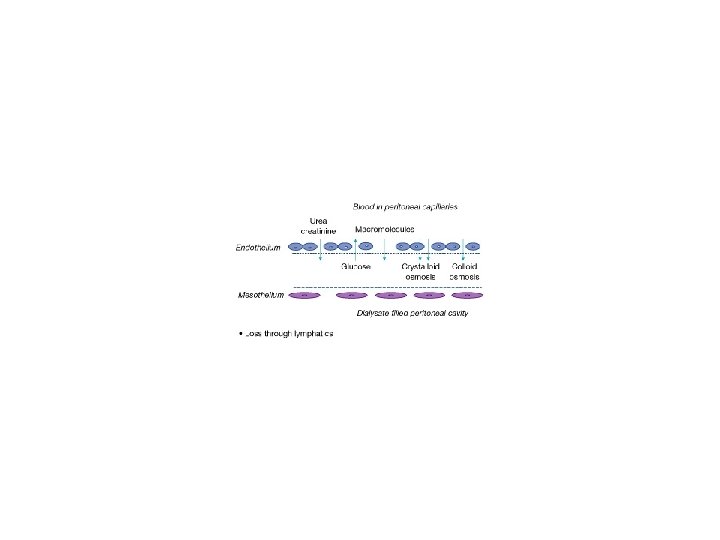

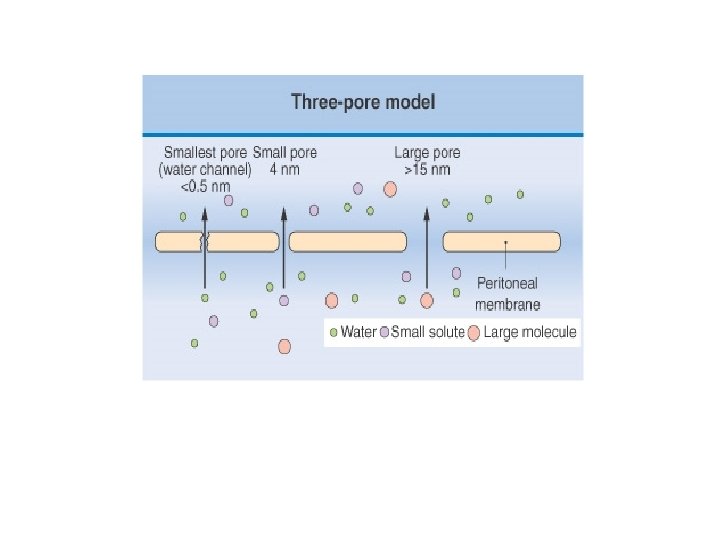
Barrier to transport • Mesothelium – Does not hinder transport • Interstitium – Hinders transport to some extent • Endothelium – Main barrier
 – Depends")
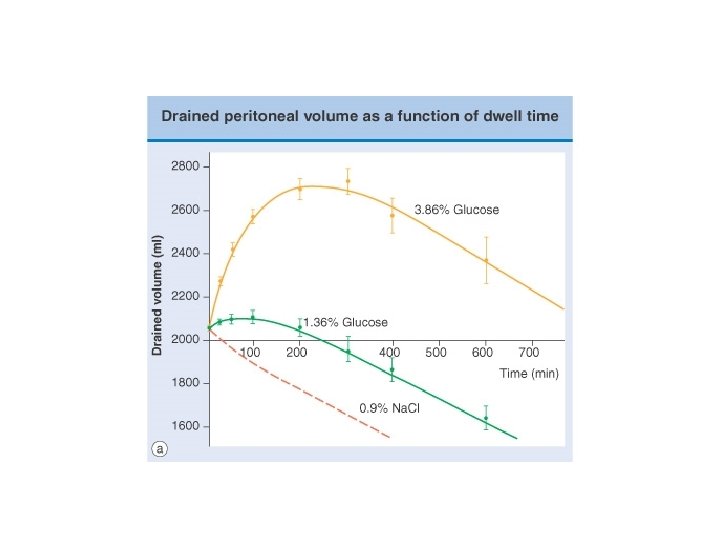
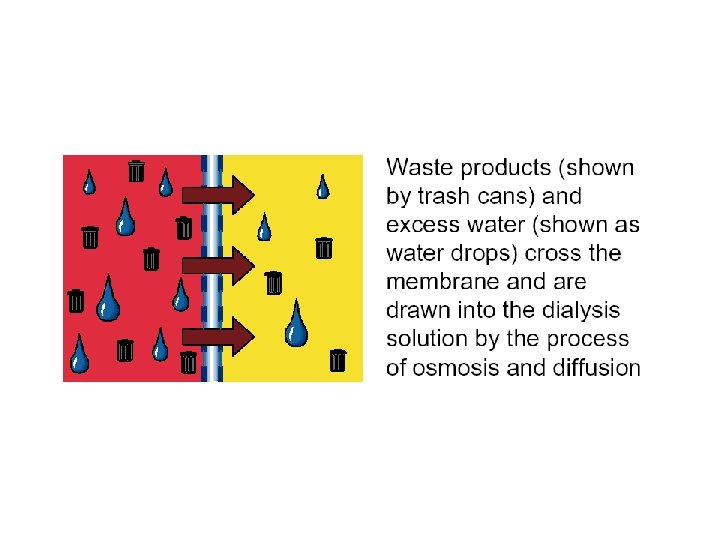
Peritoneal transport principles • Diffusion – Depends on concentration gradient • Convection(filtration) – Depends on hydrostatic pressure and osmotic pressure

Diffusion • Dr=p×a×c • • Dr=diffusion rate P=solute permeability A=area of membrane C=concentration gradient
 – UFr=ultrafiltration rate – P=permeability of water – A=surface area –")
Ultrafiltration • UFr=p×a×(Hp+Op) – UFr=ultrafiltration rate – P=permeability of water – A=surface area – Hp=hydrostatic pressure gradient – Op=osmotic pressure gradient

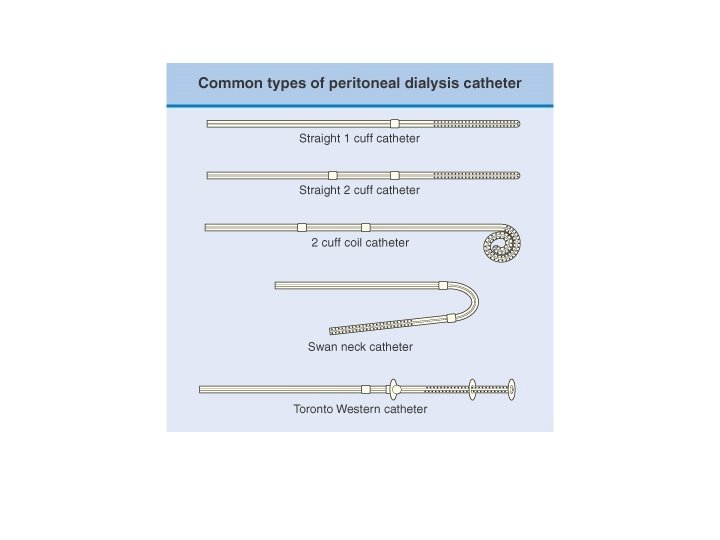
Material of catheter • Silicone rubber – Milky white material • Polyurethane – Clear material

Catheter design • Three portions – Intraperitoneal – External • Cuffs – Dacron material – One or two

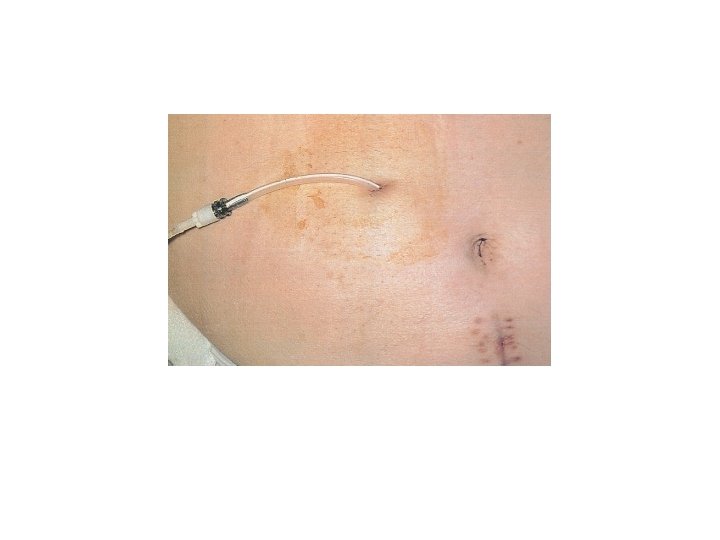
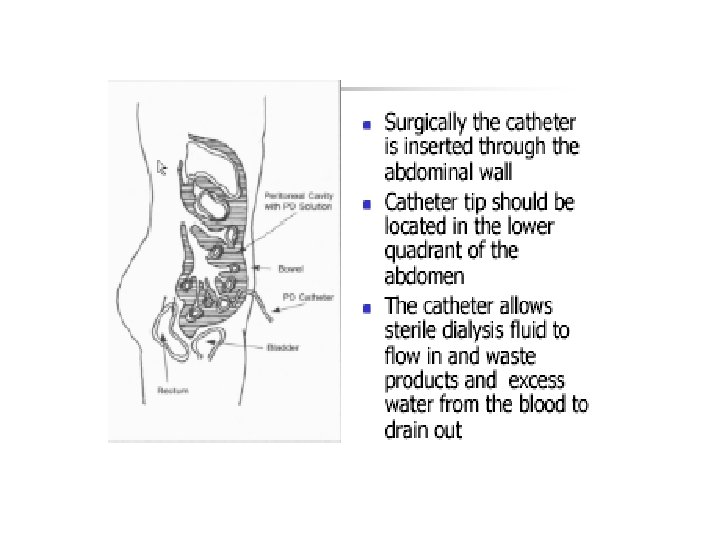
Placement of catheter • Open surgical placement • Peritoneoscopic placement • Blind placement

Proper location of catheter • Intraperitoneal portion – Directed towards pelvis • Cuff – Deep: within medial or lateral border of rectus sheath – Superficial: about 2 cms from skin exit
 132 -134 Potasium(mmol/L) 0 -2 Calcium(mmol/L) 1. 0")
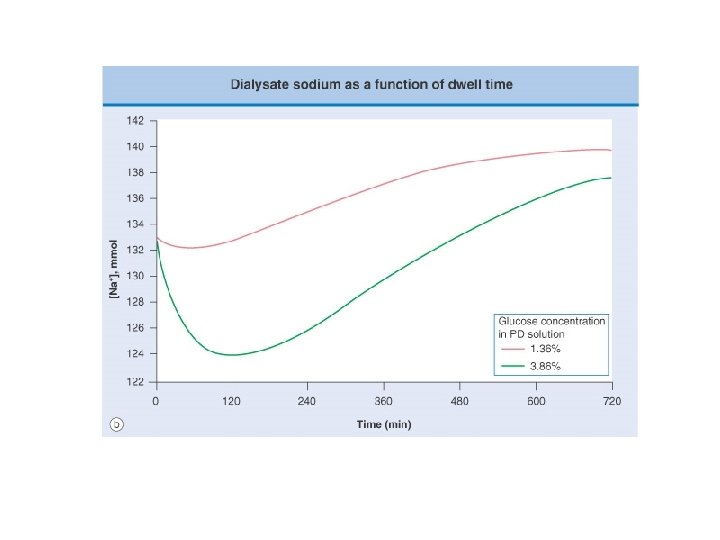
Composition of peritoneal dialysis fluid Sodium(mmol/L) 132 -134 Potasium(mmol/L) 0 -2 Calcium(mmol/L) 1. 0 -1. 75 Magnesium(mmol/L) 0. 25 -0. 75 Chloride(mmol/L) 95 -106 Lactate(mmol/L) 35 -40 Bicarbonate(mmol/L) 34 Bicarbonate/lactate 25/15 Glucose(g/dl) 1. 36 -4. 25 lcodextrin(g/dl) 7. 5 Amino acids(g/dl) 1. 1

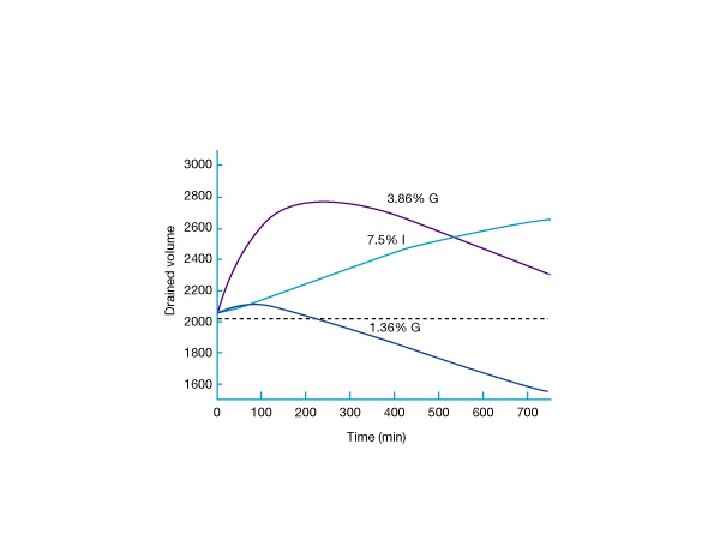
Osmotic agents • Low molecular weight – Glucose- 1. 5%, 2. 5%, 4. 25% – Glycerol – Amino acids • High molecular weight – Albumin – Glucose polymer – peptides

Clearance • Theoretical concept • “Volume of plasma from which all the substance has been removed and excreted into the urine per unit time” Amount excreted = Urine volume x urine concentration Excretion rate = Urine volume x urine concentration Time

Clearance Example Clearance of a substance x • Excretion rate = 100 mg/ml x 1 ml = 100 mg/min 1 minute • Concentration of substance x in plasma = 1 mg/ml • Amount of plasma cleared per minute = 100 mg/min = 100 ml 1 mg/ml Clearance = U x V Tx. P

Principles of Clearance

Principles of Clearance

Clearance of Inulin
 Urea kidney CAPD 750 HD HD standard High flux 130 Vit B")
Substance (L/wk) Urea kidney CAPD 750 HD HD standard High flux 130 Vit B 12 1200 30 80 40 Inulin 1200 10 40 20 β 2 Microg 1000 0 300 250 70
 – Normalised to total body water •")
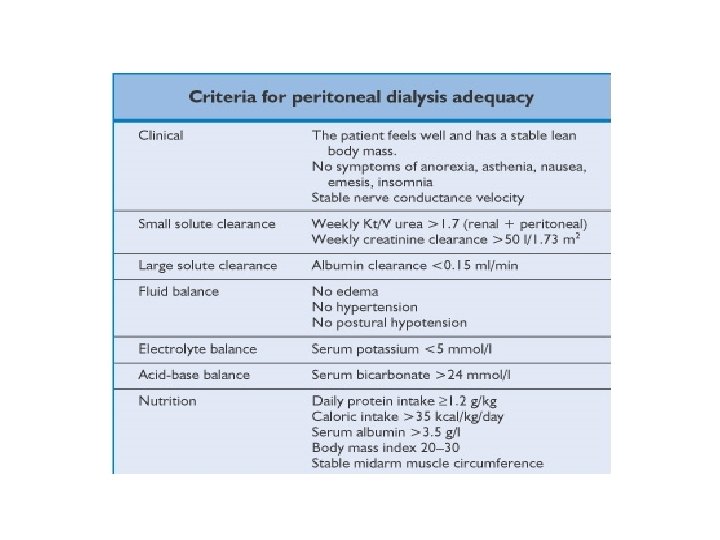
Small solute clearance • Urea clearance (Kt/V) – Normalised to total body water • Creatinine clearance (Cr. Cl) – Normalised to body surface area

Total clearance • Sum of – Residual renal clearance – Peritoneal dialysis clearance

Method of calculating dialysate clearance of urea • 24 hr collection of peritoneal dialysate effluent • Measure urea concentration in dialysate • Estimate total urea content – Urea concentration × volume of effluent • Calculate clearance – Kt = Urea content in dialysate Serum urea level

Method of calculating renal clearance of urea • Collect 24 hr urine • Measure urea concentration in urine • Estimate total urea content – Urea concentration × urine volume • Calculate renal clearence of urea – Kt = Urea content in urine serum urea level

Total and normalised clearance • Total clearance – Dialysate clearance + renal clearance • Normalised clearance (Kt/V) – Dialysate clearance + renal clearance Total body water

Calculate clearance • A 50 yr old man weighing 66 Kg has no urine output. He is on CAPD with four 2. 5 L exchanges daily. His blood urea is 160 mg/dl and dialysate urea concentration of 24 hr collection is 140 mg/dl. calculate his daily clearance

Complications of peritoneal dialysis • Mechanical complication of catheter – Catheter obstruction/inadequate drain – Perforation and laceration of organs – Peritoneal catheter leaks • Infectious complications – Exit site infection – Peritonitis
 Cloudy fluid 98 -100 Abdominal pain 67 -97 Abdominal")
Clinical presentation of peritonitis (percentages) Cloudy fluid 98 -100 Abdominal pain 67 -97 Abdominal tenderness 62 -79 Fever 34 -36 Chills 18 -23 Nausea 30 -35 Vomiting 25 -30 Diarrhoea 7 -15

Route of entry for peritonitis • • • Touch contamination Catheter related Enteric Haematogenous Gynaecological

Organisms causing peritonitis • Gram-positive – Staphylococcus epidermidis – Staphylococcus aureus – Streptococcus – Enterococcus • Gram-negative • Fungal • Mycobacterial

Differential diagnosis of cloudy effluent • • Infectious peritonitis Eosinophilic peritonitis Sclerosing peritonitis Chylous ascites Malignant ascites Pancreatitis Chemical peritonitis

Treatment of peritonitis • Antibiotics – Intraperitoneal route • Continuous • Intermitent – Intravenous route • Pain control
-30%")
Outcome and sequelae • • • Resolution-60 -90% Abscess formation-1% Transfer to hemodialysis(technique failure)-30% Sclerosing peritonitis-1 -2% Death-1 -6%

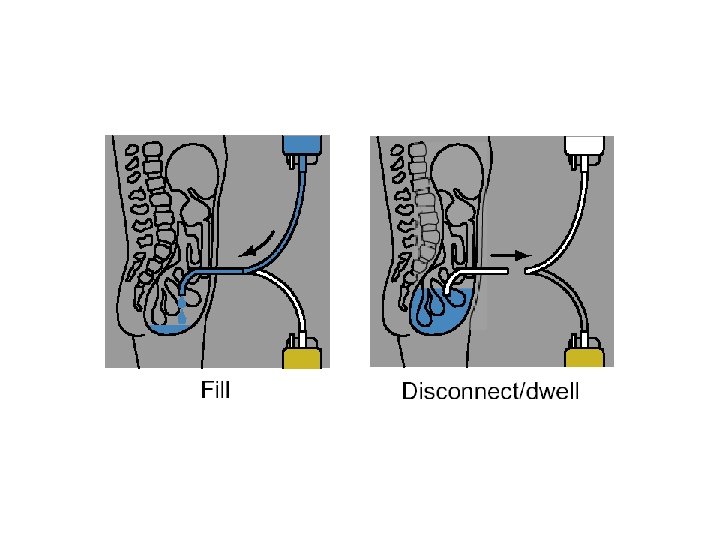
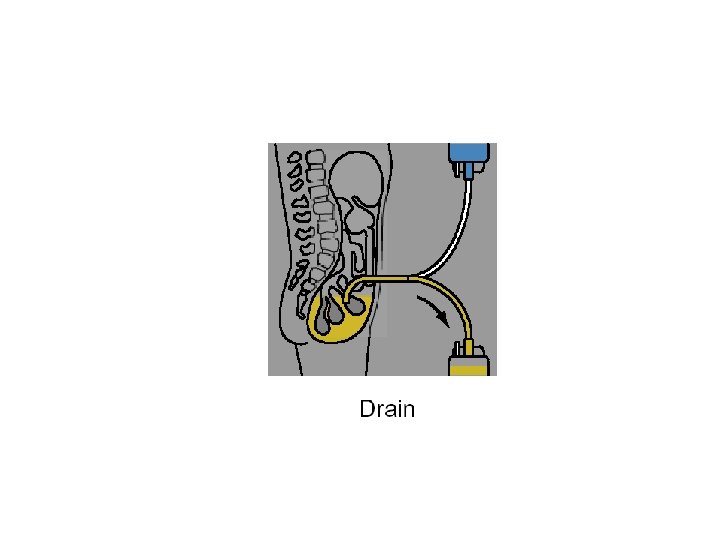
Types of peritoneal dialysis • Manual – CAPD-Continuous ambulatory peritoneal dialysis • Automated – CCPD-Continuous cyclic peritoneal dialysis – NIPD-Nocturnal intermittent peritoneal dialysis – TDP-Tidal peritoneal dialysis
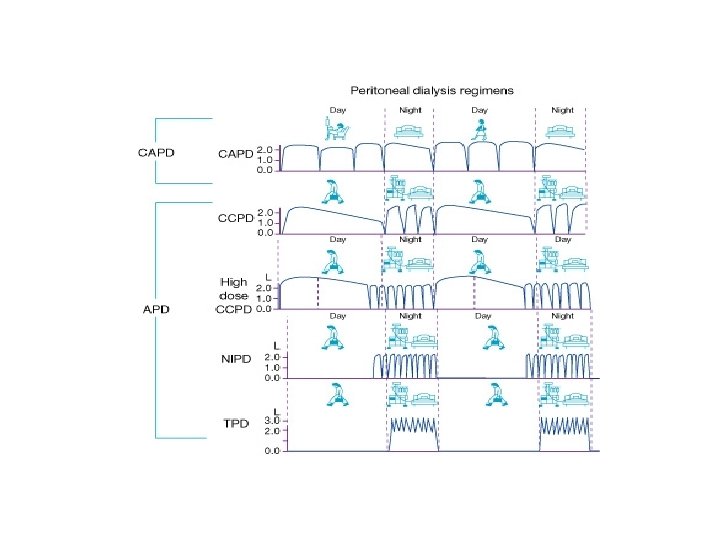

TYPE Day exchange Night exchange Volume of exchange CAPD 2 -3 1 -2 1 -3 CCPD 1 3 -4 1 -3 NIPD 0 3 -5 2 -3 TDP 0 20 1 -1. 5

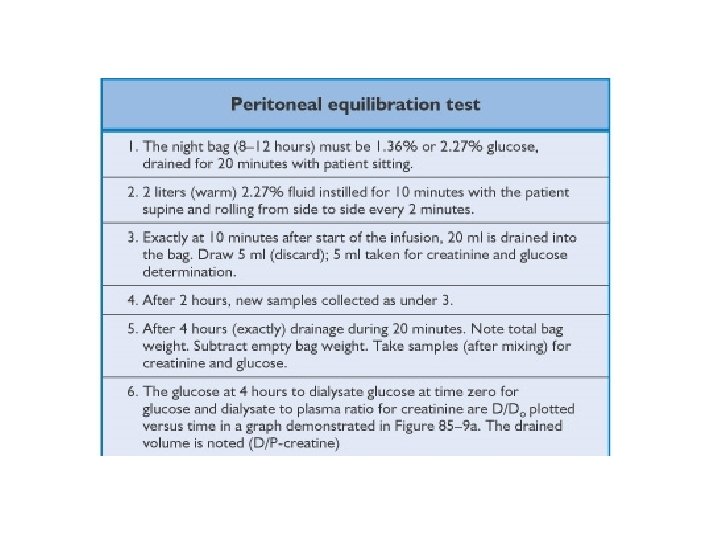
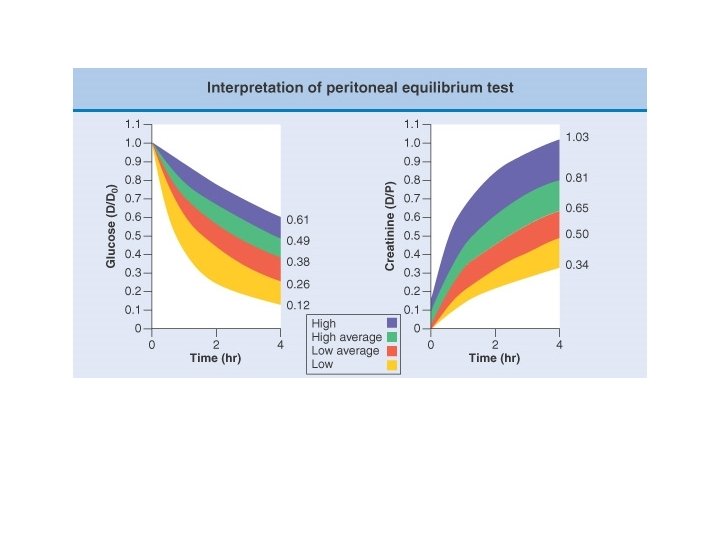
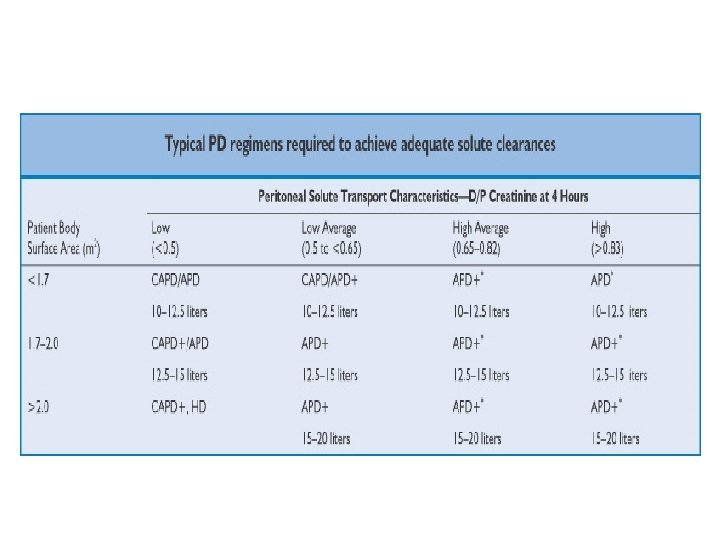
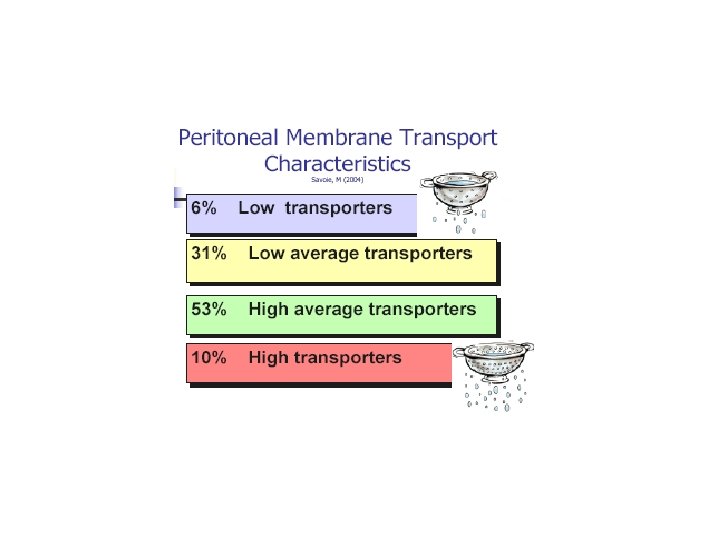
Peritoneal transport assessment • PET test – Concentration of creatinine in dialysis solution at four hrs – Concentration of creatinine in plasma at same time – Ratio of dialysate creatinine to plasma creatinine is calculated – Subject is classified into different transporter group

Improving outcomes: equal or better survival in first 2– 3 years Better preservation of RRF versus HD Higher haemoglobin levels; less erythropoietin use Preservation of vascular access for HD Provides continuous UF for improved blood pressure and volume control Better outcomes post-transplant Less risk of acquiring blood borne virus (hepatitis C) Patient benefits including more flexible holidays and travel and higher employment rates; better quality of life than maintenance HD Ability to expand patient numbers in a dialysis centre with limited need for resources and major capital investments Lower staff to patient ratio than maintenance HD Less costly than maintenance HD
- Slides: 57