PERFORMANCEBASED MONITORING ANALYSIS SYSTEM PBMAS 2018 2019 TRAINING
 2018 -2019 TRAINING Region 9 ESC November 28, 2018")
PERFORMANCE-BASED MONITORING ANALYSIS SYSTEM (PBMAS) 2018 -2019 TRAINING Region 9 ESC November 28, 2018

Welcome! § Micki Wesley, Director of Accountability and Compliance § Kara Fluty, Educational Specialist, ESSA § Tracy Patrick, Educational Specialist, Accountability and Compliance § Angelina Chapa, BE/ESL § Michael Chapman, CTE § Amy Blackwell, Sp. Ed

PBMAS District-level Data-driven Part of TEA’s annual evaluation of school districts’ performance and program effectiveness 4 federally-funded program areas

BE/E SL CT E ESS A SPE D • Bilingual Education/English as a Second Language • Career & Technical Education • Every Student Succeeds Act • Special Education

ACRONYMS Reminder on Acronyms FRE Federally Required Elements PL Performance Level RI Required Improvement SA Special Analysis YAE Year-After-Exit MSR Minimum Size Requirement SD Significant Disproportionality RP Reasonable Progress DDV Discipline Data Validation

PERFORMANCE LEVELS Highest Score Lowest Score Not Assigned N/A 0 1 2 3 0 SA 1 SA 2 SA 3 SA 0 RI

ADDRESSING N/A’S • N/A – doesn’t mean you met standard; means you did NOT meet MSR • N/A does NOT mean PL of 0 • The only data you do NOT need to address is a performance level of 0 or No Data • Ensure accuracy of No Data • Look at numbers (denominators/numerators) on report to see true performance level

PMBAS Staging § The following LEAs will be required to engage in a district continuous improvement process: § LEAs staged for interventions in either single or multiple PBMAS program areas, which includes the assignment of a determination level for one or more of the federally-required elements (FREs)1 for the special education program.

Intervention Process Overview § LEAs are evaluated in each PBMAS program area and assigned a stage of intervention if they have: § one or more PBMAS indicators with a performance level (PL) 3 or 4 and/or § (for the special education program) a determination level for one or more of the FREs. § LEAs that are assigned a stage for intervention are assigned as a Stage 1, 2, 3, or 4. § Intervention activities for all program areas at any stage of intervention will include engaging in a district continuous improvement process (i. e. data analysis, root cause analysis, strategy selection and planning, implementation fidelity and monitoring, ). § Only LEAs who are assigned a Stage of 3 or 4 in any program area must submit their targeted improvement plan (TIP) to TEA via ISAM. § LEAs staged for interventions in any program area at Stage 1 or 2, develop their targeted improvement plan and retain it and
 and District Coordinator of School Improvement (DCSI) § LEAs required")
District Leadership Team (DLT) and District Coordinator of School Improvement (DCSI) § LEAs required to engage in interventions must establish district leadership team, composed of key LEA personnel and stakeholders, to conduct and monitor the activities of the process. The DLT must include a DCSI. The DCSI is a district-level employee who is in a leadership position in special programs, school improvement, curriculum and instruction, or another position with responsibility for student performance. § Membership of the DLT should include representatives from programs staged for interventions, LEA staff responsible for school improvement, curriculum and instruction, and other programs that may have an impact on student performance and program effectiveness. § LEA is not required to submit a list of DLT members unless requested by TEA. § LEA is required to submit the name of the DCSI through ISAM. § Stage 3 & 4

2018 -2019 PBMAS Resources § 2018 PBMAS Manual https: //tea. texas. gov/pbm/PBMASManuals. aspx § The following resources are available at https: //tea. texas. gov/Student_Testing_and_Accountability /Monitoring_and_Interventions/Program_Monitoring_and_I nterventions/Performance-Based_Monitoring/ § Performance Based Monitoring Analysis System (PBMAS) Interventions guidance § 2018 -2019 Interventions and Submissions: PBMAS Districts (calendar) § 2018 -2019 PBMAS Staging Framework § District Targeted Improvement Plan
")
PBMAS Masked Reports and Download Files § The 2018 Performance-Based Monitoring Analysis System (PBMAS) masked district/open-enrollment charter reports and masked data download files are available at the following links: § https: //rptsvr 1. tea. texas. gov/pbm/distrpts. html (MASKED DISTRICT/OPENENROLLMENT CHARTER REPORTS) § https: //rptsvr 1. tea. texas. gov/pbm/download. html (MASKED DATA DOWNLOAD)

Stage 3 or 4 ONLY

BILINGUAL EDUCATION/ENGLISH AS A SECOND LANGUAGE
: BE STAAR 3 -8 Passing Rate § BE/ESL")
Bilingual/ESL Indicators § BE/ESL Indicator #1(i-v): BE STAAR 3 -8 Passing Rate § BE/ESL Indicator #2(i-v): ESL STAAR 3 -8 Passing Rate § BE/ESL Indicator #3(i-v): LEP (Not Served in BE/ESL) STAAR 3 -8 Passing Rate § BE/ESL Indicator #4(i-v): LEP Year-After-Exit (YAE) STAAR 3 -8 Passing Rate § BE/ESL Indicator #5(i-iv): LEP STAAR EOC Passing Rate § BE/ESL Indicator #6: LEP Annual Dropout Rate (Grades 7 -12) § BE/ESL Indicator #7: LEP Graduation Rate § BE/ESL Indicator #8: TELPAS Reading Beginning Proficiency Level Rate (Report Only) § BE/ESL Indicator #9: TELPAS Composite Rating Levels for Students in U. S. Schools Multiple Years (Report Only)
 Additional provisions pertaining")
2018 PBMAS Preview: BE/ESL Program Area and Indicator Number BE/ESL #1(i-v) Additional provisions pertaining to this indicator will be covered in the 2018 PBMAS Other System Components preview. Indicator Name BE STAAR 3 -8 Passing Rate (M, R, S, SS, W) 2017 PBMAS q Add SA q. Three years of data available for analysis 2018 PBMAS q No Changes *STAAR- The STAAR 3 -8 passing rate is based upon STAAR, STAAR Spanish, and STAAR Alternate 2.
 Additional provisions pertaining")
2018 PBMAS Preview: BE/ESL Program Area and Indicator Number BE/ESL #2(i-v) Additional provisions pertaining to this indicator will be covered in the 2018 PBMAS Other System Components preview. Indicator Name ESL STAAR 3 -8 Passing Rate (M, R, S, SS, W) 2017 PBMAS q. Add SA q. Three years of data available for analysis 2018 PBMAS q No Changes
 Additional provisions pertaining")
2018 PBMAS Preview: BE/ESL Program Area and Indicator Number BE/ESL #3(i-v) Additional provisions pertaining to this indicator will be covered in the 2018 PBMAS Other System Components preview. Indicator Name LEP (Not Served in BE/ESL) STAAR 3 -8 Passing Rate (M, R, S, SS, W) 2017 PBMAS q. Add SA q. Three years of data available for analysis 2018 PBMAS q No Changes
 Additional provisions pertaining")
2018 PBMAS Preview: BE/ESL Program Area and Indicator Number BE/ESL #4(i-v) Additional provisions pertaining to this indicator will be covered in the 2018 PBMAS Other System Components preview. Indicator Name LEP YAE STAAR 3 -8 Passing Rate (M, R, S, SS, W) 2017 PBMAS q. Add SA q. Three years of data available for analysis 2018 PBMAS q No Changes
 LEP")
2018 PBMAS Preview: BE/ESL Program Area and Indicator Number Indicator Name BE/ESL #5(i-iv) LEP STAAR EOC Passing Rate (M, S, SS, ELA) Additional provisions pertaining to this indicator will be covered in the 2018 PBMAS Other System Components preview. 2017 PBMAS Add RI for ELA q Add SA (except ELA) q Three years of data available for analysis (two years for ELA) q 2018 PBMAS There are three years of data available for ELA q Add SA for ELA q

2018 PBMAS Preview: BE/ESL Program Area and Indicator Number BE/ESL #6 Indicator Name LEP Annual Dropout Rate (Grades 7 -12) 2017 PBMAS q No Changes 2018 PBMAS q No Changes

2018 PBMAS Preview: BE/ESL Program Area and Indicator Number BE/ESL #7 Indicator Name LEP Graduation Rate 2017 PBMAS Add RI q Two years of data available for analysis q 2018 PBMAS q No Changes

2018 PBMAS Preview: BE/ESL Program Area and Indicator Number BE/ESL #8 Indicator Name TELPAS Reading Beginning Proficiency Level Rate 2017 PBMAS Add SA q Three years of data available for analysis q Align PLs with TELPAS Composite Rating Indicator: q 2018 PBMAS q Report Only- Due to the changes in TELPAS and the timing of the standard setting in late summer PL 0 = 0% to 7. 5% (no change) PL 1 = 7. 6% to 10. 5% PL 2 = 10. 6% to 14. 4% PL 3 = 14. 5% to 100% *For 2017 and prior, composite ratings were calculated using, in part, the student’s TELPAS Listening and Speaking (grades 2 -12) performance as determined by a holistic rating system. In 2018, the composite ratings will instead use the student’s TELPAS Listening and Speaking performance as determined by the new item-based standardized assessments. Report only for BE/ESL #8 and #9 is proposed due to the changes in TELPAS and the timing of the standard setting in late summer.

2018 PBMAS Preview: BE/ESL Program Area and Indicator Number BE/ESL #9 Indicator Name TELPAS Composite Rating Levels for Students in U. S. Schools Multiple Years q 2017 PBMAS 2018 PBMAS No Changes Report Only. Due to the changes in TELPAS and the timing of the standard setting in late summer TELPAS Listening and q *For 2017 and prior, composite ratings were calculated using, in part, the student’s Speaking (grades 2 -12) performance as determined by a holistic rating system. In 2018, the composite ratings will instead use the student’s TELPAS Listening and Speaking performance as determined by the new item-based standardized assessments. Report only for BE/ESL #8 and #9 is proposed due to the changes in TELPAS and the timing of the standard setting in late summer.

CAREER AND TECHNICAL EDUCATION
: CTE STAAR EOC Passing Rate")
Career and Technical Education Indicators § CTE Indicator #1(i-iv): CTE STAAR EOC Passing Rate § CTE Indicator #2(i-iv): CTE LEP STAAR EOC Passing Rate § CTE Indicator #3(i-iv): CTE Economically Disadvantaged STAAR EOC Passing Rate § CTE Indicator #4(i-iv): CTE SPED STAAR EOC Passing Rate § CTE Indicator #5: CTE Annual Dropout Rate (Grades 9 -12) § CTE Indicator #6: CTE Graduation Rate § CTE Indicator #7: CTE Nontraditional Course Completion Rate-Males § CTE Indicator #8: CTE Nontraditional Course Completion Rate-Females
 Additional provisions pertaining")
2018 PBMAS Preview: CTE Program Area and Indicator Number CTE #1(i-iv) Additional provisions pertaining to this indicator will be covered in the 2018 PBMAS Other System Components preview. Indicator Name CTE STAAR EOC Passing Rate (M, S, SS, ELA) 2017 PBMAS Add RI for ELA q Add SA (except ELA) q Three years of data available for analysis (two years for ELA) q 2018 PBMAS There are three years of data available for ELA q Add SA for ELA q
 Additional provisions pertaining")
2018 PBMAS Preview: CTE Program Area and Indicator Number CTE #2(i-iv) Additional provisions pertaining to this indicator will be covered in the 2018 PBMAS Other System Components preview. Indicator Name CTE LEP STAAR EOC Passing Rate (M, S, SS, ELA) 2017 PBMAS Add RI for ELA q Add PL 4 for ELA q Add SA (except ELA) q Three years of data available for analysis (two years for ELA) q 2018 PBMAS There are three years of data available for ELA q Add SA for ELA q
 Additional provisions pertaining")
2018 PBMAS Preview: CTE Program Area and Indicator Number CTE #3(i-iv) Additional provisions pertaining to this indicator will be covered in the 2018 PBMAS Other System Components preview. Indicator Name CTE Economically Disadvantaged STAAR EOC Passing Rate (M, S, SS, ELA) 2017 PBMAS Add RI for ELA q Add SA (except ELA) q Three years of data available for analysis (two years for ELA) q 2018 PBMAS There are three years of data available for ELA q Add SA for ELA q
 Additional provisions pertaining")
2018 PBMAS Preview: CTE Program Area and Indicator Number CTE #4(i-iv) Additional provisions pertaining to this indicator will be covered in the 2018 PBMAS Other System Components preview. Indicator Name CTE SPED STAAR EOC Passing Rate (M, S, SS, ELA) 2017 PBMAS Add RI for ELA q Add PL 4 for ELA q Add SA (except ELA) q Three years of data available for analysis (two years for ELA) q 2018 PBMAS There are three years of data available for ELA q Add SA for ELA q

2018 PBMAS Preview: CTE Program Area and Indicator Number Indicator Name 2017 PBMAS 2018 PBMAS CTE #5 CTE Annual Dropout Rate (Grades 9 -12) q No Changes CTE #6 CTE Graduation Rate q No Changes

2018 PBMAS Preview: CTE Program Area and Indicator Number CTE #7 Indicator Name CTE Nontraditional Course Completion Rate-Males 2017 PBMAS q q Implement new course list Report Only One year of data available for analysis No RI or SA 2018 PBMAS q Add PL Assignment PL 0 - 40. 0%100% PL 1 - 23. 0%39. 9% PL 2 - 15. 0%22. 9% PL 3 - 0%-14. 9% Implement new q Add PL course list Assignment q Report Only PL 0 - 40. 0%100% q One year of data available for PL 1 - 23. 0%analysis 39. 9% * Two courses removed from Nontraditional for Females 2017, Practicum in Transportation, CTE #8 CTE Nontraditional Course Completion Rate-Females q

PBMAS Data Connections for CTE § Are CTE students graduating? Dropping out? § How are your CTE students performing on EOC tests? § Collaborate with core teachers to determine standards where students are struggling. § Do CTE courses address similar standards? § Determine strategies to make connections. § What can CTE teachers do to provide support to students taking EOC tests? § Are students taking and completing nontraditional courses? Why or why not? Are there barriers in place?

EVERY STUDENT SUCCEEDS ACT
: Title I, Part A STAAR 3")
Every Student Succeeds Act § ESSA Indicator #1(i-v): Title I, Part A STAAR 3 -8 Passing Rate § ESSA Indicator #2(i-iv): Title I, Part A STAAR EOC Passing Rate § ESSA Indicator #3: Title I, Part A Annual Dropout Rate (Grades 7 -12) § ESSA Indicator #4: Title I, Part A Graduation Rate § ESSA Indicator #5(i-v): Migrant STAAR 3 -8 Passing Rate § ESSA Indicator #6(i-iv): Migrant STAAR EOC Passing Rate § ESSA Indicator #7: Migrant Annual Dropout Rate (Grades 7 -12) § ESSA Indicator #8: Migrant Graduation Rate
 Additional provisions pertaining")
2018 PBMAS Preview: ESSA Program Area and Indicator Number ESSA #1(i-v) Additional provisions pertaining to this indicator will be covered in the 2018 PBMAS Other System Components preview. Indicator Name Title I, Part A STAAR 3 -8 Passing Rate (M, R, S, SS, W) 2017 PBMAS Add SA q Three years of data available for analysis q 2018 PBMAS q No Changes
 Additional provisions pertaining")
2018 PBMAS Preview: ESSA Program Area and Indicator Number ESSA #2(i-iv) Additional provisions pertaining to this indicator will be covered in the 2018 PBMAS Other System Components preview. Indicator Name Title I, Part A STAAR EOC Passing Rate (M, S, SS, ELA) 2017 PBMAS Add RI for ELA q Add SA (except ELA) q Three years of data available for analysis (two years for ELA) q 2018 PBMAS There are three years of data available for ELA q Add SA for ELA q

2018 PBMAS Preview: ESSA Program Area and Indicator Number Indicator Name 2017 PBMAS 2018 PBMAS ESSA #3 Title I, Part A Annual Dropout Rate (Grades 7 -12) q No Changes ESSA #4 Title I, Part A Graduation Rate q No Changes
 Additional provisions pertaining")
2018 PBMAS Preview: ESSA Program Area and Indicator Number ESSA #5(i-v) Additional provisions pertaining to this indicator will be covered in the 2018 PBMAS Other System Components preview. Indicator Name Migrant STAAR 3 -8 Passing Rate (M, R, S, SS, W) 2017 PBMAS Add SA q Three years of data available for analysis q 2018 PBMAS q No Changes
 Additional provisions pertaining")
2018 PBMAS Preview: ESSA Program Area and Indicator Number ESSA #6(i-iv) Additional provisions pertaining to this indicator will be covered in the 2018 PBMAS Other System Components preview. Indicator Name Migrant STAAR EOC Passing Rate (M, S, SS, ELA) 2017 PBMAS Add RI for ELA q Add SA (except ELA) q Three years of data available for analysis (two years for ELA) q 2018 PBMAS There are three years of data available for ELA q Add SA for ELA q

2018 PBMAS Preview: ESSA Program Area and Indicator Number Indicator Name 2017 PBMAS 2018 PBMAS ESSA #7 Migrant Annual Dropout Rate (Grades 7 -12) q No Changes ESSA #8 Migrant Graduation Rate q No Changes

SPECIAL EDUCATION

Special Education Compliance Review § Only LEAs assigned a Stage 3 or 4 for their special education program will conduct a compliance review for each PBMAS special education indicator assigned a PL 2 or higher. § Resources are available in ISAM and on the Division of School Improvement webpage to assist LEAs with completing the compliance review. § LEAs retain the compliance review itself and only submit to TEA if requested. However, LEAs at a stages 3 and 4 are required to submit a completed Special Education Compliance Review Summary to the TEA by February 15. § https: //tea. texas. gov/pmi/SPEDmonitoring/

Special Education Compliance Review § For LEAs at any level of staging, if noncompliance is identified during the review process, LEAs will develop a Corrective Action Plan (CAP) which outlines the activities/steps the LEA will take to correct all substantiated findings of noncompliance, to include that: § policies and procedures, including operating guidelines and practices are reviewed and revised, as necessary; § professional development is provided to identified staff; § admission, review, and dismissal (ARD) committee meetings are convened to address the noncompliance, and, when required, determine if the noncompliance denied students a free appropriate public education (FAPE), and consider compensatory services, as appropriate; and § develop and engage in monitoring activities to ensure ongoing compliance. § The LEA is required to correct any finding of noncompliance as soon as possible, but in no case, may the correction take longer than one calendar year from the date of notification of
: SPED STAAR 3 -8 Passing Rate § SPED")
Special Education § SPED Indicator #1(i-v): SPED STAAR 3 -8 Passing Rate § SPED Indicator #2(i-v): SPED Year-After-Exit (YAE) STAAR 3 -8 Passing Rate § SPED Indicator #3(i-iv): SPED STAAR EOC Passing Rate § SPED Indicator #4: SPED STAAR Alternate 2 Participation Rate § SPED Indicator #5: SPED Annual Dropout Rate (Grades 7 -12) § SPED Indicator #6: SPED Graduation Rate § SPED Indicator #7: SPED Regular Early Childhood Program Rate (Ages 3 -5) § SPED Indicator #8: SPED Regular Class ≥ 80% Rate (Ages 6 -21)

Special Education Continued § SPED Indicator #9: SPED Regular Class ˂40% Rate (Ages 6 -21) § SPED Indicator #10: SPED Separate Settings Rate (Ages 6 -21) § SPED Indicator #11: SPED Representation (Ages 3 -21) § SPED Indicator #12: SPED OSS and Expulsion ≤ 10 Days Rate (Ages 3 -21) § SPED Indicator #13: SPED OSS and Expulsion >10 Days Rate (Ages 3 -21) § SPED Indicator #14: SPED ISS ≤ 10 Days Rate (Ages 3 -21) § SPED Indicator #15: SPED ISS >10 Days Rate (Ages 3 -21) § SPED Indicator #16: SPED Total Disciplinary Removals Rate (Ages 3 -21)
 Additional provisions pertaining")
2018 PBMAS Preview: SPED Program Area and Indicator Number SPED #1(i-v) Additional provisions pertaining to this indicator will be covered in the 2018 PBMAS Other System Components preview. Indicator Name SPED STAAR 3 -8 Passing Rate (M, R, S, SS, W) 2017 PBMAS Add SA q Three years of data available for analysis q 2018 PBMAS q No Changes
 Additional provisions pertaining")
2018 PBMAS Preview: SPED Program Area and Indicator Number SPED #2(i-v) Additional provisions pertaining to this indicator will be covered in the 2018 PBMAS Other System Components preview. Indicator Name SPED YAE STAAR 3 -8 Passing Rate (M, R, S, SS, W) 2017 PBMAS Add SA q Three years of data available for analysis q 2018 PBMAS q No Changes
 Additional provisions pertaining")
2018 PBMAS Preview: SPED Program Area and Indicator Number SPED #3(i-iv) Additional provisions pertaining to this indicator will be covered in the 2018 PBMAS Other System Components preview. Indicator Name SPED STAAR EOC Passing Rate (M, S, SS, ELA) 2017 PBMAS Add RI for ELA q Add SA (except ELA) q Three years of data available for analysis (two years for ELA) q 2018 PBMAS There are three years of data available for ELA q Add SA for ELA q

2018 PBMAS Preview: SPED Program Area and Indicator Number SPED #4 Indicator Name SPED STAAR Alternate 2 Participation Rate 2017 PBMAS q No Changes 2018 PBMAS q No Changes

2018 PBMAS Preview: SPED Program Area and Indicator Number SPED #5 Additional provisions pertaining to this indicator will be covered in the 2018 PBMAS Other System Components preview. Indicator Name SPED Annual Dropout Rate 2017 PBMAS q No Changes 2018 PBMAS q No Changes

2018 PBMAS Preview: SPED Program Area and Indicator Number SPED #6 Additional provisions pertaining to this indicator will be covered in the 2018 PBMAS Other System Components preview. Indicator Name SPED Graduation Rate 2017 PBMAS q No Changes 2018 PBMAS q No Changes

2018 PBMAS Preview: SPED Program Area and Indicator Number SPED #7 Additional provisions pertaining to this indicator will be covered in the 2018 PBMAS Other System Components preview. Indicator Name Regular Early Childhood Rate (Ages 3 -5) 2017 PBMAS q Three years of data available for analysis 2018 PBMAS There are three years of data available q Add SA q

2018 PBMAS Preview: SPED Program Area and Indicator Number SPED #8 Additional provisions pertaining to this indicator will be covered in the 2018 PBMAS Other System Components preview. Indicator Name SPED Regular Class ≥ 80% Rate (Ages 6 -21) 2017 PBMAS Add RI q Discontinue SD RO by race/ethnicity q Two years of data available for analysis q 2018 PBMAS q There are three years of data available q Add SA

2018 PBMAS Preview: SPED Program Area and Indicator Number SPED #9 Indicator Name SPED Regular Class <40% Rate (Ages 6 -21) 2017 PBMAS q q q SPED #10 SPED Separate Settings Rate (Ages 6 -21) q q q 2018 PBMAS Revise the indicator based on final federal regulations under 34 CFR Part 300, issued by USDE on December 19, 2016 Assign SD Year 1 PLs based on race/ethnicity Add RI to overall component, where two years of data are available q New indicator required by final federal regulations under 34 CFR Part 300, issued by USDE on December 19, 2016 Assign SD Year 1 PLs based on race/ethnicity Overall component is Report Only q q There are three years of data available Add SA to overall component Report Only to the overall component (continued)

2018 PBMAS Preview: SPED Program Area and Indicator Number SPED #11 Additional provisions pertaining to this indicator will be covered in the 2018 PBMAS Other System Components preview. Indicator Name SPED Representation (Ages 3 -21) 2017 PBMAS One integrated indicator based on final federal regulations under 34 CFR Part 300, issued by USDE on December 19, 2016 q Assign SD Year 1 PLs based on race/ethnicity and disability category q 2018 PBMAS q No Changes

2018 PBMAS Preview: SPED Program Area and Indicator Number SPED #12 Indicator Name SPED OSS and Expulsion ≤ 10 Days Rate (Ages 3 -21) 2017 PBMAS q Previewed in DDV 2018 PBMAS Previously previewed in 2017 DDV q Add overall PL assignment as Report Only q *Indicators #12 -16 were previewed in DDV during the fall 2017. Due to the U. S. Department of Education Proposed Delay of Regulations 20 U. S. C. 1418(d) and 34 CFR 300. 646 and §§ 300. 647 SD Implementation from July 1, 2018 to July 1, 2020, PBMAS will assign overall Report Only.

2018 PBMAS Preview: SPED Program Area and Indicator Number SPED #13 Indicator Name SPED OSS and Expulsion >10 Days Rate (Ages 3 -21) 2017 PBMAS q Previewed in DVM 2018 PBMAS Previously previewed in 2017 DDV q Add overall PL assignment as Report Only q

2018 PBMAS Preview: SPED Program Area and Indicator Number SPED #14 Indicator Name SPED ISS ≤ 10 Days Rate (Ages 3 -21) 2017 PBMAS q Previewed in DDV 2018 PBMAS Previously previewed in 2017 DDV q Add overall PL assignment as Report Only q

2018 PBMAS Preview: SPED Program Area and Indicator Number SPED #15 Indicator Name SPED ISS > 10 Days Rate (Ages 3 -21) 2017 PBMAS q Previewed in DDV 2018 PBMAS Previously previewed in 2017 DDV q Add overall PL assignment as Report Only q

2018 PBMAS Preview: SPED Program Area and Indicator Number SPED #16 Indicator Name SPED Total Disciplinary Removal Rate (Ages 3 -21) 2017 PBMAS q Previewed in DDV 2018 PBMAS Previously previewed in 2017 DDV q Add overall PL assignment as Report Only q

OTHER SYSTEM COMPONENTS

2018 PBMAS Preview: Other System Components Program Area Description 2017 PBMAS 2018 PBMAS Other System Components Required Improvement Calculation q No Changes Other System Components CTE Tech Prep Status q The CTE Tech Prep code 3 was discontinued in the 2016 -2017 Texas Student Data System (TSDS); however, was available on the 2016 -2017 STAAR EOC answer documents. Included in the accountable district’s q The CTE Tech Prep code 3 was discontinued in the 2016 -2017 Texas Student Data System (TSDS); however, was available on the Summer 2017 STAAR EOC answer documents. Included in the accountable district’s

2018 PBMAS Preview: Other System Components Program Area Other System Components Description Format of Performance Levels 2017 PBMAS q 2017 available Performance Levels were ND, NA DI, NA SA, 0, 0 RI, 0 SA, 1, 1 SA, 2, 2, SA, 3, 3 SA, 4, 4 SA, Report Only and SD (Year 1) 2018 PBMAS q Add SD (Year 2)

ENGAGING IN CONTINUOUS IMPROVEMENT

Continuous Improvement Process Data Analysis Root Cause Analysis Strategy Selection and Planning Implementation and Monitoring

FOCUSED DATA ANALYSIS

Data Analysis § Analyze data for each PBMAS indicator with a PL of 2 or higher and/or an area of noncompliance of a FRE. § Identify specific campuses contributing to areas of low performance or noncompliance and target those campuses for interventions. § Use multiple data sources to examine areas that may have an impact. § Identify why a campus did not meet standard and where the performance gaps are § Write data-driven problem statements and annual goals on which to base improvement planning

Key Idea Analyzing data first tells us where we are now and how much we need to do to get to where we want to go.

Key Idea When looking at data evaluate by: § content area § grade level § teacher level § student group ……. to uncover where performance gaps really are.

A district report such as PBMAS is made up of data from campuses. Districts must understand this relationship.
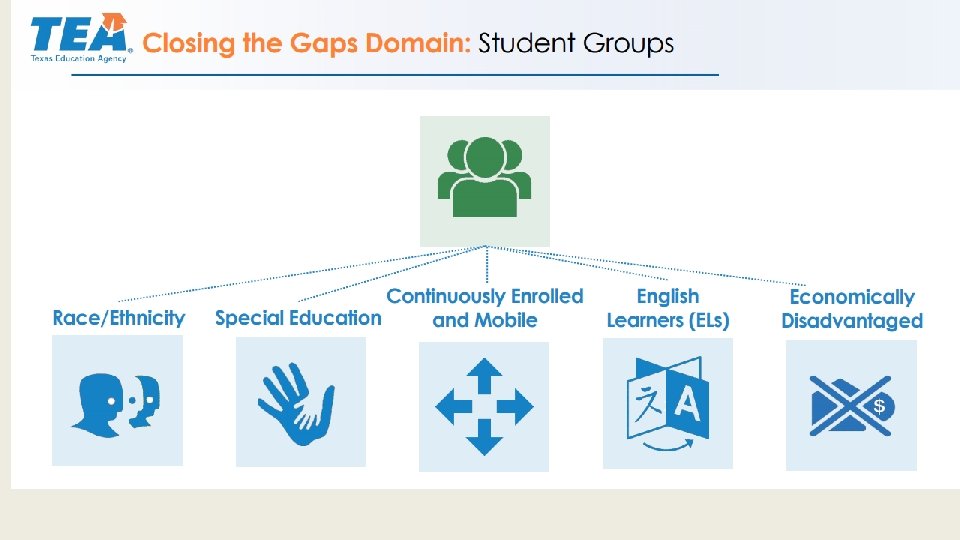

ELA/READING & MATH ONLY Targets are different for different student groups!

First table shows TARGETS & whether you met them or not Second table shows YOUR data

ESSA Indicators Trend Data Must Address

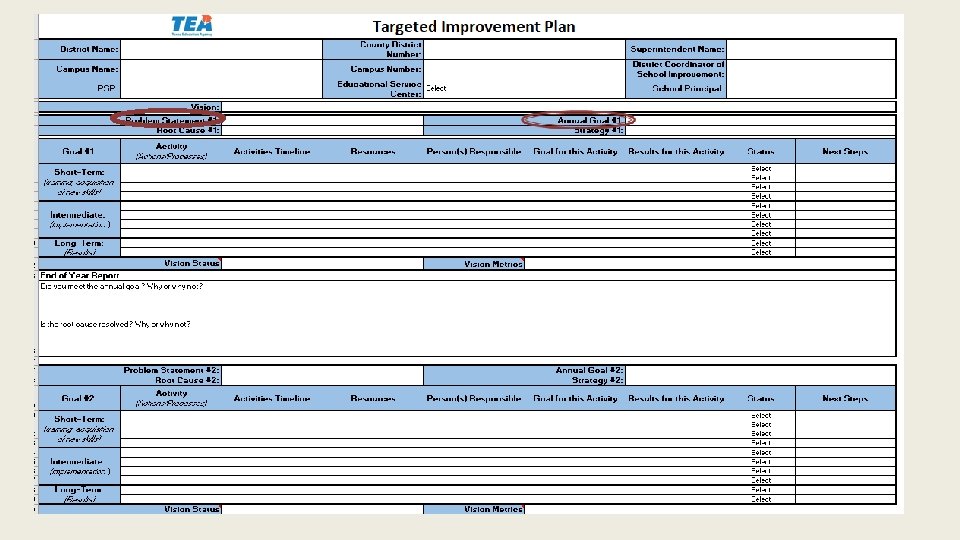
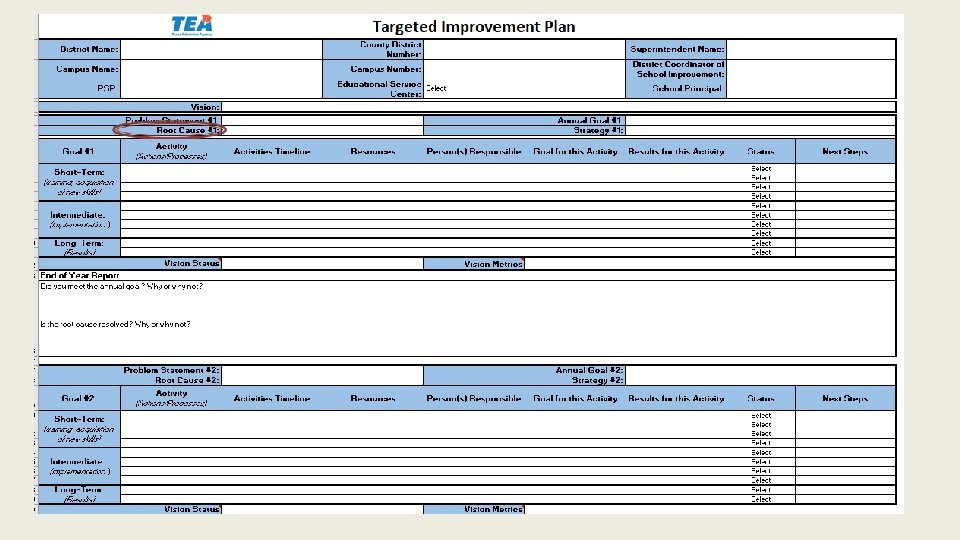
Problem Statement Development § Use data analysis to determine what problems exist that are contributing to the ineffective program areas. § A problem statement should: § capture “where the LEA or program is” compared to “where the LEA or program wants to be” § Be concise and objective § Not assign causation § Example: § The district received a PL of 3 in SS for the 2018, 3 -8 STAAR for ESSA Students. § The district scored 40% in SS at the Meets Grade Level performance on the 3 -8 STAAR in 2018.

Annual Goal § Annual goals should be aligned to the Closing the Gaps domain in the accountability system. § An annual goal should: § capture “where the LEA or program is” compared to “where the LEA or program wants to be” Use the quadrant § Be specific template provided to § Be measurable record your problem § Example: statement and annual goal. § The district will achieve a PL of 0 in SS on the 2019 PBMAS report. § The district will achieve 65% in SS and 70% in Writing on the 2019, 3 -8 STAAR for ESSA students.

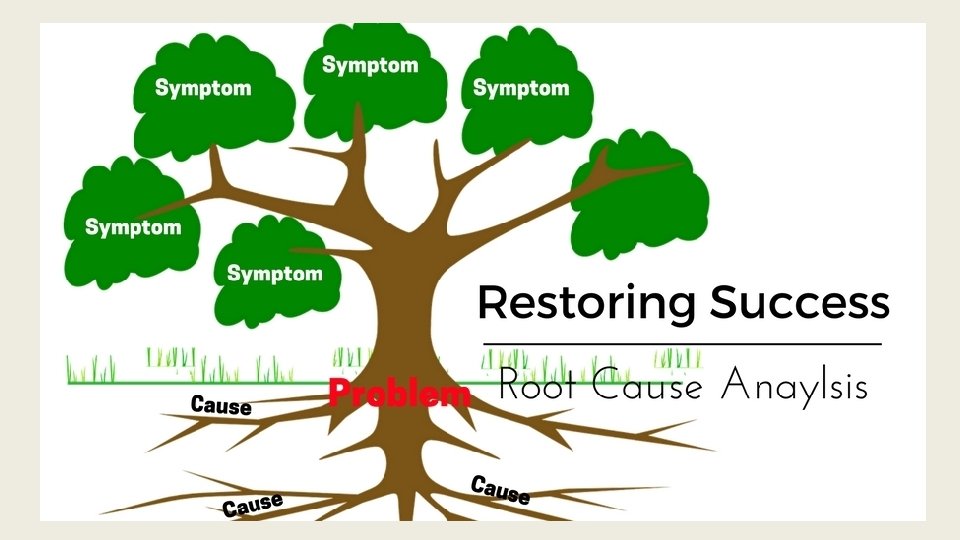
GUIDED ROOT CAUSE ANALYSIS Tracy Patrick

Key Idea We analyze root causes so we can identify the real reason we are underperforming and select a strategy that creates sustainable gains in student achievement. updated 8/13/18

Objectives § Engage in guided dialogue with stakeholder groups to brainstorm possible root causes § Validate and prioritize root causes updated 8/13/18

NEEDS ASSESSMENT

Key Idea We set ourselves up for successful planning when we invite a variety of stakeholders to the table to have a guided discussion and prioritize root causes. updated 8/13/18

What you will need….

How to Use the Guided Discussion Tool Under each topic: § Start with the first element and GO IN ORDER. Determine if your campus does that element consistently and with fidelity. § If yes, provide evidence or artifacts to validate. Continue to the next element. § If your answer is no, write the question on the Guided Discussion Documentation sheet, and then move to the next topic. § Repeat for each topic. updated 8/13/18

Key Idea The 5 whys help us identify the barriers that prevent us from implementing systems and processes. updated 8/13/18

The Guided 5 Whys Ask and answer “why” 5 times for the question you stopped at. The first 2 why questions are set for you! § Example: § Under teaching and learning, our first NO answer was to “Campus instructional leaders have consistent, documented expectations for maximizing instructional time and delivering effective instruction. ” 1. Why wasn’t this system/process implemented? Because we want teachers to work 2. 3. 4. 5. with their own style of instruction. Why didn’t we achieve success when we let teachers work with their own style of instruction? Because our teachers were inconsistent with the quality and rigor of instruction. Why were teachers inconsistent? Because we didn’t monitor quality and rigor consistently. Why didn’t we monitor consistently? Because we didn’t establish a system for observations and feedback that worked with our schedule. Why didn’t we create this system? Because we did not prioritize it. updated 8/13/18

Guided 5 Whys Reflection § Of the barriers you identify in the because statements: § Which are due to mindsets? § Which are due to action (or inaction)? § Which are due to resources? updated 8/13/18

Determine which root cause has the highest leverage.

Key Idea Removing barriers and ensuring that the conditions exist for campus improvement is one of the key responsibilities of the District Coordinator of School Improvement. updated 8/13/18

Writing a Root Cause Statement The root cause statement should: § identify the system or process that was missing that led to low performance § identify one or more key barriers that kept that system or process from being implemented Example: Campus instructional leaders did not create consistent, documented expectations for delivering effective instruction because we prioritized teacher autonomy over student outcomes. updated 8/13/18

ALIGNED STRATEGY IDENTIFICATION Kara Fluty

Key Idea The best strategies are those that are aligned and scaffolded to the root cause of low performance. updated 8/13/18

Objectives § Identify the highest lever strategies that directly align with the root cause and address the source of performance gaps § Prioritize strategies in a scaffolded and sequenced manner updated 8/13/18

What good strategy consist of: • Three to five strategies that outline the big areas of focus—i. e. , what’s going to drive improvement • A series of strategic initiatives with each bet that identifies the specific ways to make that bet a reality in practice • Can fit on one page! • But how do you choose what to land on? . . .

Strategies to Consider ● Evidence for ESSA - https: //www. evidenceforessa. org/ ● What Works Clearinghouse ● TEA Strategic Priorities building-initiative/tea-priorities/ ● https: //ies. ed. gov/ncee/wwc/ https: //www. region 10. org/programs/title-i-capacity- ESSA - Using Evidence-Based Practices to Better Student Outcomes - https: //www. region 10. org/programs/title-i-capacity-building-initiative/essasupport/evidence-based/

Problem Statement and Annual Goal Review Problem Statement Root Cause Annual Goal

Linking the strategy to the root cause Problem Statement: Annual Goal: Students who are English Language learners have Language learners will a 60% pass rate in have a 70% pass rate in reading. …because… Root Cause Strategy

Linking the strategy to the root cause Problem Statement: Annual Goal: Students who are English Language learners have Language learners will a 60% pass rate in have a 70% pass rate in reading. …because… Root Cause: Administrators were not holding teachers accountable for implementing language strategies. Strategy

Selecting a strategy Problem Statement: Annual Goal: Students who are English Language learners have Language learners will a 60% pass rate in have a 70% pass rate in reading. …because… Root Cause: Administrators were not holding teachers accountable for implementing language strategies. Strategy: Broad approach

Selecting the Strategy § What’s the impact on student learning? § What’s the ease of implementation?

 necessary to effectively implement")
Objectives • Identify the action steps (in the proper sequence) necessary to effectively implement the aligned strategy • Determine what resources are needed to conduct those action steps (personnel, materials, time) • Assign roles and responsibilities for implementation and monitoring • Establish metrics, milestones, and evidence of implementation fidelity that will measure progress at critical times through the school year updated 8/13/18

Key Idea A strategy is only effective if the implementation plan is well-written with: • Measurable outcomes • Accountability for all stakeholders updated 8/13/18

Practice: Writing an Implementation Plan Problem Statement teacher induction practices, and our new teachers struggled. Root Cause 75% of 5 th graders did not meet grade level in math because we failed to adhere to Strategy We will develop and monitor a year-long teacher orientation program in which master teachers and instructional coaches will provide 1: 1 coaching for new teachers so that we can reduce the number of 5 th grade students who did not meet grade level in math by 20%. Annual Goal updated 8/13/18

Key Idea The actions are the skeleton of the plan and must include: • Training for all staff • Observations and feedback on training implementation • A way to measure student progress updated 8/13/18

Actions Required § List actions required to implement each strategy. § Are these actions short term, intermediate, or long term? § Who will be responsible for this action? § What resources will be needed?

Key Idea A plan only works if everyone knows what they need to do and if they are held accountable for doing it. updated 8/13/18

Key Idea Goals measure results; they don’t check off whether an action was completed. updated 8/13/18

Make Sure Your Goal is S. M. A. R. T. § Each goal should be: Specific, Measurable, Attainable, Relevant and Time-bound. § Identify a goal for each activity.

Implementation

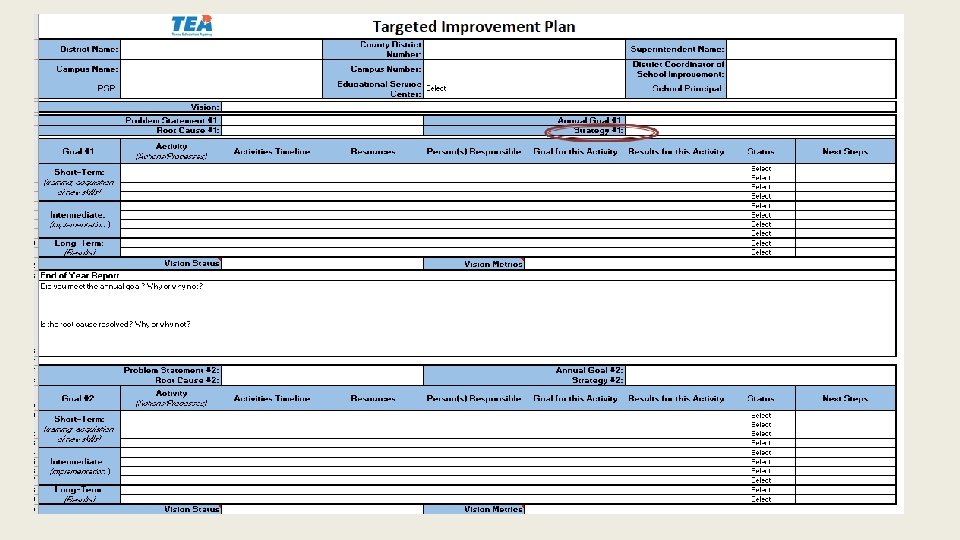
Reminders § If you are already engaging in the continuous improvement process for Accountability purposes, you may adjust the targeted improvement plan that you have developed to include all components required to meet the minimum criteria(s) of the intervention activities. § Districts can complete a targeted improvement plan using the template of your choice. No parameters will be given regarding which template to use during the 2018 -19 monitoring activities.

TEA Contact § For questions about the PBMAS manual or the indicators described in the manual, please contact: § Performance-Based Monitoring § (512) 936 -6426 § pbm@tea. texas. gov
- Slides: 116