Performance Tools Jeff Kiel Manager Developer Performance Tools


- Slides: 37

Performance Tools Jeff Kiel Manager, Developer Performance Tools

Performance Tools Agenda Overview of GPU pipeline and Unified Shader NVIDIA Perf. Kit 5. 0: Driver & GPU Performance Data Instrumented Driver: GPU & driver performance information, GLExpert runtime debugging Perf. SDK: Performance data integrated into your application Perf. HUD: The Direct 3 D GPU Performance Accelerator g. DEBugger: Open. GL performance analysis and debugging Shader. Perf: Shader program performance © NVIDIA Corporation 2007

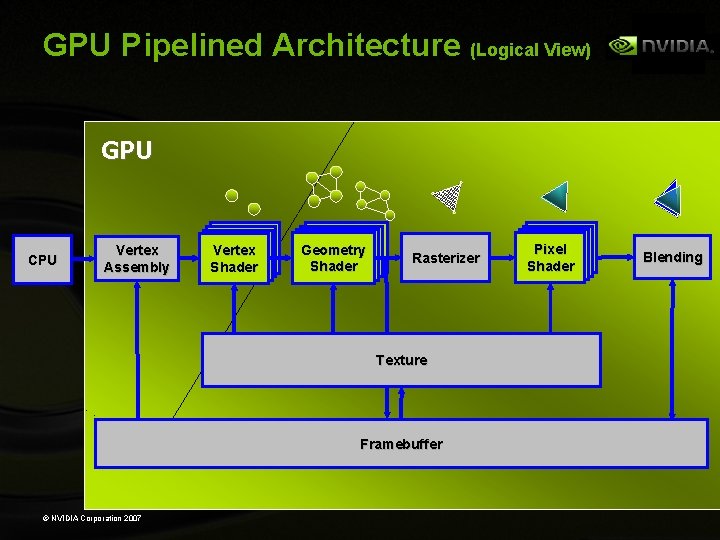
GPU Pipelined Architecture (Logical View) GPU CPU Vertex Assembly Vertex Shader Vertex Geometry Shader Rasterizer Texture Framebuffer © NVIDIA Corporation 2007 Vertex Pixel Shader Blending

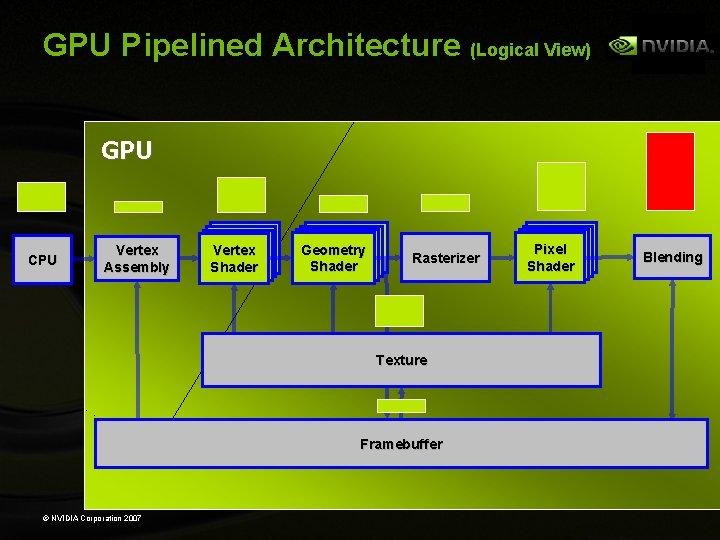
GPU Pipelined Architecture (Logical View) GPU CPU Vertex Assembly Vertex Shader Vertex Geometry Shader Rasterizer Texture Framebuffer © NVIDIA Corporation 2007 Vertex Pixel Shader Blending

Common Graphics/GPU Problems New, increasingly complex GPU hardware GPU is a black box Unified shaders changes everything Increasing engine and scene complexity Artists don’t always understand how rendering engines work CPU tuning insufficient (multiple processors, multi-cores) Turn around time for debugging and tuning shaders too long Hard to debug API/pipeline setup issues © NVIDIA Corporation 2007

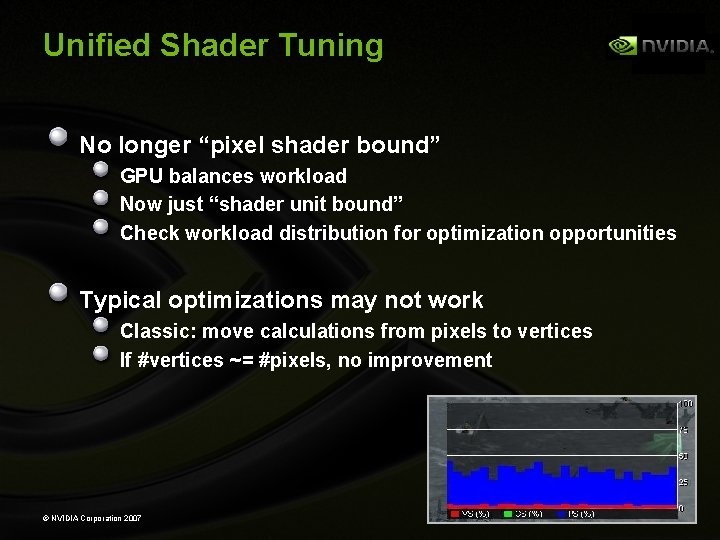
Unified Shader Tuning No longer “pixel shader bound” GPU balances workload Now just “shader unit bound” Check workload distribution for optimization opportunities Typical optimizations may not work Classic: move calculations from pixels to vertices If #vertices ~= #pixels, no improvement © NVIDIA Corporation 2007

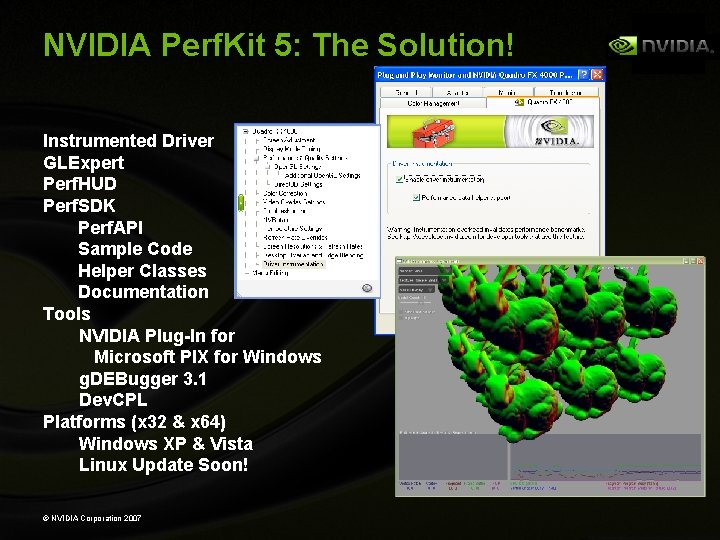
NVIDIA Perf. Kit 5: The Solution! Instrumented Driver GLExpert Perf. HUD Perf. SDK Perf. API Sample Code Helper Classes Documentation Tools NVIDIA Plug-In for Microsoft PIX for Windows g. DEBugger 3. 1 Dev. CPL Platforms (x 32 & x 64) Windows XP & Vista Linux Update Soon! © NVIDIA Corporation 2007

Perf. Kit Instrumented Driver GLExpert functionality GPU and Driver Performance Counters Open. GL and Direct 3 D Data exported via NVIDIA API and PDH Simplified Experiments (Sim. Exp) Collect GPU and driver data, retain performance Track intra-frame events & statistics Gather and collate at end of frame Performance overhead 1 -2% © NVIDIA Corporation 2007

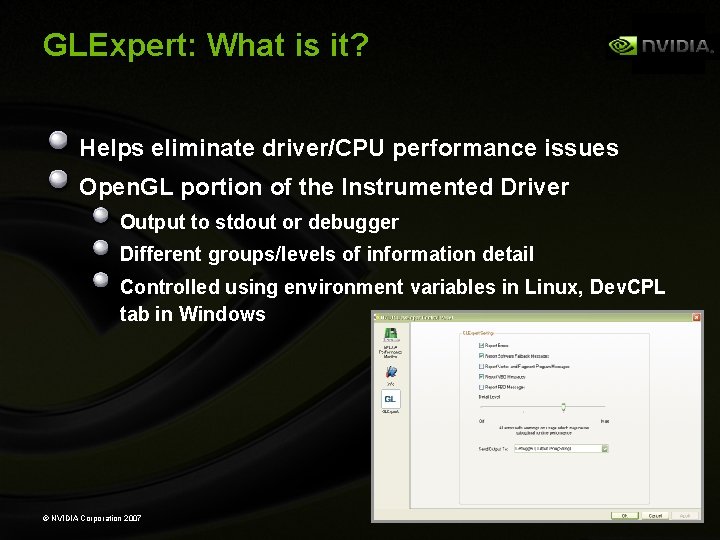
GLExpert: What is it? Helps eliminate driver/CPU performance issues Open. GL portion of the Instrumented Driver Output to stdout or debugger Different groups/levels of information detail Controlled using environment variables in Linux, Dev. CPL tab in Windows © NVIDIA Corporation 2007

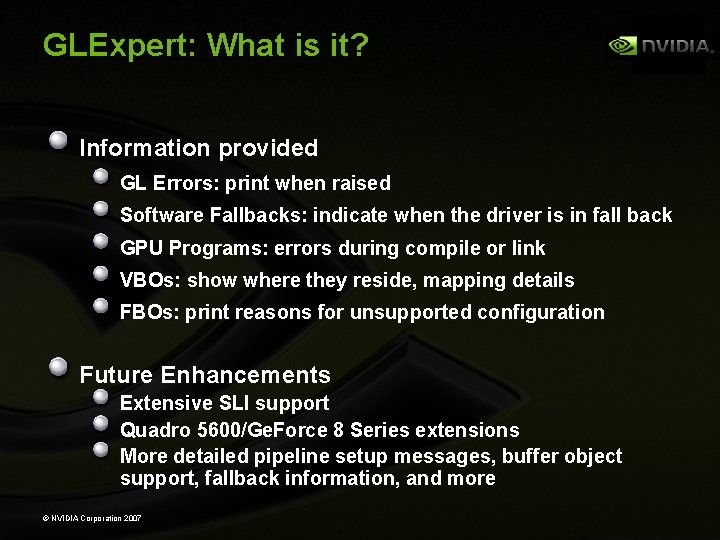
GLExpert: What is it? Information provided GL Errors: print when raised Software Fallbacks: indicate when the driver is in fall back GPU Programs: errors during compile or link VBOs: show where they reside, mapping details FBOs: print reasons for unsupported configuration Future Enhancements Extensive SLI support Quadro 5600/Ge. Force 8 Series extensions More detailed pipeline setup messages, buffer object support, fallback information, and more © NVIDIA Corporation 2007

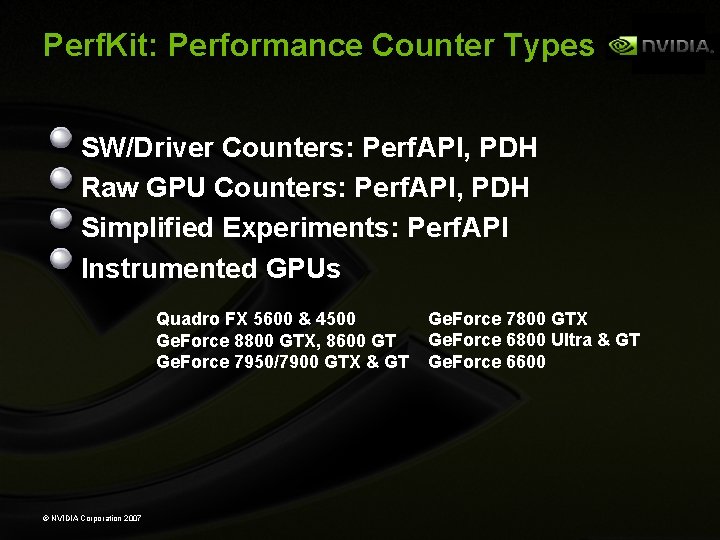
Perf. Kit: Performance Counter Types SW/Driver Counters: Perf. API, PDH Raw GPU Counters: Perf. API, PDH Simplified Experiments: Perf. API Instrumented GPUs Quadro FX 5600 & 4500 Ge. Force 8800 GTX, 8600 GT Ge. Force 7950/7900 GTX & GT © NVIDIA Corporation 2007 Ge. Force 7800 GTX Ge. Force 6800 Ultra & GT Ge. Force 6600

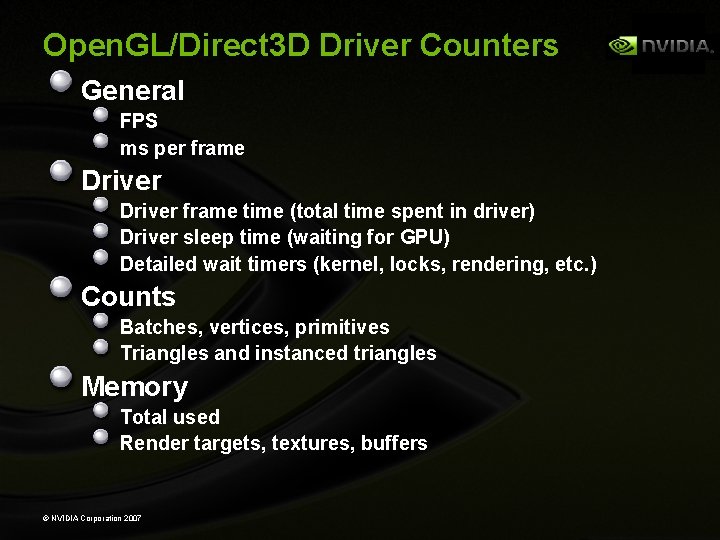
Open. GL/Direct 3 D Driver Counters General FPS ms per frame Driver frame time (total time spent in driver) Driver sleep time (waiting for GPU) Detailed wait timers (kernel, locks, rendering, etc. ) Counts Batches, vertices, primitives Triangles and instanced triangles Memory Total used Render targets, textures, buffers © NVIDIA Corporation 2007

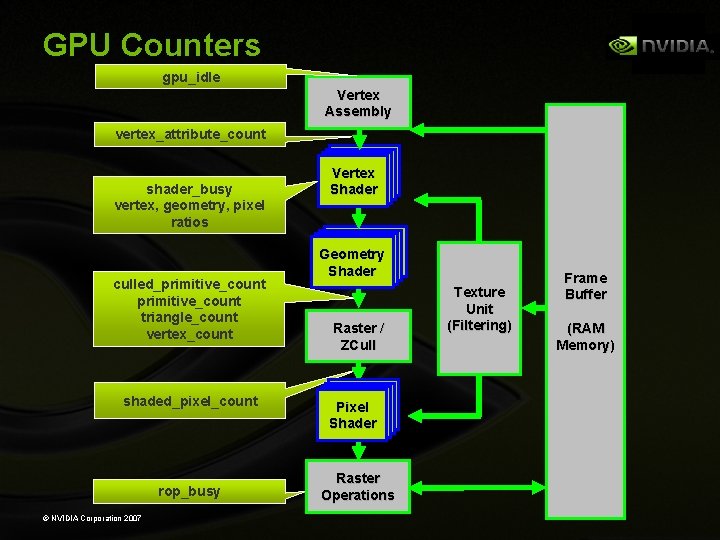
GPU Counters gpu_idle Vertex Assembly vertex_attribute_count shader_busy vertex, geometry, pixel ratios culled_primitive_count triangle_count vertex_count shaded_pixel_count rop_busy © NVIDIA Corporation 2007 Vertex Shader Vertex Geometry Shader Raster / ZCull Vertex Pixel Shader Raster Operations Texture Unit (Filtering) Frame Buffer (RAM Memory)

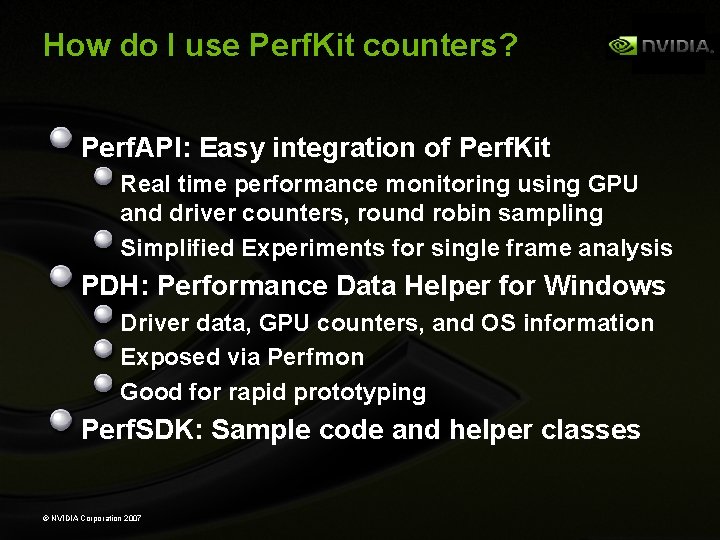
How do I use Perf. Kit counters? Perf. API: Easy integration of Perf. Kit Real time performance monitoring using GPU and driver counters, round robin sampling Simplified Experiments for single frame analysis PDH: Performance Data Helper for Windows Driver data, GPU counters, and OS information Exposed via Perfmon Good for rapid prototyping Perf. SDK: Sample code and helper classes © NVIDIA Corporation 2007

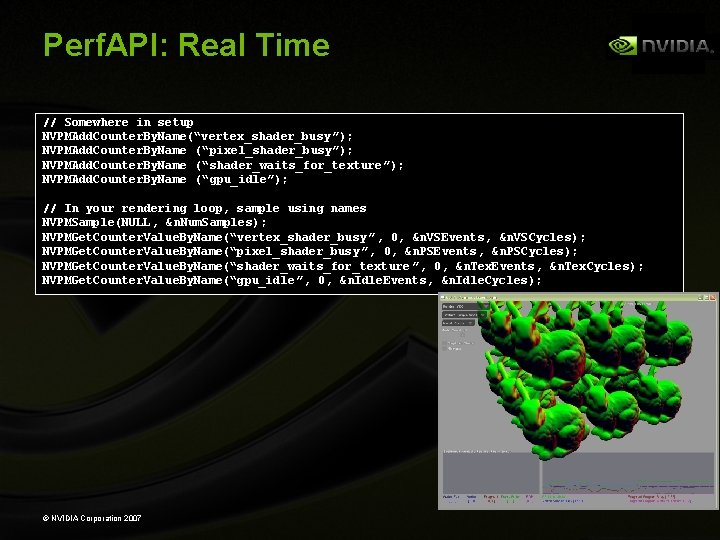
Perf. API: Real Time // Somewhere in setup NVPMAdd. Counter. By. Name(“vertex_shader_busy ”); NVPMAdd. Counter. By. Name (“pixel_shader_busy”); NVPMAdd. Counter. By. Name (“shader_waits_for_texture ”); NVPMAdd. Counter. By. Name (“gpu_idle”); // In your rendering loop, sample using names NVPMSample(NULL, &n. Num. Samples); NVPMGet. Counter. Value. By. Name(“vertex_shader_busy ”, 0, &n. VSEvents, &n. VSCycles); NVPMGet. Counter. Value. By. Name(“pixel_shader_busy ”, 0, &n. PSEvents, &n. PSCycles); NVPMGet. Counter. Value. By. Name(“shader_waits_for_texture ”, 0, &n. Tex. Events, &n. Tex. Cycles); NVPMGet. Counter. Value. By. Name(“gpu_idle ”, 0, &n. Idle. Events, &n. Idle. Cycles); © NVIDIA Corporation 2007

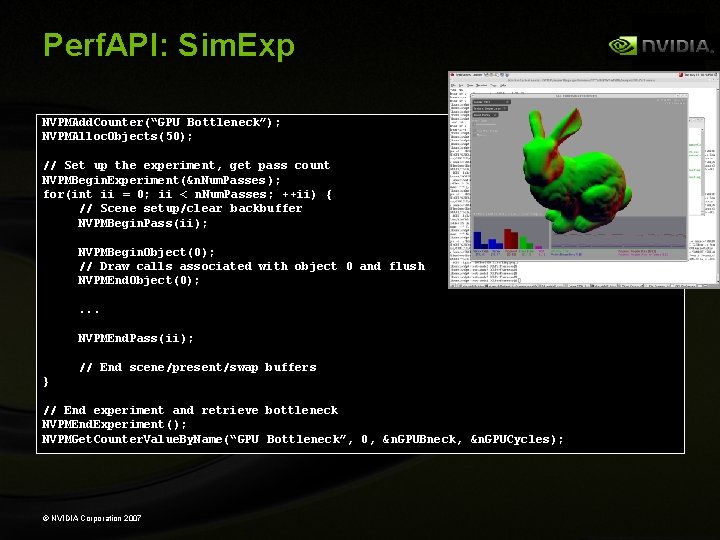
Perf. API: Sim. Exp NVPMAdd. Counter(“GPU Bottleneck”); NVPMAlloc. Objects(50); // Set up the experiment, get pass count NVPMBegin. Experiment(&n. Num. Passes ); for(int ii = 0; ii < n. Num. Passes; ++ii) { // Scene setup/clear backbuffer NVPMBegin. Pass(ii); NVPMBegin. Object(0); // Draw calls associated with object 0 and flush NVPMEnd. Object(0); . . . NVPMEnd. Pass(ii); // End scene/present/swap buffers } // End experiment and retrieve bottleneck NVPMEnd. Experiment(); NVPMGet. Counter. Value. By. Name(“GPU Bottleneck”, 0, &n. GPUBneck, &n. GPUCycles); © NVIDIA Corporation 2007

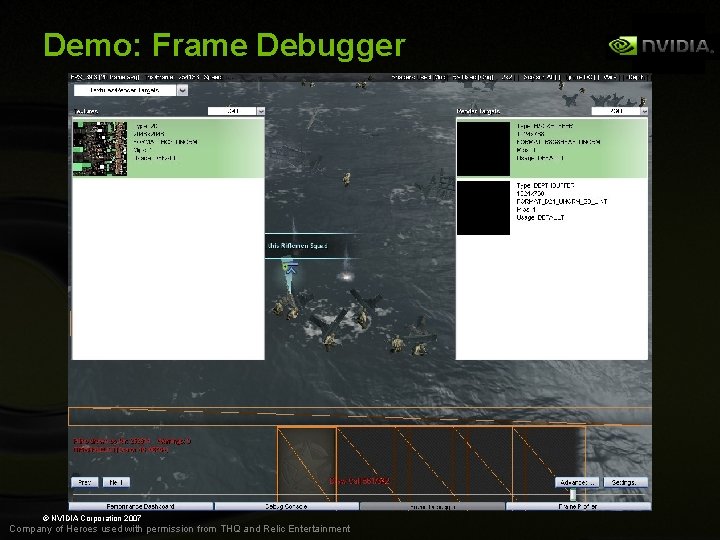
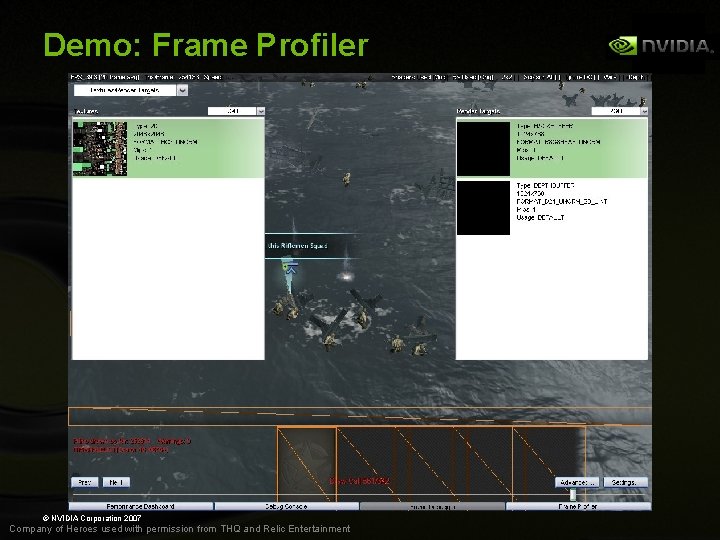
Perf. HUD: Direct 3 D debugging and tuning One click bottleneck determination Graphs and debugging tools overlaid on your application 4 screens for targeted analysis Performance Dashboard Debug Console Frame Debugger Frame Profiler Drag and drop application on Perf. HUD icon © NVIDIA Corporation 2007

New! Perf. HUD 5. 0! Interactive model Shader Edit and Continue Render state Modification Configurable Graphs Many more features and usability improvements New technologies Windows Vista & Direct. X 10 Quadro 5600 and Ge. Force 8800 with Unified Shader Architecture © NVIDIA Corporation 2007

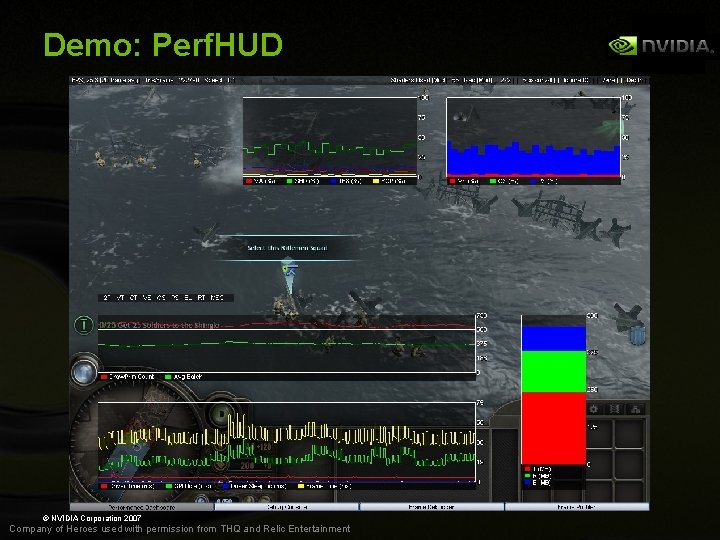
Demo: Perf. HUD © NVIDIA Corporation 2007 Company of Heroes used with permission from THQ and Relic Entertainment

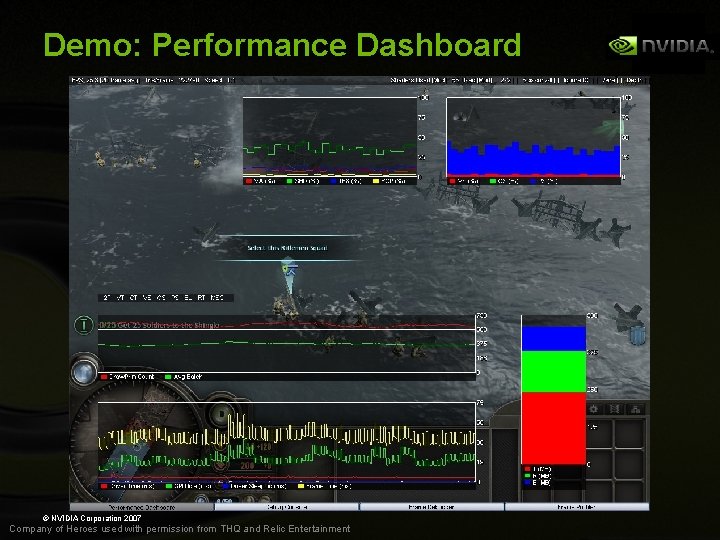
Demo: Performance Dashboard © NVIDIA Corporation 2007 Company of Heroes used with permission from THQ and Relic Entertainment

Demo: Performance Dashboard © NVIDIA Corporation 2007 Company of Heroes used with permission from THQ and Relic Entertainment

Demo: Performance Dashboard © NVIDIA Corporation 2007 Company of Heroes used with permission from THQ and Relic Entertainment

Demo: Frame Debugger © NVIDIA Corporation 2007 Company of Heroes used with permission from THQ and Relic Entertainment

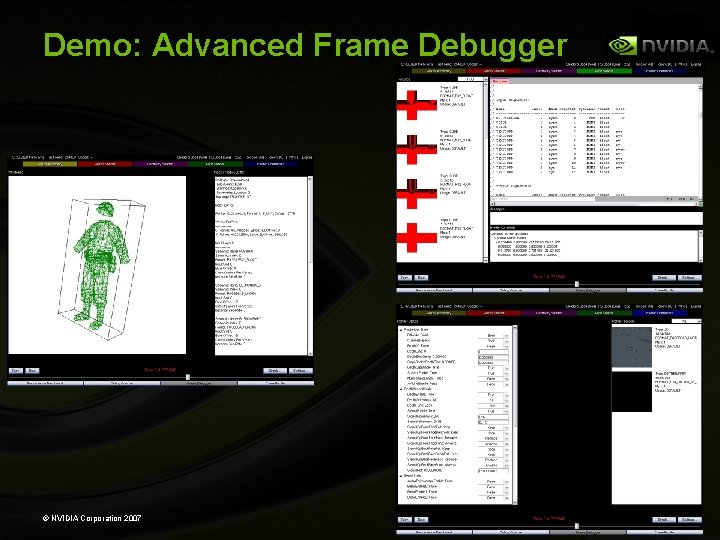
Demo: Advanced Frame Debugger © NVIDIA Corporation 2007

Demo: Frame Profiler © NVIDIA Corporation 2007 Company of Heroes used with permission from THQ and Relic Entertainment

Frame Profiler One Touch Performance Analysis Perf. HUD uses Perf. SDK Multiple passes on the scene, sample over 40 performance counters Need to render THE SAME FRAME until all the counters are read Must use time-based animation Do use Query. Performance. Counter() or time. Get. Time() Don’t use RDTSC or throttle frame rate © NVIDIA Corporation 2007

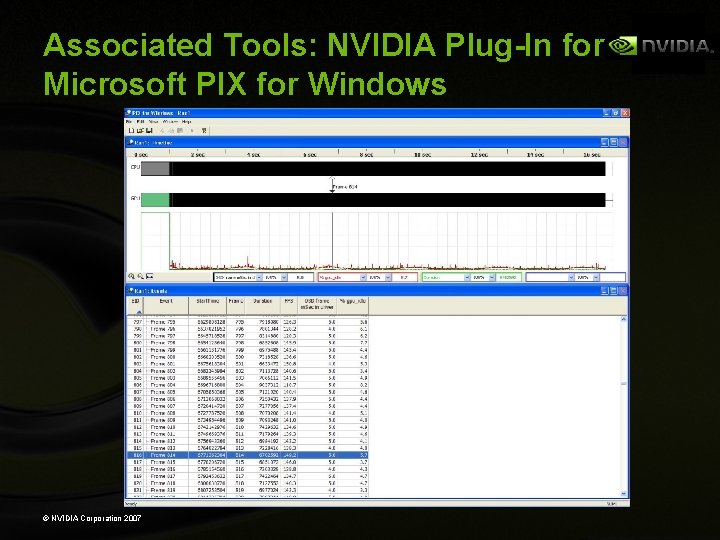
Associated Tools: NVIDIA Plug-In for Microsoft PIX for Windows © NVIDIA Corporation 2007

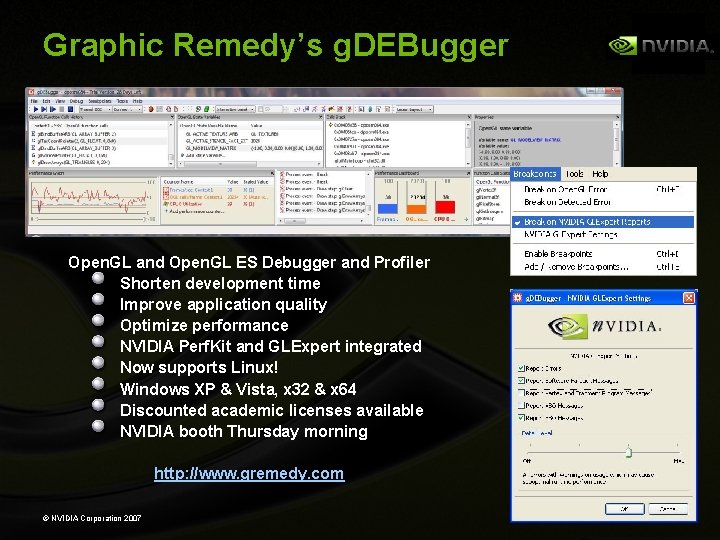
Graphic Remedy’s g. DEBugger Open. GL and Open. GL ES Debugger and Profiler Shorten development time Improve application quality Optimize performance NVIDIA Perf. Kit and GLExpert integrated Now supports Linux! Windows XP & Vista, x 32 & x 64 Discounted academic licenses available NVIDIA booth Thursday morning http: //www. gremedy. com © NVIDIA Corporation 2007

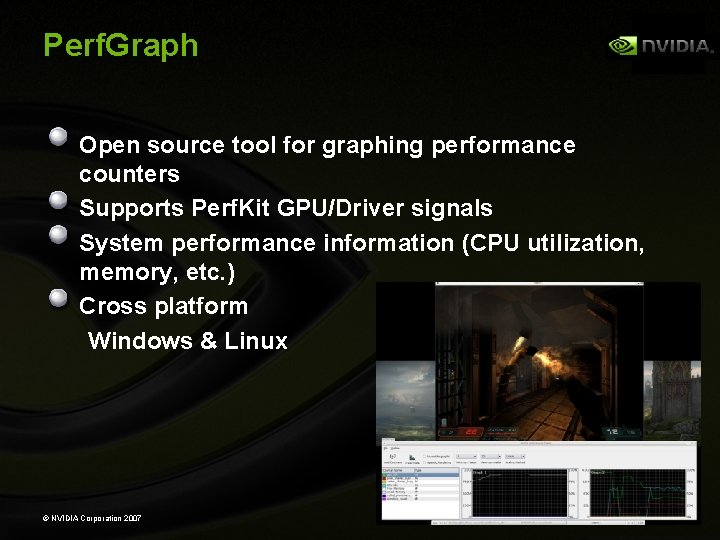
Perf. Graph Open source tool for graphing performance counters Supports Perf. Kit GPU/Driver signals System performance information (CPU utilization, memory, etc. ) Cross platform Windows & Linux © NVIDIA Corporation 2007

Project Status Perf. Kit 5. 0 available now: http: //developer. nvidia. com/perfkit Perf. HUD 5. 0 Force. Ware Release 100 Driver Ge. Force 8800 support Windows XP & Vista, 32 and 64 bit Linux 32 and 64 bit Perf. SDK/GLExpert in development Perf. Graph: www. sourceforge. orgperfgraph Instrumented GPUs Quadro FX 5600 & 4500 Ge. Force 8800 Series Ge. Force 7950/7900 GTX & GT Ge. Force 7800 GTX Ge. Force 6800 Ultra & GT Ge. Force 6600 Feedback and Support: http: //developer. nvidia. com/forums © NVIDIA Corporation 2007

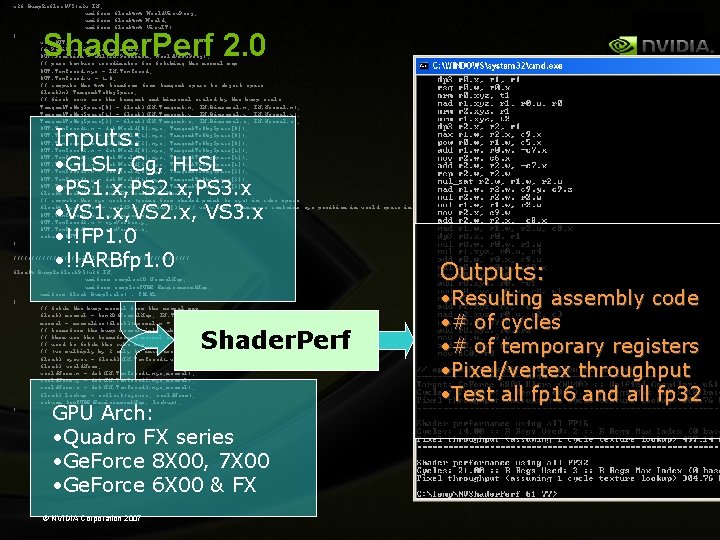
v 2 f Bump. Reflect. VS(a 2 v IN, uniform float 4 x 4 World. View. Proj, uniform float 4 x 4 World, uniform float 4 x 4 View. IT) { v 2 f OUT; // Position in screen space. OUT. Position = mul(IN. Position, World. View. Proj); // pass texture coordinates for fetching the normal map OUT. Tex. Coord. xyz = IN. Tex. Coord; OUT. Tex. Coord. w = 1. 0; // compute the 4 x 4 tranform from tangent space to object space float 3 x 3 Tangent. To. Obj. Space; // first rows are the tangent and binormal scaled by the bump scale Tangent. To. Obj. Space[0] = float 3(IN. Tangent. x, IN. Binormal. x, IN. Normal. x); Tangent. To. Obj. Space[1] = float 3(IN. Tangent. y, IN. Binormal. y, IN. Normal. y); Tangent. To. Obj. Space[2] = float 3(IN. Tangent. z, IN. Binormal. z, IN. Normal. z); OUT. Tex. Coord 1. x = dot(World[0]. xyz, Tangent. To. Obj. Space[0]); OUT. Tex. Coord 1. y = dot(World[1]. xyz, Tangent. To. Obj. Space[0]); OUT. Tex. Coord 1. z = dot(World[2]. xyz, Tangent. To. Obj. Space[0]); OUT. Tex. Coord 2. x = dot(World[0]. xyz, Tangent. To. Obj. Space[1]); OUT. Tex. Coord 2. y = dot(World[1]. xyz, Tangent. To. Obj. Space[1]); OUT. Tex. Coord 2. z = dot(World[2]. xyz, Tangent. To. Obj. Space[1]); OUT. Tex. Coord 3. x = dot(World[0]. xyz, Tangent. To. Obj. Space[2]); OUT. Tex. Coord 3. y = dot(World[1]. xyz, Tangent. To. Obj. Space[2]); OUT. Tex. Coord 3. z = dot(World[2]. xyz, Tangent. To. Obj. Space[2]); float 4 world. Pos = mul(IN. Position, World); // compute the eye vector (going from shaded point to eye) in cube space float 4 eye. Vector = world. Pos - View. IT[3]; // view inv. transpose contains eye position in world space in last row. OUT. Tex. Coord 1. w = eye. Vector. x; OUT. Tex. Coord 2. w = eye. Vector. y; OUT. Tex. Coord 3. w = eye. Vector. z; return OUT; } Shader. Perf 2. 0 Inputs: • GLSL, Cg, HLSL • PS 1. x, PS 2. x, PS 3. x • VS 1. x, VS 2. x, VS 3. x • !!FP 1. 0 • !!ARBfp 1. 0 ///////// pixel shader ///////// float 4 Bump. Reflect. PS(v 2 f IN, uniform sampler 2 D Normal. Map, uniform sampler. CUBE Environment. Map, uniform float Bump. Scale) : COLOR { // fetch the bump normal from the normal map float 3 normal = tex 2 D(Normal. Map, IN. Tex. Coord. xy). xyz * 2. 0 - 1. 0; normal = normalize(float 3(normal. x * Bump. Scale, normal. y * Bump. Scale, normal. z)); // transform the bump normal into cube space // then use the transformed normal and eye vector to compute a reflection vector // used to fetch the cube map // (we multiply by 2 only to increase brightness) float 3 eyevec = float 3(IN. Tex. Coord 1. w, IN. Tex. Coord 2. w, IN. Tex. Coord 3. w); float 3 world. Norm; world. Norm. x = dot(IN. Tex. Coord 1. xyz, normal); world. Norm. y = dot(IN. Tex. Coord 2. xyz, normal); world. Norm. z = dot(IN. Tex. Coord 3. xyz, normal); float 3 lookup = reflect(eyevec, world. Norm); return tex. CUBE(Environment. Map, lookup); } Shader. Perf GPU Arch: • Quadro FX series • Ge. Force 8 X 00, 7 X 00 • Ge. Force 6 X 00 & FX © NVIDIA Corporation 2007 Outputs: • Resulting assembly code • # of cycles • # of temporary registers • Pixel/vertex throughput • Test all fp 16 and all fp 32

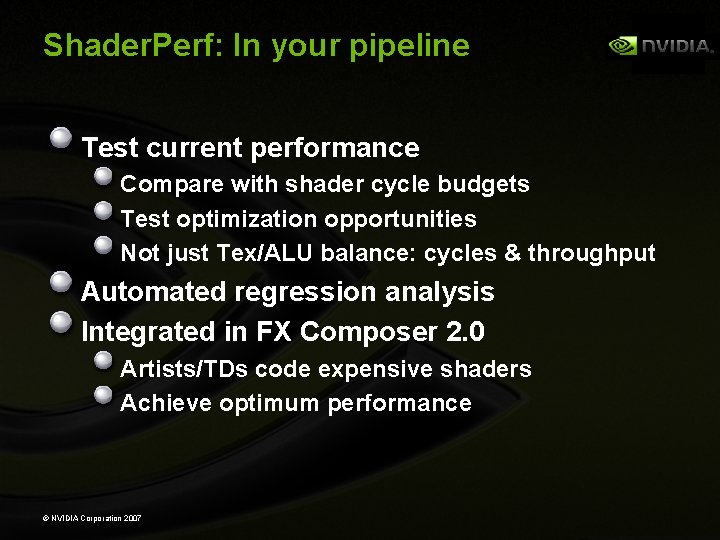
Shader. Perf: In your pipeline Test current performance Compare with shader cycle budgets Test optimization opportunities Not just Tex/ALU balance: cycles & throughput Automated regression analysis Integrated in FX Composer 2. 0 Artists/TDs code expensive shaders Achieve optimum performance © NVIDIA Corporation 2007

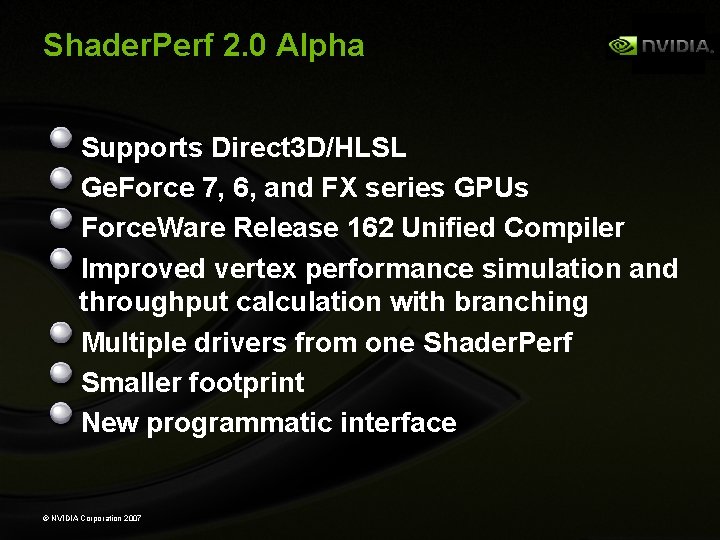
Shader. Perf 2. 0 Alpha Supports Direct 3 D/HLSL Ge. Force 7, 6, and FX series GPUs Force. Ware Release 162 Unified Compiler Improved vertex performance simulation and throughput calculation with branching Multiple drivers from one Shader. Perf Smaller footprint New programmatic interface © NVIDIA Corporation 2007

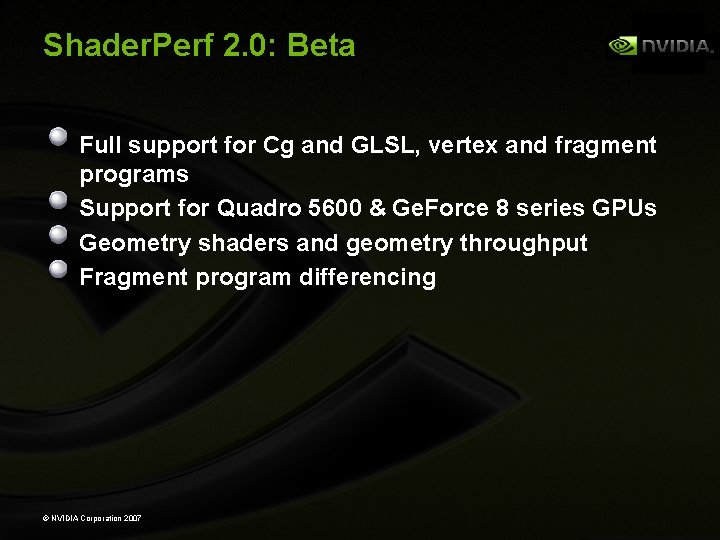
Shader. Perf 2. 0: Beta Full support for Cg and GLSL, vertex and fragment programs Support for Quadro 5600 & Ge. Force 8 series GPUs Geometry shaders and geometry throughput Fragment program differencing © NVIDIA Corporation 2007

Questions? Stop by our booth for a hands on demo! Online: http: //developer. nvidia. com/Perf. Kit http: //developer. nvidia. com/Perf. HUD http: //developer. nvidia. com/Shader. Perf Feedback and Support: http: //developer. nvidia. com/forums © NVIDIA Corporation 2007

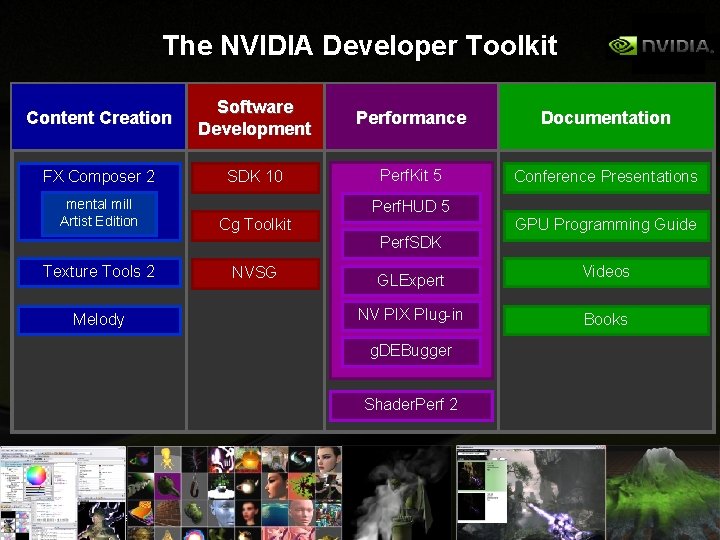
The NVIDIA Developer Toolkit Content Creation Software Development Performance Documentation FX Composer 2 SDK 10 Perf. Kit 5 Conference Presentations mental mill Artist Edition Perf. HUD 5 Cg Toolkit GPU Programming Guide Perf. SDK Texture Tools 2 Melody NVSG GLExpert NV PIX Plug-in g. DEBugger Shader. Perf 2 © NVIDIA Corporation 2007 Videos Books

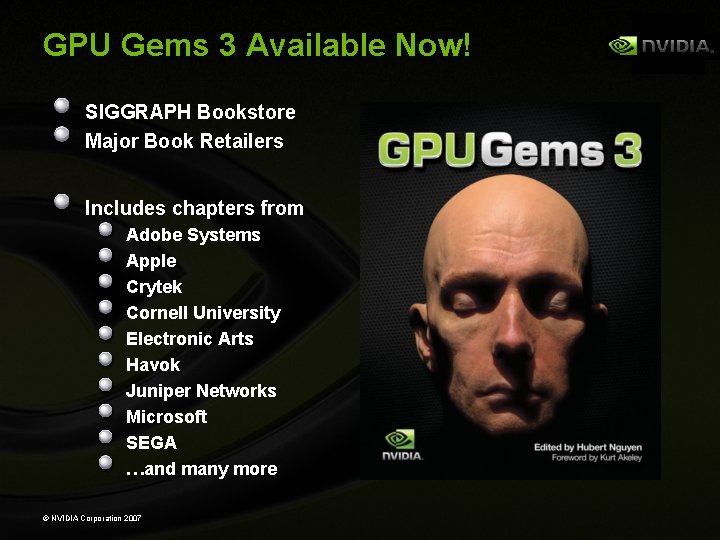
GPU Gems 3 Available Now! SIGGRAPH Bookstore Major Book Retailers Includes chapters from Adobe Systems Apple Crytek Cornell University Electronic Arts Havok Juniper Networks Microsoft SEGA …and many more © NVIDIA Corporation 2007