
Performance Optimization Simulation and Real Measurement Josef Weidendorfer
- Slides: 30
Performance Optimization: Simulation and Real Measurement Josef Weidendorfer KDE Developer Conference 2004 Ludwigsburg, Germany
Agenda • • • Introduction Performance Analysis Profiling Tools: Examples & Demo KCachegrind: Visualizing Results What’s to come … Performance Optimization – Simulation and Real Measurement Josef Weidendorfer 2 Ludwigsburg Germany 2004
Introduction • Why Performance Analysis in KDE ? – Key to useful Optimizations – Responsive Applications required for Acceptance – Not everybody owns a P 4 @ 3 GHz • About Me – Supporter of KDE since Beginning (“KAbalone”) – Currently at TU Munich, working on Cache Optimization for Numerical Code & Tools Performance Optimization – Simulation and Real Measurement Josef Weidendorfer 3 Ludwigsburg Germany 2004
Agenda • Introduction • Performance Analysis – Basics, Terms and Methods – Hardware Support • Profiling Tools: Examples & Demo • KCachegrind: Visualizing Results • What’s to come … Performance Optimization – Simulation and Real Measurement Josef Weidendorfer 4 Ludwigsburg Germany 2004
Performance Analysis • Why to use… – Locate Code Regions for Optimizations (Calls to time-intensive Library-Functions) – Check for Assumptions on Runtime Behavior (same Paint-Operation multiple times? ) – Best Algorithm from Alternatives for a given Problem – Get Knowledge about unknown Code (includes used Libraries like KDE-Libs/QT) Performance Optimization – Simulation and Real Measurement Josef Weidendorfer 5 Ludwigsburg Germany 2004
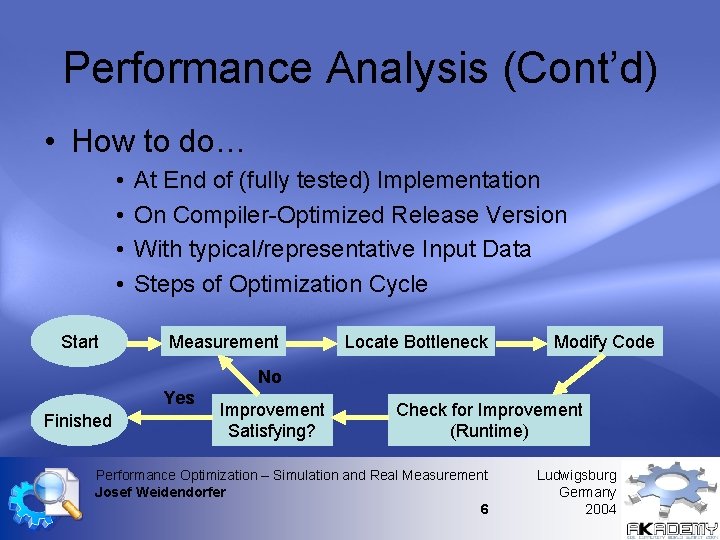
Performance Analysis (Cont’d) • How to do… • • Start At End of (fully tested) Implementation On Compiler-Optimized Release Version With typical/representative Input Data Steps of Optimization Cycle Measurement Locate Bottleneck Modify Code No Yes Finished Improvement Satisfying? Check for Improvement (Runtime) Performance Optimization – Simulation and Real Measurement Josef Weidendorfer 6 Ludwigsburg Germany 2004
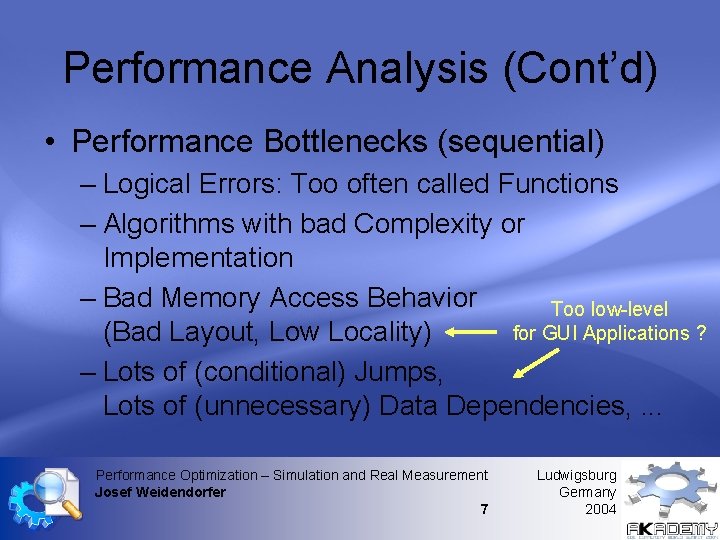
Performance Analysis (Cont’d) • Performance Bottlenecks (sequential) – Logical Errors: Too often called Functions – Algorithms with bad Complexity or Implementation – Bad Memory Access Behavior Too low-level for GUI Applications ? (Bad Layout, Low Locality) – Lots of (conditional) Jumps, Lots of (unnecessary) Data Dependencies, . . . Performance Optimization – Simulation and Real Measurement Josef Weidendorfer 7 Ludwigsburg Germany 2004
Performance Measurement • Wanted: – Time Partitioning with • Reason for Performance Loss (Stall because of…) • Detailed Relation to Source (Code, Data Structure) – Runtime Numbers • Call Relationships, Call Numbers • Loop Iterations, Jump Counts – No Perturbation of Results b/o Measurement Performance Optimization – Simulation and Real Measurement Josef Weidendorfer 8 Ludwigsburg Germany 2004
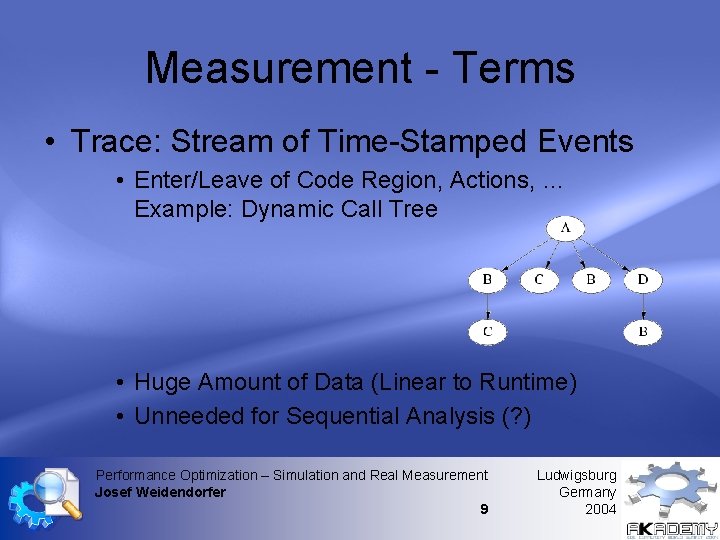
Measurement - Terms • Trace: Stream of Time-Stamped Events • Enter/Leave of Code Region, Actions, … Example: Dynamic Call Tree • Huge Amount of Data (Linear to Runtime) • Unneeded for Sequential Analysis (? ) Performance Optimization – Simulation and Real Measurement Josef Weidendorfer 9 Ludwigsburg Germany 2004
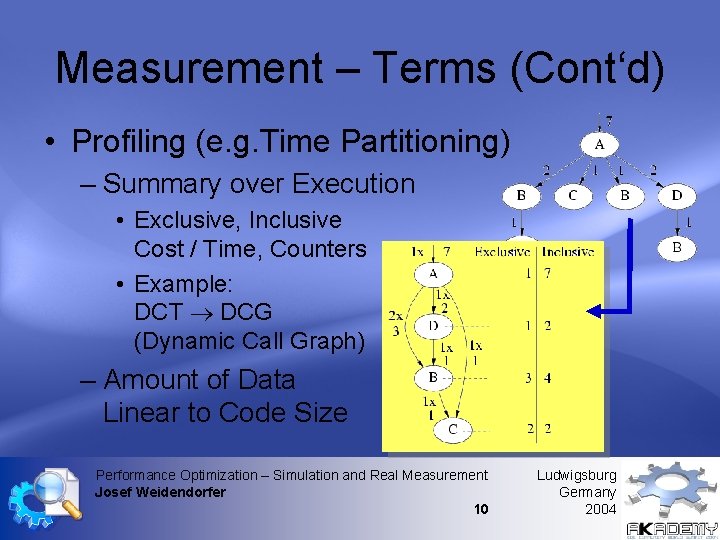
Measurement – Terms (Cont‘d) • Profiling (e. g. Time Partitioning) – Summary over Execution • Exclusive, Inclusive Cost / Time, Counters • Example: DCT DCG (Dynamic Call Graph) – Amount of Data Linear to Code Size Performance Optimization – Simulation and Real Measurement Josef Weidendorfer 10 Ludwigsburg Germany 2004
Methods • Precise Measurements – Increment Counter (Array) on Event – Attribute Counters to • Code / Data – Data Reduction Possibilities • Selection (Event Type, Code/Data Range) • Online Processing (Compression, …) – Needs Instrumentation (Measurement Code) Performance Optimization – Simulation and Real Measurement Josef Weidendorfer 11 Ludwigsburg Germany 2004
Methods - Instrumentation – Manual – Source Instrumentation – Library Version with Instrumentation – Compiler – Binary Editing – Runtime Instrumentation / Compiler – Runtime Injection Performance Optimization – Simulation and Real Measurement Josef Weidendorfer 12 Ludwigsburg Germany 2004
Methods (Cont’d) • Statistical Measurement (“Sampling”) – TBS (Time Based), EBS (Event Based) – Assumption: Event Distribution over Code Approximated by checking every N-th Event – Similar Way for Iterative Code: Measure only every N-th Iteration • Data Reduction Tunable – Compromise between Quality/Overhead Performance Optimization – Simulation and Real Measurement Josef Weidendorfer 13 Ludwigsburg Germany 2004
Methods (Cont’d) • Simulation – Events for (not existant) HW Models – Results not influenced by Measurement – Compromise Quality / Slowdown • Rough Model = High Discrepancy to Reality • Detailed Model = Best Match to Reality But: Reality (CPU) often unknown… – Allows for Architecture Parameter Studies Performance Optimization – Simulation and Real Measurement Josef Weidendorfer 14 Ludwigsburg Germany 2004
Hardware Support • Monitor Hardware – Event Sensors (in CPU, on Board) – Event Processing / Collection / Storing • Best: Separate HW • Comprimise: Use Same Resources after Data Reduction – Most CPUs nowadays include Performance Counters Performance Optimization – Simulation and Real Measurement Josef Weidendorfer 15 Ludwigsburg Germany 2004
Performance Counters • Multiple Event Sensors – ALU Utilization, Branch Prediction, Cache Events (L 1/L 2/TLB), Bus Utilization • Processing Hardware – Counter Registers • Itanium 2: 4, Pentium-4: 18, Opteron: 8 Athlon: 4, Pentium-II/III/M: 2, Alpha 21164: 3 Performance Optimization – Simulation and Real Measurement Josef Weidendorfer 16 Ludwigsburg Germany 2004
Performance Counters (Cont’d) • Two Uses: – Read • Get Precise Count of Events in Code Regions by Enter/Leave Instrumentation – Interrupt on Overflow • Allows Statistical Sampling • Handler Gets Process State & Restarts Counter • Both can have Overhead • Often Difficult to Understand Performance Optimization – Simulation and Real Measurement Josef Weidendorfer 17 Ludwigsburg Germany 2004
Agenda • • • Introduction Performance Analysis Profiling Tools: Examples & Demo – Callgrind/Calltree – OProfile • KCachegrind: Visualizing Results • What’s to come … Performance Optimization – Simulation and Real Measurement Josef Weidendorfer 18 Ludwigsburg Germany 2004
Tools - Measurement • Read Hardware Performance Counters – Specific: Perf. Ctr (x 86), Pfmon (Itanium), perfex (SGI) Portable: PAPI, PCL • Statistical Sampling – PAPI, Pfmon (Itanium), OProfile (Linux), VTune (commercial - Intel), Prof/GProf (TBS) • Instrumentation – GProf, Pixie (HP/SGI), VTune (Intel) – Dyna. Prof (Using Dyn. Inst), Valgrind (x 86 Simulation) Performance Optimization – Simulation and Real Measurement Josef Weidendorfer 19 Ludwigsburg Germany 2004
Tools – Example 1 • GProf (Compiler generated Instr. ): • Function Entries increment Call Counter for (caller, called)-Tupel • Combined with Time Based Sampling • Compile with “gcc –pg. . . ” • Run creates “gmon. out” • Analyse with “gprof. . . ” • Overhead still around 100% ! • Available with GCC on UNIX Performance Optimization – Simulation and Real Measurement Josef Weidendorfer 20 Ludwigsburg Germany 2004
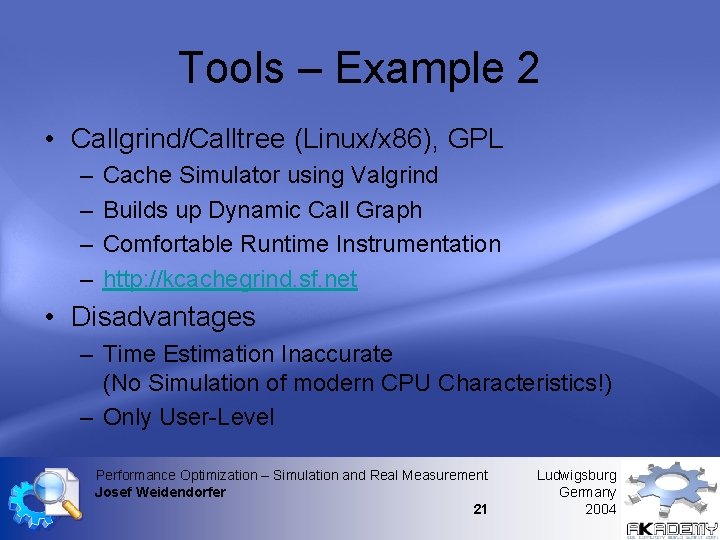
Tools – Example 2 • Callgrind/Calltree (Linux/x 86), GPL – – Cache Simulator using Valgrind Builds up Dynamic Call Graph Comfortable Runtime Instrumentation http: //kcachegrind. sf. net • Disadvantages – Time Estimation Inaccurate (No Simulation of modern CPU Characteristics!) – Only User-Level Performance Optimization – Simulation and Real Measurement Josef Weidendorfer 21 Ludwigsburg Germany 2004
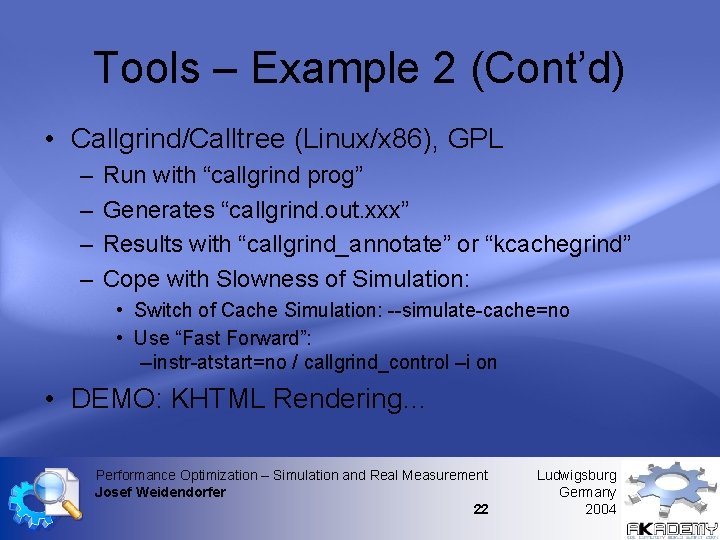
Tools – Example 2 (Cont’d) • Callgrind/Calltree (Linux/x 86), GPL – – Run with “callgrind prog” Generates “callgrind. out. xxx” Results with “callgrind_annotate” or “kcachegrind” Cope with Slowness of Simulation: • Switch of Cache Simulation: --simulate-cache=no • Use “Fast Forward”: --instr-atstart=no / callgrind_control –i on • DEMO: KHTML Rendering… Performance Optimization – Simulation and Real Measurement Josef Weidendorfer 22 Ludwigsburg Germany 2004
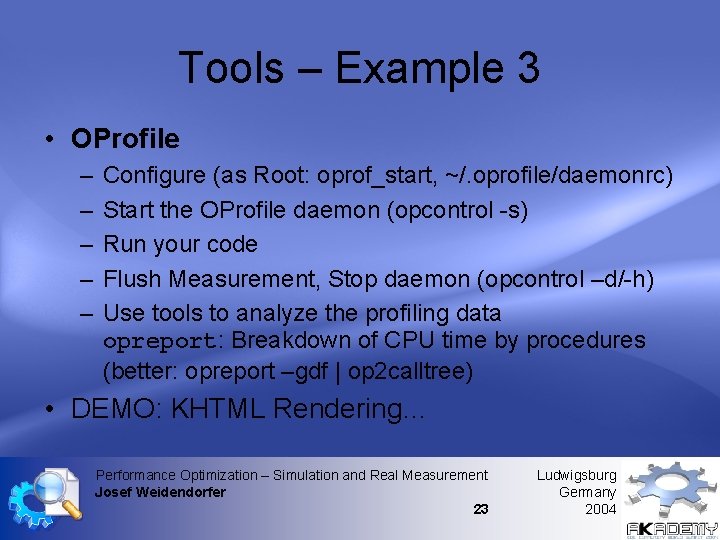
Tools – Example 3 • OProfile – – – Configure (as Root: oprof_start, ~/. oprofile/daemonrc) Start the OProfile daemon (opcontrol -s) Run your code Flush Measurement, Stop daemon (opcontrol –d/-h) Use tools to analyze the profiling data opreport: Breakdown of CPU time by procedures (better: opreport –gdf | op 2 calltree) • DEMO: KHTML Rendering… Performance Optimization – Simulation and Real Measurement Josef Weidendorfer 23 Ludwigsburg Germany 2004
Agenda • • Introduction Performance Analysis Profiling Tools: Examples & Demo KCachegrind: Visualizing Results – Data Model, GUI Elements, Basic Usage – DEMO • What’s to come … Performance Optimization – Simulation and Real Measurement Josef Weidendorfer 24 Ludwigsburg Germany 2004
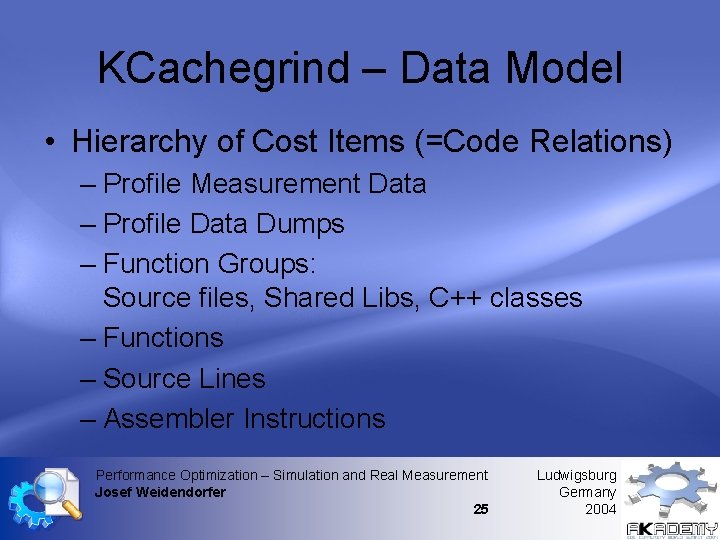
KCachegrind – Data Model • Hierarchy of Cost Items (=Code Relations) – Profile Measurement Data – Profile Data Dumps – Function Groups: Source files, Shared Libs, C++ classes – Functions – Source Lines – Assembler Instructions Performance Optimization – Simulation and Real Measurement Josef Weidendorfer 25 Ludwigsburg Germany 2004
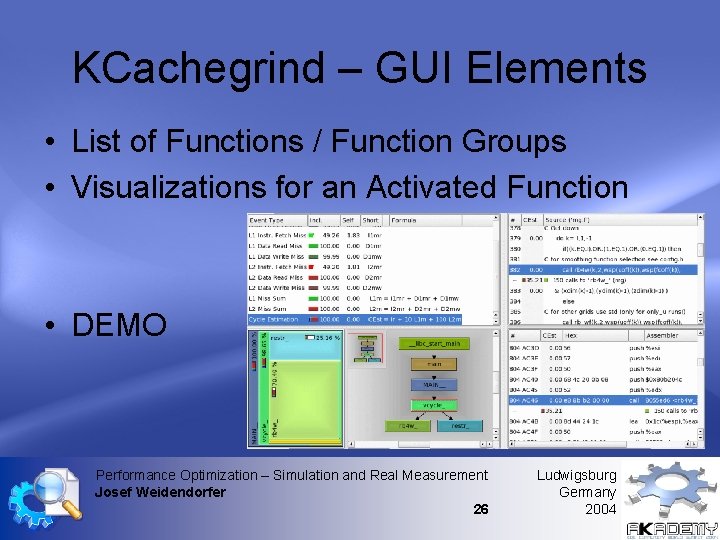
KCachegrind – GUI Elements • List of Functions / Function Groups • Visualizations for an Activated Function • DEMO Performance Optimization – Simulation and Real Measurement Josef Weidendorfer 26 Ludwigsburg Germany 2004
Agenda • • • Introduction Performance Analysis Profiling Tools: Examples & Demo KCachegrind: Visualizing Results What’s to come … – Callgrind – KCachegrind Performance Optimization – Simulation and Real Measurement Josef Weidendorfer 27 Ludwigsburg Germany 2004
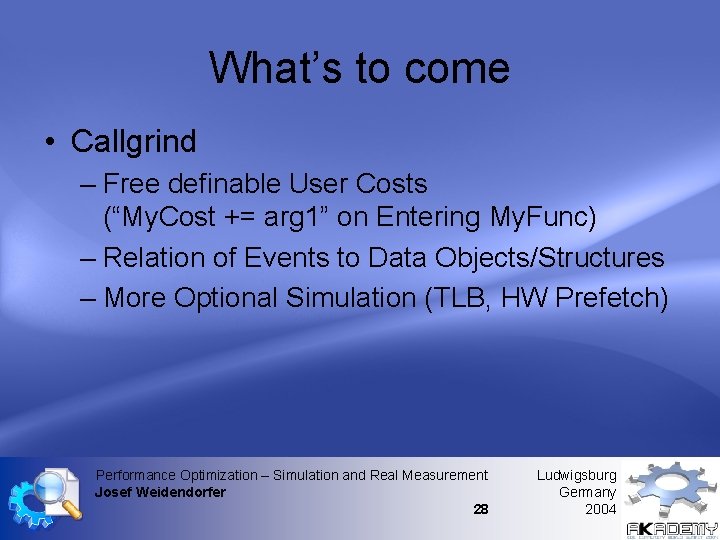
What’s to come • Callgrind – Free definable User Costs (“My. Cost += arg 1” on Entering My. Func) – Relation of Events to Data Objects/Structures – More Optional Simulation (TLB, HW Prefetch) Performance Optimization – Simulation and Real Measurement Josef Weidendorfer 28 Ludwigsburg Germany 2004
What’s to come (Cont’d) • KCachegrind – Supplement Sampling Data with Inclusive Cost via Call-Graph from Simulation – Comparation of Measurements – Plugins for • Interactive Control of Profiling Tools • Visualizations for Data Relation Performance Optimization – Simulation and Real Measurement Josef Weidendorfer 29 Ludwigsburg Germany 2004
Finally… THANKS FOR LISTENING Performance Optimization – Simulation and Real Measurement Josef Weidendorfer 30 Ludwigsburg Germany 2004