Performance of the Spaghetti calorimeter with individual fiberreadout

Performance of the Spaghetti calorimeter with individual fiber-readout T. Matsumura, T. Tojo, T. Shinkawa (N. D. A. ) T. Yamanaka (Osaka Univ. ) Y. Kato, T. Sawada, T. Hotta (RCNP) H. Watanabe (KEK) R. Ogata, S. Suzuki, T. Shimogawa (Saga Univ. ) Y. Tajima (Yamagata Univ. ) 01 November, 2006 Joint Meeting of Pacific Region Particle Physics Community

Contents • Introduction ü KL rare-decay experiment at J-PARC ü Spaghetti calorimeter for the preshower detector • Performance of prototype detector ü Beam test with photon beam ü Shower tracking ü ü e+e- conversion-point Angular resolution

KL rare-decay experiment Purpose: Search for new physics beyond the S. M. by measuring the KL→p 0 nn decay Br (KL → p 0 nn) ~ (3. 0 ± 0. 6)× 10 -11 (S. M. ) Br (KL → p 0 nn) < 2. 1× 10 -7 (current upper limit: KEK-E 391 a 2006) KEK E 391 a Feb. 2004 - Dec. 2005 • establishing the experimental method • update the upper limit J-PARC - KL • first observation of the KL → p 0 nn decay

Basic design of the experiment • Signal identification 2 g + nothing pre-shower detector ~ 15 m g KL g n KL →p 0 nn decay End cap Cs. I n Veto counter Decay Region limited constraint • Main background KL → p 0 p 0 → 4 g • 2 g missing • 1 g missing + 2 g fusion • Pre-shower detector 2 g separation photon direction
 Scitillating fibers and lead radiator grooved")
Candidate of the pre-shower detector Spaghetti-type calorimeter (SPACAL) Scitillating fibers and lead radiator grooved lead plate and fibers fiber diameter 1 mmf fiber interval 1. 35 mm report of the KLOE experiment By measuring the fibers individually, Photon energy, direction, position can be obtained with the spaghetti calorimeter.
 70 mm g 1 g 2 MC Demonstration (simple")
Feature of the SPACAL (1) 70 mm g 1 g 2 MC Demonstration (simple XYXY configuration) End-cap Cs. I x (mm) Fiber-hit distribution Conversion efficiency X Y X ~ 90 % with 3. 2 X 0 =5 cm thickness Compact 70 mm X Y z (mm) Energy resolution End-cup Cs. I y (mm) z (mm) g 1 g 2 2 photons Eg 1 = Eg 2 = 0. 3 Ge. V R 12 = 65 mm s. E/E = 2 % for Eg=1 Ge. V ( 1. 5 % for Cs. I only ) Photon separation efficiency ~100 % for >20 mm distance Eg >0. 1 Ge. V
 number of fiber-hits / events MIP(150 ke. V) Eg")
Feature of the SPACAL (2) number of fiber-hits / events MIP(150 ke. V) Eg = 1. 00 Ge. V Eg = 0. 50 Ge. V Eg = 0. 25 Ge. V Eg = 0. 10 Ge. V The distribution of the energy deposit does not change so much among the all different energies. Photon energy can be estimated by just counting the number of fibers No ADC is needed for energy measurement. Simplification of the readout electronics Energy deposit in a fiber (Me. V)

Performance of the prototype detector

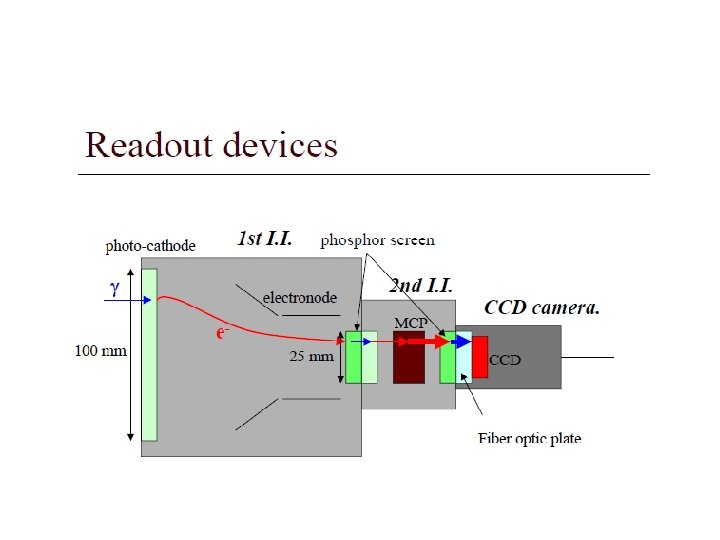
Prototype Detector 10 x 9. 7 cm 3 ~ 6 X 0 IIT-2 PMT light guide • trigger timing • energy deposit fibers (5, 850) g 75 cm IIT-1 fibers (5, 850) • shower profile IIT+CCD system Image Intensifier (2 stages) • IIT-1: image reduction (1/16) • IIT-2: amplification(x 106), gate (100 ms) CCD camera • 768(H) x 494(V), 30 flames/sec CCD

Pictures Prototype detector PMT Fiber bundle Total: 5850 fibers photon beam bundle unit ( 3 x 25 fibers) Image Intensifier

Setup of the beam test • Trigger • Photon beam @ SPring-8 – self trigger (Eg > 300 Me. V) – Eg : 1. 5 ~ 3. 0 Ge. V tagged photons – rate: 16 Hz • Collimator (1 mm 2 hole) – avoiding the image overlap PMT Collimator 1 x 1 mm 2 scintillator active collimator 5 mmf g beam SPACAL prototype 10 k. Hz AC IIT+CCD TOP VIEW
 3 x 25 fibers IIT effective area")
Fiber bundle IIT surface Detector (side view) 3 x 25 fibers IIT effective area (10 cmf) top rearrangement 10 cm g beam 9. 7 cm (~6 X 0) bottom Fiber rearrangement to maximize the number of readout-fibers CCD image is not directly related to the fiber position in the detector.
 A cosmic-ray event X (pixel)")
Typical image A shower event Accumulated image Y (pixel) A cosmic-ray event X (pixel) Dead region
 Note: flip vertical detector")
Reconstruction of the cosmic-ray track 251 pixels fired x (pixel) Note: flip vertical detector coordinate y (mm) y (pixel) CCD coordinate 107 fibers fired z (mm)

Shower tracking Typical shower events 1. Remove the isolated clusters by requiring cluster-size cut (Nsize) Eg = 2. 1 Ge. V, real data y (mm) 2. Fit a straight line to the weighted mean of the fiber-hits in each layer g D 3. Select only shower core-region by applying the D cut 4. Estimate the conversion point (z 0) from the most upstream fiber in the selected region z 0 z (mm) Angle of incident photons was estimated by using information of fiber hits in the core region.

Effect of shower-core selection Eg ~ 2. 1 Ge. V, Nsize≧ 4 • By selecting the shower-core region the angle resolution would be improved sq (rad) less shower fluctuation data MC D (mm) • The dependence was not so significant, but improvement (~20 %) was seen in both data and MC. D ~ 8 mm is sufficient
 events / bin Reconstruction Efficiency")
e ( |z 0 -ztrue| < 4 mm ) events / bin Reconstruction Efficiency MC Nsize≧ 2 Nsize≧ 4 Nsize≧ 6 Conversion Point • Reconstruction efficiency (<4 mm ) is more than 95 % above 1 Ge. V photons Tight Nsize cut results in the worse efficiency due to the suppression of the small clusters near the conversion point. Eg (Ge. V) Eg ~ 2. 1 Ge. V Real data • Reconstructed z 0 distribution shows an exponential curve as we expected • Vertex resolution in y at the conversion point was independent of energies ~ 0. 7 mm z 0 (mm) limited by the position resolution of the fiber hits
 z 0 Length from conversion point (z 0) for straight")
Lz Tracking length (Lz) z 0 Length from conversion point (z 0) for straight line fitting. Eg ~ 2. 1 Ge. V, Nsize≧ 4, D = 8 mm sq (rad) data MC Large Lz → Entire shower information Small Lz → Only the information of the early stage of the shower development minimum at ~2. 5 X 0 = 16 mm Lz (X 0) Deterioration at very small Lz regions was due to the limitation by the position resolution of the fiber hits.

Energy dependence Nsize≧ 4, D = 8 mm, Lz = 2. 5 X 0 sq (rad) data MC • Good agreement between data and MC Data point ranges 1. 5 ~ 2. 8 Ge. V ( tagged photon energy) • Angular resolution 37 mrad @ 2 Ge. V Eg (Ge. V)

Nfiber VS Energy deposit d. E ~ 150 Me. V PMT ~ 6 X 0 CCD g Number of fiber-hits and the energy deposit measured by PMT Nfiber Eg ~ 2. 1 Ge. V Linear correlation Energy deposit can be measured by just counting the number of fiber ADC (PMT)

Future plans • Improvement of the sampling ratio Present setup with round fibers : 12 % with 1 mm 2 square fiber : ~ 30% is possible Square fibers (1 x 1 mm 2) • Study of devices for the fiber readout Study of the basic performance of the M-APD samples (JINR, Russia) has been started. 1 mm

Summary • A pre-shower detector with spaghetti-type calorimeter was studied for – better 2 g separation – photon direction measurement • Prototype detector of the Spaghetti-type calorimeter was constructed and tested with the photon beam. – angular resolution : 37 mrad @ 2 Ge. V – position resolution : 0. 7 mm (independent of energies) • For the future plan – Improvement of the photon detection inefficiency – Development of the readout device (M-APD)

Backup Slides
 Eg = 0. 1 Ge. V Eg = 1.")
Energy resolution s. E/E (%) Eg = 0. 1 Ge. V Eg = 1. 0 Ge. V 0 50 100 SPACAL thickness (mm) Assumption: Cs. I Npe = 10 p. e. /Me. V SPACAL Npe = 30 p. e. /Me. V

Performance of the IIT-CCD system Gain 5. 0, gate width 100 ms Trigger counter CCD Scintillating fiber Kuraray SCSF-78 IIT 50 cm • 90 Sr collimator Performance (evaluated by the 90 Sr bench test) 1 mm @ IIT entrance → 4. 7 pixel @ CCD X (pixel) 1 fiber is covered by ~ 5 x 5 pixels Resolution 2. 2 pixels @ CCD (0. 47 mm @IIT entrance) Efficiency (1 pixel found) 90 % for MIP energy (0. 15 Me. V) • Monte-Carlo (MC) simulation Geant 4 + pixel simulation was developed. Y (pixel)

Position resolution of the fiber hits • position resolution of the IIT-CCD is s ~ 2. 2 pixel (= 0. 47 mm) X (pixel) the pixel hits could leak into the next fiber region The position resolution of fiber hits was estimated by MC sy = 0. 6 ~ 0. 9 mm sz = 0. 45 ~ 0. 7 mm Y (pixel) depending on the bundle units

Position distribution @ z 0 Position resolution for y direction at z 0 is independent of energy. ~ 0. 7 mm Eg ~ 1. 5 Ge. V y (mm) Eg ~ 2. 1 Ge. V y (mm) Eg ~ 2. 8 Ge. V y (mm)

Image to fiber-hits 1. For all fired pixels, determine the fiber cell which the pixel belongs to 2. Summing up the number of pixels containing fibers 3. Fiber position in the detector coordinate is assigned according to the fiber position map. 3 x 25 fiber cells cell size ~ 5 x 5 pixels
- Slides: 29