Performance of Global Forecast System NCMRWFIMD INDIA Presentation
 Presentation for Annual performance evaluation of NCEP")
Performance of Global Forecast System NCMRWF/IMD (INDIA) Presentation for Annual performance evaluation of NCEP production suite at NCEP, Maryland, USA during 6 -8 December 2011

Care-takers • NCMRWF • Data/monitoring: Munmun Das Gupta, Indira Rani • Analysis : V S Prasad • Model/post : Saji Mohandas • Verification : Gopal Iyengar • GEFS : E N Rajagopal • IMD • Data/monitoring: S D Kotal • Analysis/Model/Verfication : V R Durai • Co-ordinator : S. K. Roy Bhowmik

Numerical Weather Prediction System of NCMRWF Data Global Observations Reception SURFACE from land stations GTS RTH, IMD SHIP BUOY 24 x 7 Upper Air RSRW/ PIBAL Aircraft Satellite NKN ISRO (MT) NCMRWF OBSERVATION PROCESSING 45 mbps High Resolution Satellite Obsn NKN Internet (FTP) NESDIS proposed dedicated link EUMETSAT Global Data Assimilation Observation quality checks & monitoring Global Analysis (GSI) Initial state Global Forecast Model ( 9 hr Fcst – first guess ) 4 times a day for 00, 06, 12, 18 UTC Forecast Models Users Global Model T 574 L 64 10 day FCST IMD Visualisation INCOI S NKN Meso-scale Data Assimilation & Model Statistical Interpolation Model (location specific FCST) once in a day for 00 UTC Other sectors
 – Current status Model Version Horizontal Forecast Resolution Length Performance GFS")
GFS Models (NCMRWF) – Current status Model Version Horizontal Forecast Resolution Length Performance GFS T 382 L 64 GFS version 9. 0. 1 ~35 km 168 Hrs (3 hr data cutoff) 4 min. for 24 hr forecast (IBMP 6 16 nodes) GFS T 574 L 64 GFS version 9. 0. 1 ~23 km 240 Hrs (5 hr data cutoff) 9 min. for 24 hr forecast (IBMP 6 16 nodes) GEFS T 190 L 28 Latest version 20 members ~70 km 240 Hrs (Not operational) 6 min. For 24 hr forecast (IBM-P 6 8 nodes) High Performance Computing Systems HPC Connectivit y No of Processors available Per node memory Processor speed IBM Infini Band Power 6 38 x 32 (NCMRWF) 24 x 32 (IMD) 4 x 32 GB 4. 7 Gflops

Recent developments in NCMRWF GFS system Implementation of the T 382 L 64 GFS from May 2010 (latest versions of upgraded model and GSI) Assimilation of additional data in T 382 L 64 GFS The Advanced Microwave Scanning Radiometer - Earth Observing System (AMSR-E) winds Rainfall rates (TRMM, SSMI) NOAA 19 radiances Atmospheric Infrared Sounder (AIRS) radiances GPSRO (COSMIC) Implementation of the T 574 L 64 GFS from mid-November, 2010 (July 2010 Version) Implementation of latest NCEP version of T 574 L 64 (from June, 2011)

Time line - NCMRWF GFS The T 382 L 64 GFS was implemented in May 2010. The T 574 L 64 GFS was first implemented in November 2010. T 382 L 64 performance was evaluated during Monsoon 2010 and was found to marginally better than the T 254 L 64 GFS. T 254 L 64 stopped. T 574 L 64 performance was evaluated during November. December 2010 and was found to better than the T 382 L 64 GFS. T 382 L 64 model was run parallel to T 574 L 64 for Monsoon 2011 The latest version of the NCEP T 574 L 64 GFS was implemented in May 2011 and found to be better than T 382 L 64 system T 382 L 64 run stopped from November 2011 End-to-end T 574 L 64 GFS system was transferred to IMD on 15 November, 2011

Physical Parameterization schemes in T 382 L 64 and T 574 L 64 Physics T 382 L 64 T 574 L 64 Surface Fluxes Monin-Obukhov similarity Turbulent Diffusion Non-local Closure scheme (Hong and Pan (1996) Non-local Closure scheme (Lock et al. , 2000) SW Radiation Based on Hou et al. 2002 –no aeroslos – invoked hourly Rapid Radiative Transfer Model (RRTM 2) (Mlawer et al. 1997; Mlawer and Clough, 1998)- aerosols included– invoked hourly LW Radiation Rapid Radiative Transfer Model (RRTM) (Mlawer et al. 1997). –no aerosols- invoked 3 hourly Rapid Radiative Transfer Model (RRTM 1) (Mlawer and Clough 1997; 1998). –aerosols includedinvoked hourly Deep Convection SAS convection (Pan and Wu (1994) SAS convection (Han and Pan, 2006) Shallow Convection Shallow convection Following Tiedtke (1983) Mass flux scheme (Han and Pan, 2010) Large Scale Condensation Large Scale Precipitation (Zhao and Carr , 1997; Sundqvist et al. , 1989) Cloud Generation Based on Xu and Randall (1996) Rainfall Evaporation Kessler (1969) Land Surface Processes NOAH LSM with 4 soil levels for temperature & moisture (Ek et al. , 2003) Air-Sea Interaction Roughness length by Charnock (1955)Observed SST, Thermal roughness over the ocean is based on Zeng et al. , (1998). 3 -layer Thermodynamic Sea-ice model (Winton, 2000) Roughness length by Charnock (1955), Observed SST, Thermal roughness over the ocean is based on Zeng et al. , (1998). 3 -layer Thermodynamic Sea -ice model (Winton, 2000) Gravity Wave Drag & mountain blocking Based on Alpert et al. (1988) Lott and Miller (1997), Kim and Arakawa (1995), Alpert et al. , (1996) Vertical Advection Explicit Flux-Limited Positive-Definite Scheme (Yang et al. , 2009)

Differences of the T 574 L 64 GSI Data Assimilation system compared to T 382 L 64 New observations assimilated Improvements in Data Assimilation system Inclusion of METOP IASI (Infrared Atmospheric Sounding Interferometer) data Use of variational qc Reduction of number of AIRS (Atmospheric Infrared Sounder) water vapor channels used Addition of background error covariance input file Assimilating tropical storm pseudo sea-level pressure observations, Flow dependent reweighting of background error variances NOAA-19 HIRS/4 (High Resolution Infrared Radiation Sounder) and AMSU-a (Advanced Microwave Sounding Unit) brightness temperature, Use of new version and coefficients for community radiative transfer model (CRTM -2. 02 ) NOAA-18 SBUV/2, (Solar Backscatter Ultraviolet Spectral Radiometer) Ozone , EUMETSAT-9 atmospheric motion vectors. Improved Tropical Cyclone Relocation Using uniform thinning mesh for brightness temperature data. Change in land/snow/ice skin temperature variance Improving assimilation of GPS radial occultation data. RE-tuned observation errors. ASCAT (Advanced Scatterometer) winds included Korean AMDAR data and more number of Aircraft Reports European Wind profiler data

Types of observations Assimilated in GFS Observation category Name of Observation. Surface Land surface, Mobile, Ship, Buoy (SYNOPs) Upper air TEMP (land marine), PILOT (land marine), Dropsonde, Wind profiler Aircraft AIREP, AMDAR, TAMDAR, ACARS Atmospheric Motion Vectors from Geo-Stationary Satellites AMV from Meteosat-7, Meteosat-9, GOES-11, GOES-13, MTSAT-1 R, MODIS (TERRA and AQUA), Scatterometer winds ASCAT winds from METOP-A satellite, NESDIS / POES ATOVS Sounding radiance data 1 bamua, 1 bamub, 1 bmhs, 1 bhirs 3, 1 bhirs 4 Satellite derived Ozone data NESDIS/POES, METOP-2 and AURA orbital ozone data Precipitation Rates NASA/TRMM (Tropical Rainfall Measuring Mission) and SSM/I precip. rates Bending angles from GPSRO Atmospheric profiles from radio occultation data using GPS satellites NASA/AQUA AIRS & METOP/ IASI brightness temperature data IASI, AIRS, AMSR-E brightness temperatures

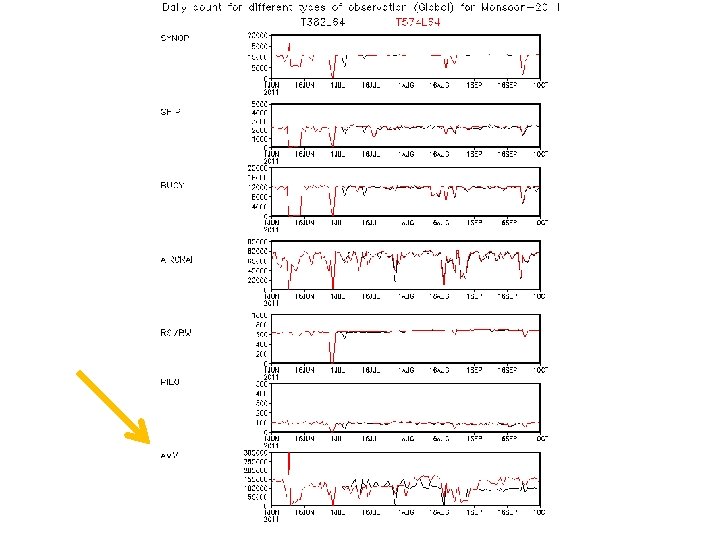
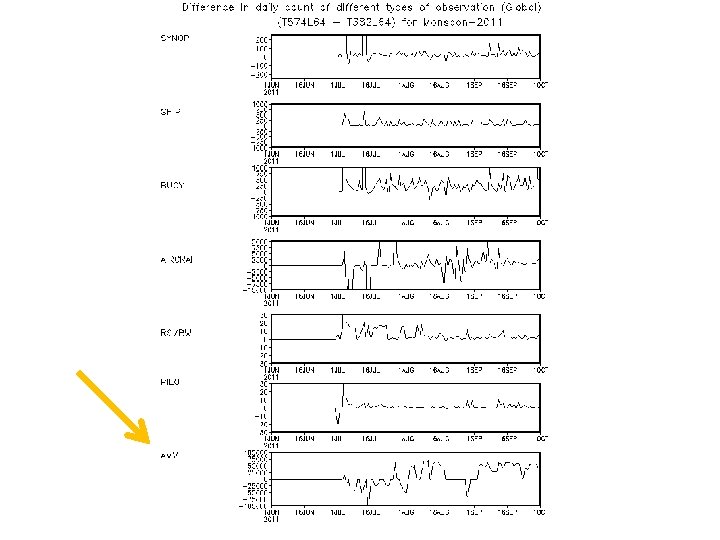
Count of different types of observations over Indian Region (received at NCMRWF at 00 UTC from 1 to 25 of months June, July, August, and September 2011) Observation Type June July August September SYNOP 143 139 142 136 RS/RW 33 33 37 39 PILOT 31 25 22 23 AWS 544 719 552 690 ARG 195 424 308 357 BUOY 10 10 11 10
 (Average number of observations received in")
Data Reception: NCMRWF vs ECMWF (S-W Monsoon, 2011) (Average number of observations received in 24 hours ) RED COLOUR INDICATES LESS DATA ; BLUE COLOUR INDICATES COMPARABLE DATA June July August NCMRWF ECMWF SYNOP/SHIP Pressure BUOY (Drifter) 46, 118 78, 390 56, 734 78, 481 57, 607 78, 574 10, 715 13, 953 13, 882 13, 879 13, 752 13, 531 TEMP 500 h. Pa Geopotential TEMP/PILOT 300 h. Pa Wind AIRCRAFT winds (300 -150 h. Pa) AMV winds (400 -150 h. Pa) AMV winds (1000 -700 h. Pa) 1, 088 1, 286 1, 271 1, 286 1, 320 1, 336 1, 098 1, 434 1, 300 1, 429 1, 349 1, 490 58, 412 1, 04, 987 72, 842 1, 02, 562 72, 685 1, 03, 059 2, 00, 283 10, 06, 280 2, 55, 690 9, 78, 269 2, 43, 282 9, 45, 691 1, 28, 786 8, 53, 193 8, 91, 204 1, 52, 905 8, 21, 724 1, 54, 724
 and T 382 L 64")
Vertical Profile of T 574 L 64 (Dotted Line) and T 382 L 64 (Bold Line) Analyses (Black) and First Guess (Red) Vector Wind Fits (Bias and RMSE) to RAOBS over Global for JJAS, 2011. The Right Panel graph gives the observation data counts over the region used for the comparison.
 and T 382 L 64")
Vertical Profile of T 574 L 64 (Dotted Line) and T 382 L 64 (Bold Line) Analyses (Black) and First Guess (Red) Vector Wind Fits (Bias and RMSE) to RAOBS over Tropics for JJAS, 2011. The Right Panel graph gives the observation data counts over the region used for the comparison.
 and T 382 L 64")
Vertical Profile of T 574 L 64 (Dotted Line) and T 382 L 64 (Bold Line) Analyses (Black) and First Guess (Red) Moisture Fits (Bias and RMSE) to RAOBS over Global for JJAS, 2011. The Right Panel graph gives the observation data counts over the region used for the comparison.
 and T 382 L 64")
Vertical Profile of T 574 L 64 (Dotted Line) and T 382 L 64 (Bold Line) Analyses (Black) and First Guess (Red) Moisture Fits (Bias and RMSE) to RAOBS over Tropics for JJAS, 2011. The Right Panel graph gives the observation data counts over the region used for the comparison.
 and T 382 L 64")
Vertical Profile of T 574 L 64 (Dotted Line) and T 382 L 64 (Bold Line) Analyses (Black) and First Guess (Red) Temperature Fits (Bias and RMSE) to RAOBS over Global for JJAS, 2011. The Right Panel graph gives the observation data counts over the region used for the comparison.
 and T 382 L 64")
Vertical Profile of T 574 L 64 (Dotted Line) and T 382 L 64 (Bold Line) Analyses (Black) and First Guess (Red) Temperature Fits (Bias and RMSE) to RAOBS over Tropics for JJAS, 2011. The Right Panel graph gives the observation data counts over the region used for the comparison.

Global Circulation Features

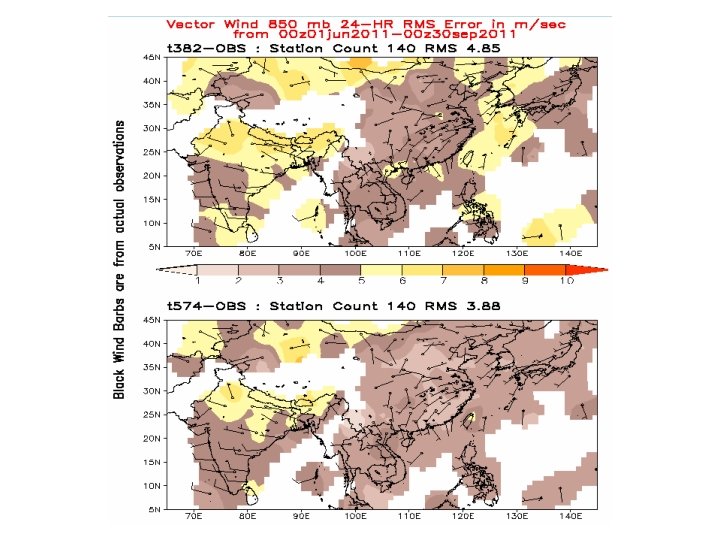
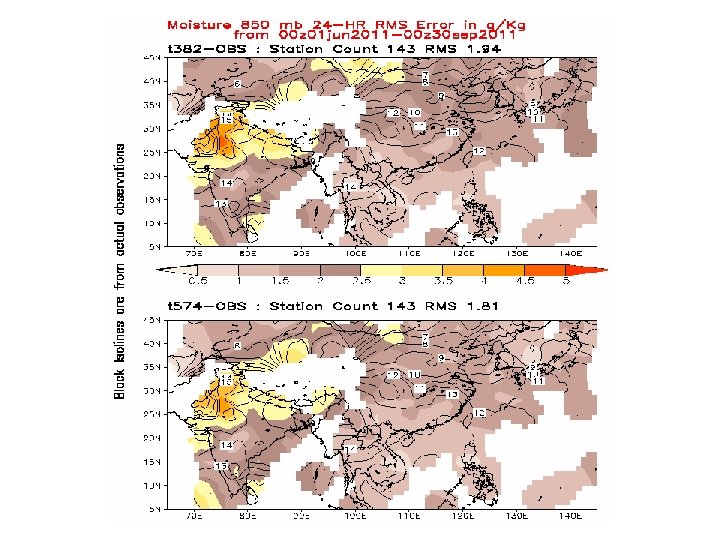
Day 05 Forecast Errors 850 h. Pa Zonal Wind JJA 2011 NCMRWF NCEP

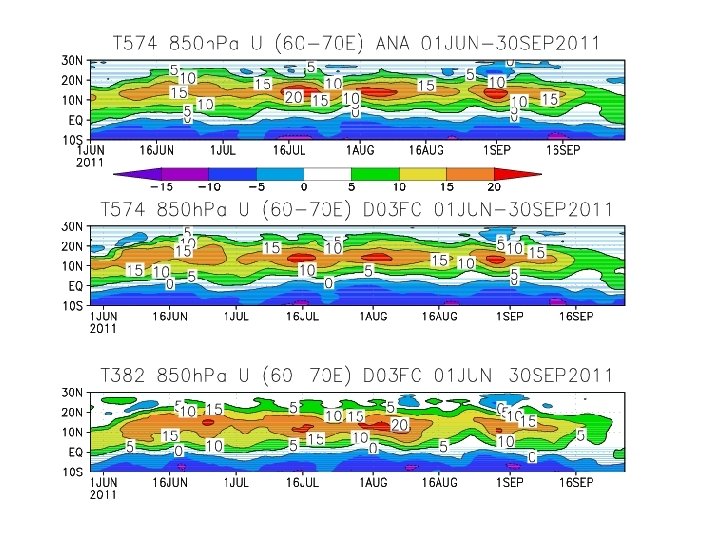
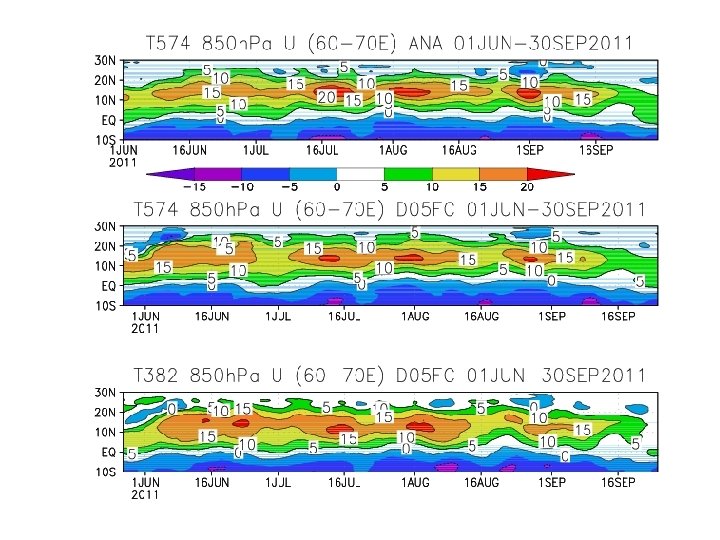
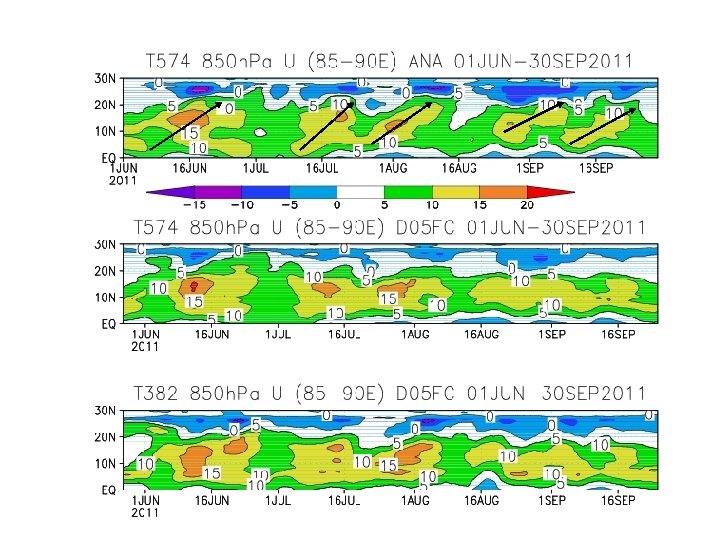
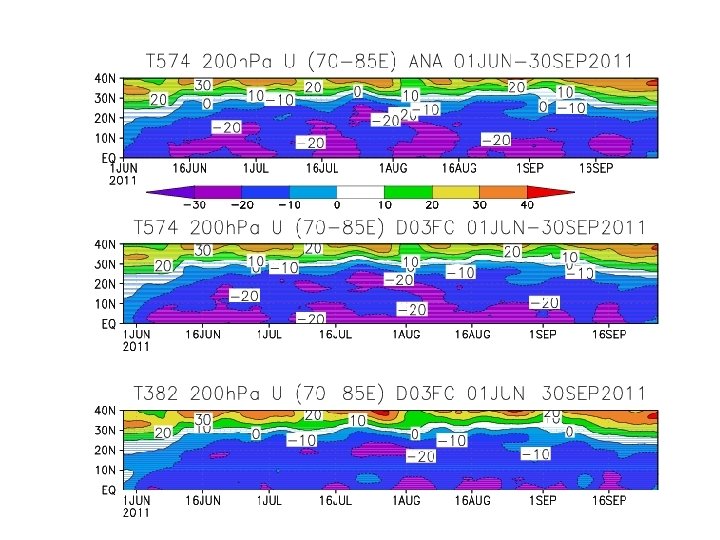
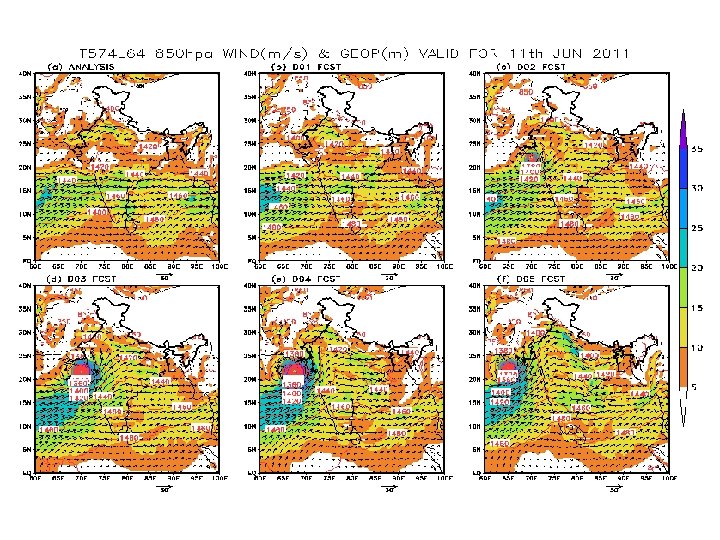
Regional Circulation Features

ANA T 382 T 574 D 03 ERR

ANA T 382 T 574 D 05 ERR

ANA T 382 T 574 D 03 ERR

ANA T 382 T 574 D 05 ERR

ANA T 382 T 574 D 03 ERR

ANA T 382 T 574 D 05 ERR

T 382 T 574

T 382 T 574

T 382 T 574

T 382 T 574

VERIFICATION AGAINST ITS OWN ANALYSIS Models: T 574, T 382 and UKMO Parameters : Zonal & Meridional Wind, Geo-potential Height, Temperature, Relative Humidity Øforecast and analysis fields used are valid for 00 UTC and the forecasts are based on initial condition valid for 00 UTC. Øcomputed the scores using the data at 1 degree resolution from all the models.

T 574 T 382 UKMO

T 574 T 382 UKMO

RMSE against own analysis 850 h. Pa Zonal Wind 850 h. Pa 200 h. Pa Model Day 1 Day 3 Day 5 T 382 2. 9 3. 0 4. 3 4. 6 5. 9 6. 7 T 574 2. 5 3. 5 4. 0 4. 3 5. 4 6. 0 UKMO 2. 1 3. 8 3. 5 3. 0 4. 3 5. 1

RMSE against own analysis 850 h. Pa Meridonal Wind 850 h. Pa 200 h. Pa Model Day 1 Day 3 Day 5 T 382 2. 6 3. 3 3. 7 4. 1 5. 0 5. 5 T 574 2. 2 3. 1 3. 6 3. 9 4. 8 5. 3 UKMO 1. 9 2. 7 3. 2 2. 7 3. 7 4. 3

Factors and methods used In standardized verificatlon of NWP products Verification agalnst analysis Area Northem hemisphere extratropics (90°N ‑ 20°N )(all inclusive) Tropics (20°N ‑ 20°S)(all inclusive) Southem hemisphere extratropics (20°S ‑ 90°S)(all inclusive) Grid Verifying analysis is the centre's on a latitude‑longitude grid 2. 5° x 2. 5°; origin (0°, 0°) Variables MSL pressure, geopotential height, temperature, winds Levels Extratropics: MSL, 500 h. Pa, 250 h. Pa

Verification against observations The seven networks used in verification against radiosondes consist of radiosondes stations Iying within the following geographical area: North America 145°W Europe/North Africa 28°E Asia 145°E Australia/New Zealand 25°N ‑ 60°N 50°W ‑ 25°N ‑ 70°N 10°W ‑ 25°N ‑ 65°N 60°E ‑ 10°S ‑ 55°S 90°E ‑

Anomaly correlation of 10 day forecasts of 500 h. Pa Geopotential Height over the Northern Hemisphere from the T 382 (black line) and T 574 (red line) GFS The anomaly correlation values are comparatively higher in the T 574 GFS with a gain of 1 day in the skill of the forecasts. In the lower panel the line plot depicts the difference of the forecasts of Geopotential Height of the T 574 GFS from the T 382 GFS. The difference values outside the histograms are statistically significant at 95% level of confidence.

RMSE of 10 day forecasts of 850 h. Pa Zonal Wind over the Regional Specialized Meteorological Centre (RSMC) region from the T 382 (black line) and T 574 (red line) GFS The RMSE values are comparatively lower in the T 574 GFS with a gain of 1 day in the skill of the forecasts. In the lower panel the line plot depicts the difference of the forecasts of Zonal Wind of the T 574 GFS from the T 382 GFS. The difference values outside the histograms are statistically significant at 95% level of confidence.

Verification of Day 01 -05 Forecast against Observations over Tropics Root Mean Square Error (RMSE) 850 h. Pa winds in m/s JUNE 2011 Model Day 1 Day 2 Day 3 Day 4 Day 5 ECMWF 3. 6 3. 7 4. 0 4. 2 4. 5 UKMO 3. 7 4. 0 4. 4 4. 8 5. 0 NCEP 3. 8 4. 2 4. 5 4. 8 5. 0 NCMRWF 3. 8 T 574 4. 1 4. 5 4. 7 4. 9
 Root Mean Square")
Verification of Day 03 Forecasts against Radiosondes over India (2005 -2011) Root Mean Square Error (RMSE) of 850 h. Pa winds in m/s T 80 T 254 T 382 T 574

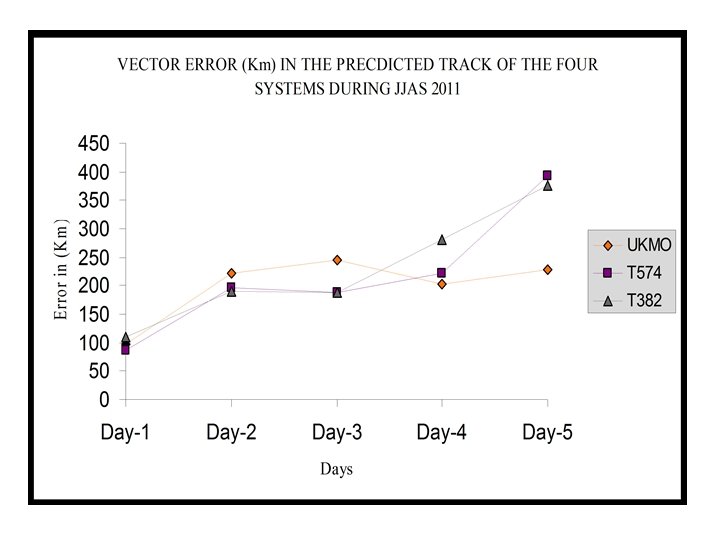
Monsoon Depressions

Track Errors


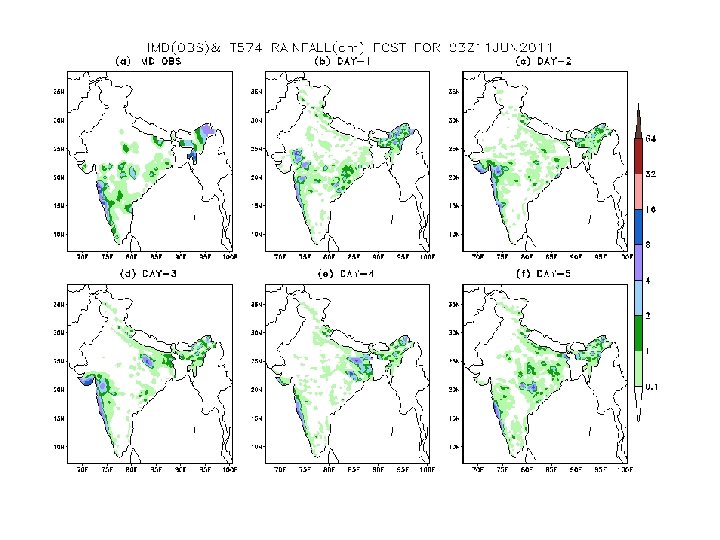
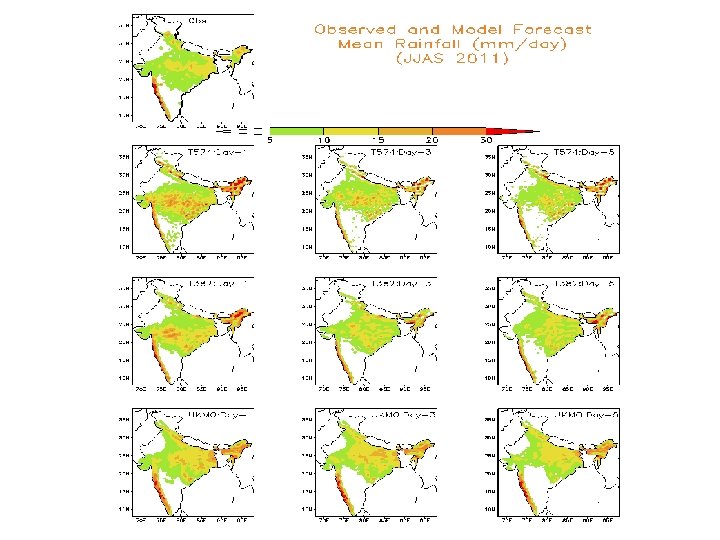
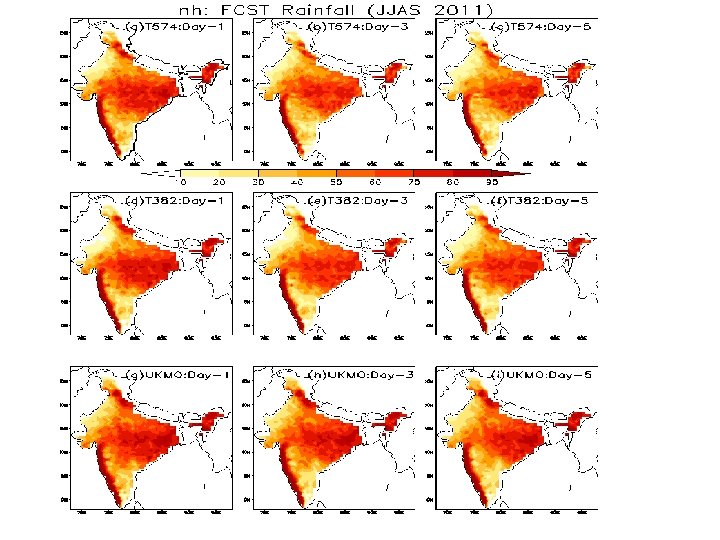
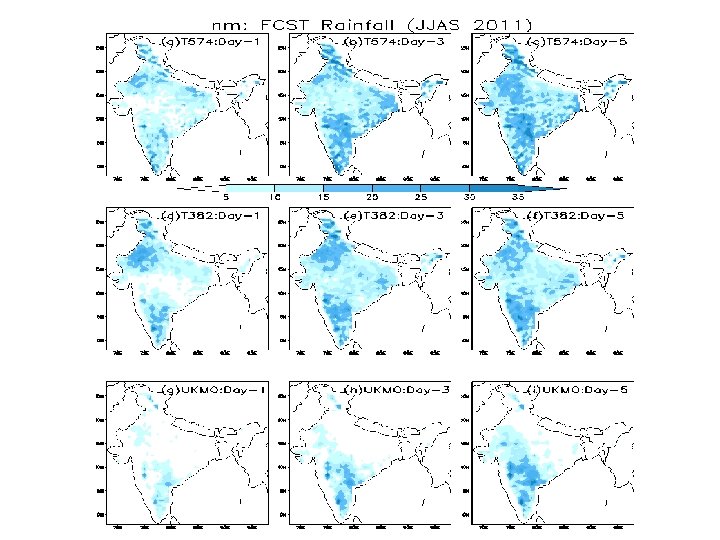
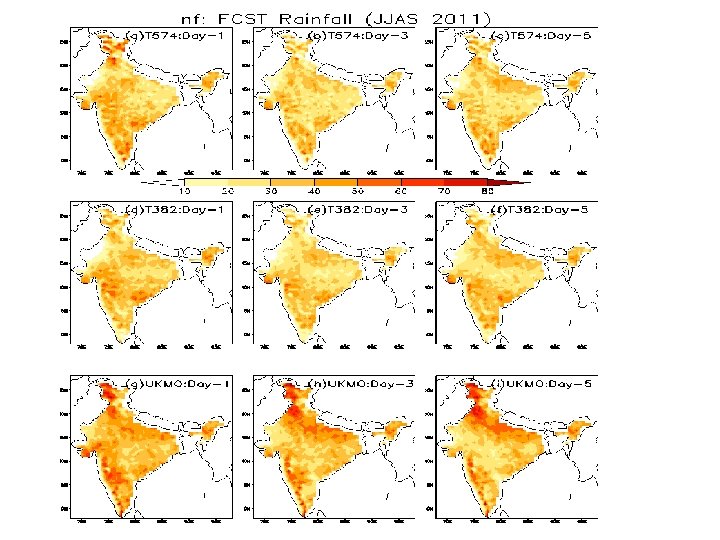
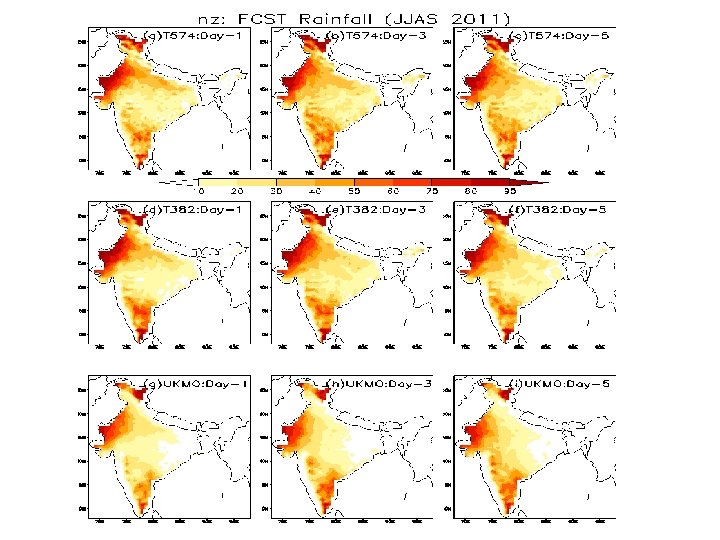
RAINFALL FORECAST VERIFICATION DURING MONSOON 2011: T 382, T 574 & UKMO • A detailed and quantitative rainfall forecast verification has been made using the IMD's 0. 5° daily rainfall data for the entire period of JJAS 2011.
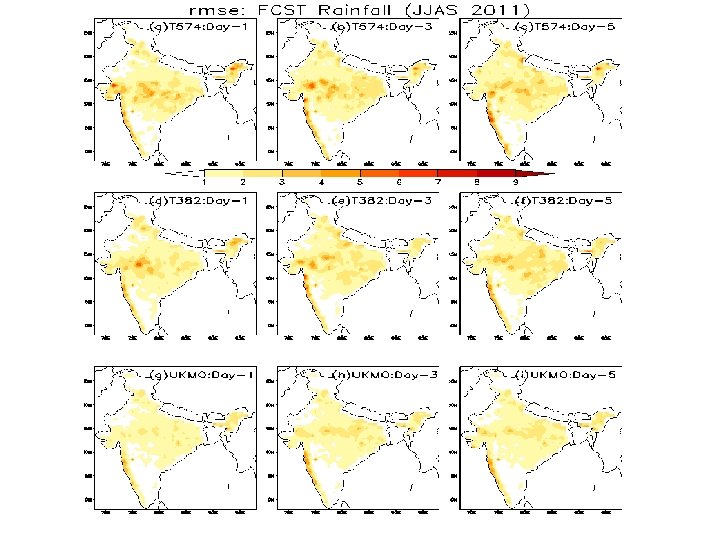

UKMO T 382 T 574 Model Day-1 Day-3 Day-5 T 574 0. 90 0. 82 0. 73 T 382 0. 81 0. 79 0. 72 UKMO 0. 91 0. 86 0. 80
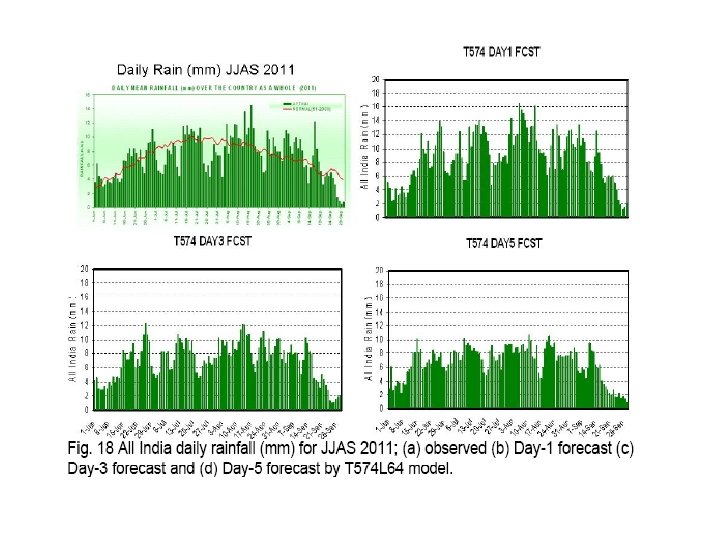
, Monthly (b) and weekly (c) rainfall (mm) predicted by T 574 L")
Seasonal (a), Monthly (b) and weekly (c) rainfall (mm) predicted by T 574 L 64 model for Monsoon-2011 against observed and long period average (climatology). Weekly rainfall is accumulated 7 -day forecast from single initial conditions of every week.
 events, an event")
Forecasts of rain meeting or exceeding specified thresholds For binary (yes/no) events, an event ("yes") is defined by rainfall greater than or equal to the specified threshold; otherwise it is a non-event ("no"). The joint distribution of observed and forecasts events and non-events is shown by the categorical contingency table. OBSERVED YES FORECAST YES NO NO hits false alarms misses correct rejections OBSERVED YES OBSERVED NO FORECAST YES FORECAST NO
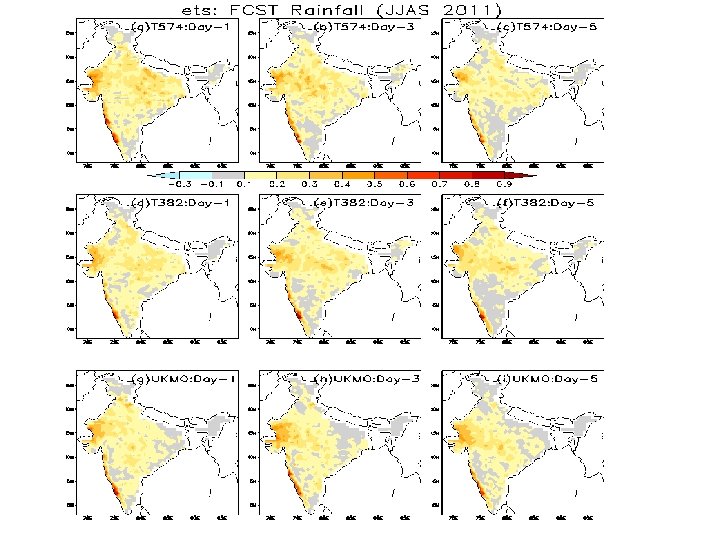

ETS for the predicted rainfall during JJAS 2011
 2) 3) 4) 5) 6) 7) ALL-INDIA (Lon:")
IMD GFS Verification - Areas 1) 2) 3) 4) 5) 6) 7) ALL-INDIA (Lon: 68 E – 98 E, Lat: 9 N – 37 N) Central India (Lon: 75 E – 80 E, Lat: 19 – 24 N) East India (Lon: 83 E -88 E, Lat: 20 N -25 N) North East India (Lon: 90 E – 95 E, Lat: 24 N -29 N) North West India (Lon: 75 E – 80 E, Lat: 25 N -30 N) South Peninsula India (Lon: 76 E - 81 E, Lat: 12 N- 17 N) West Coast of India (Lon: 70 E - 75 E, Lat: 13 N - 18 N)

ALL India : Weekly Cumulative Rainfall (Lon: 68 E – 98 E, Lat: 9 N – 37 N)
 (Lon: 75 E")
(Lon: 90 E – 95 E, Lat: 24 N -29 N) (Lon: 75 E – 80 E, Lat: 19 – 24 N)
 (Lon: 75 E –")
(Lon: 83 E -88 E, Lat: 20 N -25 N) (Lon: 75 E – 80 E, Lat: 25 N -30 N)
 (Lon: 76")
(Lon: 70 E - 75 E, Lat: 13 N - 18 N) (Lon: 76 E - 81 E, Lat: 12 N- 17 N)

CC : 7 Day Cumulative Rainfall of GFS T 382 &T 574 vs. Observation
 (Lon: 70 E")
(Lon: 90 E – 95 E, Lat: 24 N -29 N) (Lon: 70 E - 75 E, Lat: 13 N - 18 N) (Lon: 83 E -88 E, Lat: 20 N -25 N) ((Lon: 75 E – 80 E, Lat: 19 – 24 N) (Lon: 76 E - 81 E, Lat: 12 N- 17 N) (Lon: 75 E – 80 E, Lat: 25 N -30 N)

GFS T 574 : 168 -72 hr F/c shows a FALSE ALARM of Cyclonic Storm over Arabian sea on 6 June 2011 Analysis of 6 June 2011

GFS T 574: Daily Error in Maximum and Minimum Temperature over North-East India (Lon: 90 E – 95 E, Lat: 24 N -29 N) (Lon: 75 E – 80 E, Lat: 25 N -30 N) Tmax (Top) and Tmin (bottom) over North-East India Both Tmax and Tmin mostly under predicts in all 4 months i. e. from 1 June to 30 Sep 2011

GFS T 574: Seasonal Mean Error in Maximum and Minimum Temperature over different Homogeneous regions of India Mean Absolute Error (MAE) of Tmax (top) and Tmin (bottom) For 1 June to 30 September, 2011

Conclusions • The vertical profile of T 574 L 64 analyses and first guesses fits to radio-sonde observation for JJAS 2011 shows improvement over T 382 L 64 analyses. • The RMSE values of fields of T 574 L 64 forecasts against analyses and observations show improvements over T 382 L 64 forecasts Equitable Threat Square (ETS) computed for different rainfall thresholds shows that UKMO has higher skill score as compared with T 382 and T 574 for rainfall threshold >1. 0 cm/day. For rainfall intensity of 0. 01 cm/day all three models feature high ETS (>0. 6) for all days forecast. T 574 shows better skill score then T 382 for all the rainfall intensities for all days. The impact of more satellite data incorporated in T 574 L 64, especially the AMVs over the tropics, is more evident in T 574 L 64 analysis and forecasts when compared to the T 382 L 64 system.
 • • VAD winds from Indian Doppler Weather Radar. Oscat")
Future data plans (NCMRWF) • • VAD winds from Indian Doppler Weather Radar. Oscat winds (Oceansat-2 scatterometer) INSAT / Kalpana AMV Precipitation rates from MADRAS-MT GEOS Sounder data Radiances from INSAT-3 D and MT Preparing plans for Indian Doppler Weather Radar

NCMRWF wish list • Future NCEP upgrades in dynamics/physics? • Higher resolutions? (T 764 L 91? T 1148 L 91/ Semi_Lagrangian? ) • Diversification ? (GEFS, Hybrid GSI-En. KF VA system) • More diagnostics and verifications? • Sensitivity studies and physics improvements? • Participation in National/international compaigns/experiments? (MJOWG, MT)

IMD plans • GFS T 574 • EPS T 382 • MME based on EPS Thrust Area: Probabilistic Forecast of high impact weather in short to medium range time scale

Hurricane WRF Model The HWRF model has been implemented at the India Meteorological Department (IMD) following the Implementation Agreement (IA) between India’s Ministry of Earth Sciences (Mo. ES) and USA’s National Oceanic and Atmospheric Administration (NOAA) with an objective to provide improved tropical cyclone prediction capability for the Bay of Bengal and Arabian Sea regions. Under the program Dr Vijay Kumar and Dr Zhang, EMC, NCEP, USA were on deputation to IMD, New Delhi in July 2011 for technology transfer of HWRF model system and provide training on initial operating capability of HWRF model. The basic version of the model HWRFV(3. 2+) which was operational at EMC, NCEP was ported on IBM P-6/575 machine, IMD with nested domain of 27 km and 9 km horizontal resolution and 42 vertical levels with outer domain covering the area of 800 x 800 for NIO and inner domain 60 x 60 with centre of the system adjusted to the centre of the observed cyclonic storm. HWRF model successfully tested for two Bay of Bengal TC cases JAL (4 -8 Nov 2010), GIRI (21 -22 Oct 2010) with vortex initialization and 6 hourly cyclic mode using the NCEP GFS data provided EMC team and also tested with IMD GFS spectral fields. The Atmospheric HWRF model was made operational (Experimental) to run real-time during the cyclone season-2011. The Ocean Model and Coupler is to be implement for Indian Ocean region (regional MOM) in collaboration with EMC, NCEP and Indian National Centre for Ocean Information Services (INCOIS), Ministry of Earth Sciences, Hyderabad, India by April 2012. Testing of the atmospheric HWRF model for the last 5 years Cyclonic Storm formed over Arabian Sea and Bay of Bengal for 6 to 8 cases with vortex initialization and 6 hourly cycling of forecast runs for each case with total 70 to 80 runs using the initial and boundary from NCEP GFS spectral fields are expected to be completed by the end of January 2012 and a joint report will be prepared by the end of February 2012.

THANKS
- Slides: 85