Performance monitoring using intel performance counters for HEP





- Slides: 12

Performance monitoring using intel performance counters for HEP applications Khadidja Hadj henni Supervised by : Pablo Llopis Sanmillan 15/08/2018 1

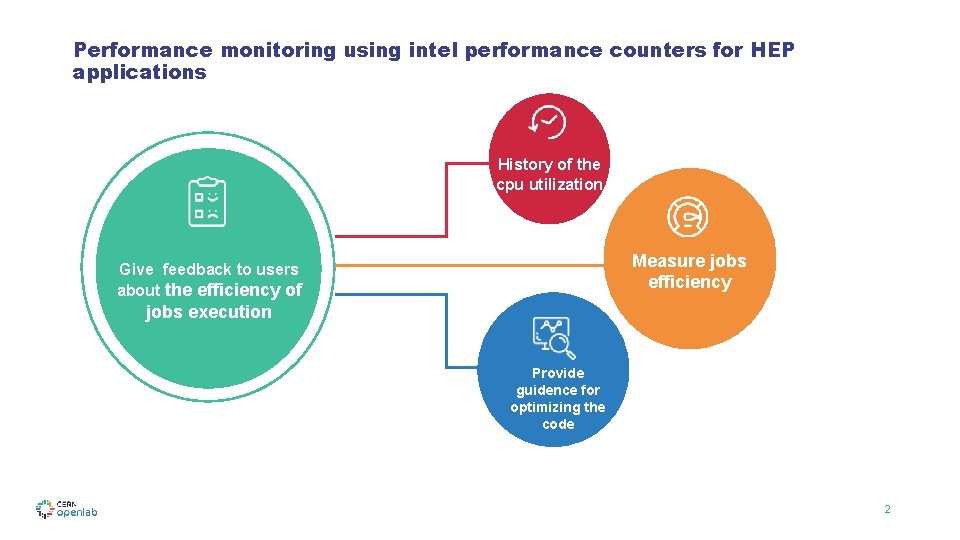
Performance monitoring using intel performance counters for HEP applications History of the cpu utilization Measure jobs efficiency Give feedback to users CMefficiency Section of about the jobs execution IS service Provide guidence for optimizing the code 2

Diving IN ! historic data from the cluster CM Section IS service How to measure the performance and the execution efficiency of an application ? 3

Measurement of the efficiency of resource utilization Ressource utilisation metrics Used CPUs Number of nodes used Number of nodes allocated User Cpu Time System Cpu Time Total Cpu Time Elapsed x NCPUs Allocated CPUs 4

Measurement of the efficiency of resource utilization historic data from the cluster Resource utilization efficiency =1 High Flops High efficiency Resource utilization efficiency =1 Low Flops Low efficiency 5

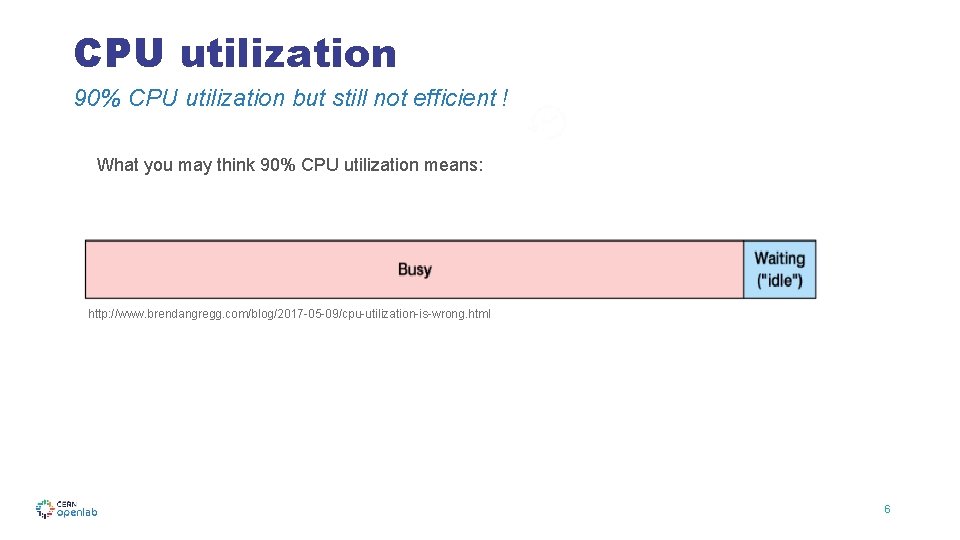
CPU utilization 90% CPU utilization but still not efficient ! What you may think 90% CPU utilization means: historic data from the cluster VS http: //www. brendangregg. com/blog/2017 -05 -09/cpu-utilization-is-wrong. html 6

CPU utilization 90% CPU utilization but still not efficient ! historic data from the cluster What it might really mean: VS http: //www. brendangregg. com/blog/2017 -05 -09/cpu-utilization-is-wrong. html 7

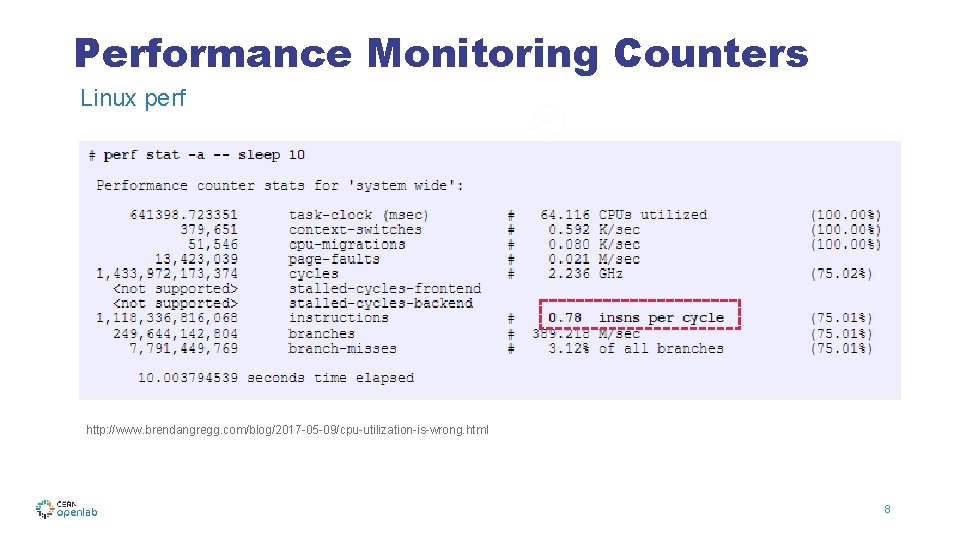
Performance Monitoring Counters Linux perf historic data from the cluster http: //www. brendangregg. com/blog/2017 -05 -09/cpu-utilization-is-wrong. html 8

Roofline Performance Model GFLOPs/S Peak GFLOPs/S d wi th /S B G d n Ba Arithmetic intensity (FLOPs/Byte) 9

Roofline Performance Model GFLOPs/S Peak GFLOPs/S d wi th /S B G d n Ba bandwidth bound Compute bound Arithmetic intensity (FLOPs/Byte) 10

Roofline Performance Model Roofline Model of HPC batch nodes 11

THANK YOU! khadidja. hadj. henni@cern. ch 12