
Performance Model for Parallel Matrix Multiplication with Dryad




- Slides: 28
Performance Model for Parallel Matrix Multiplication with Dryad: Dataflow Graph Runtime Hui Li School of Informatics and Computing Indiana University 11/1/2012
Outline Dryad Dataflow Runtime Dryad Deployment Environment Performance Modeling Fox Algorithm of PMM Modeling Communication Overhead Results and Evaluation
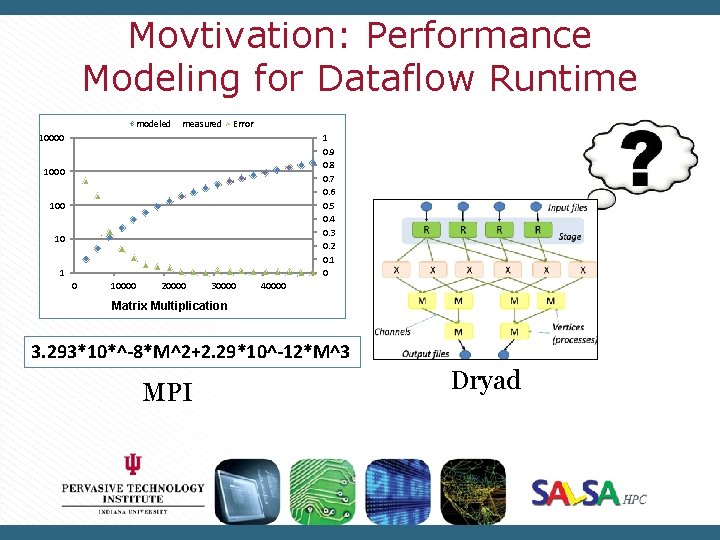
Movtivation: Performance Modeling for Dataflow Runtime modeled measured Error 10000 1 0. 9 0. 8 0. 7 0. 6 0. 5 0. 4 0. 3 0. 2 0. 1 0 100 10 1 0 10000 20000 30000 40000 Matrix Multiplication 3. 293*10*^-8*M^2+2. 29*10^-12*M^3 MPI Dryad
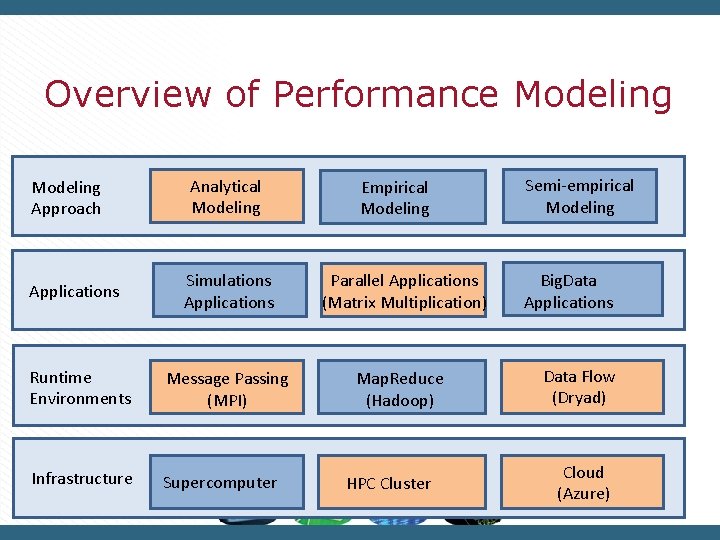
Overview of Performance Modeling Approach Analytical Modeling Empirical Modeling Simulations Applications Parallel Applications (Matrix Multiplication) Runtime Environments Message Passing (MPI) Map. Reduce (Hadoop) Infrastructure Supercomputer Applications HPC Cluster Semi-empirical Modeling Big. Data Applications Data Flow (Dryad) Cloud (Azure)
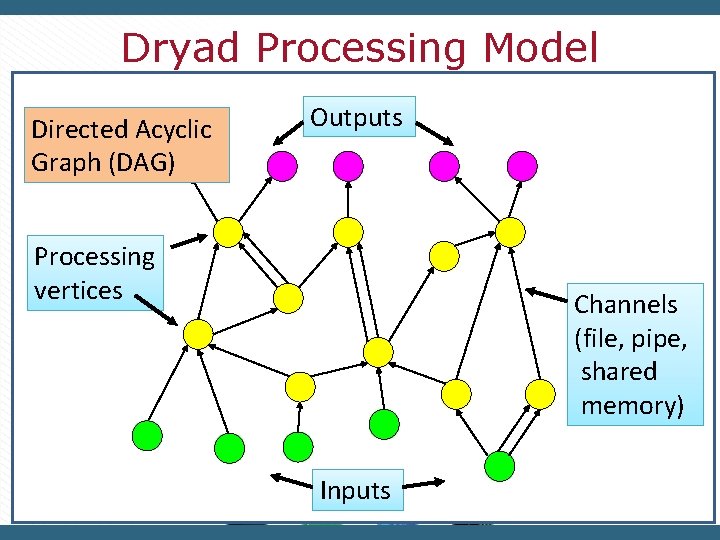
Dryad Processing Model Directed Acyclic Graph (DAG) Outputs Processing vertices Channels (file, pipe, shared memory) Inputs
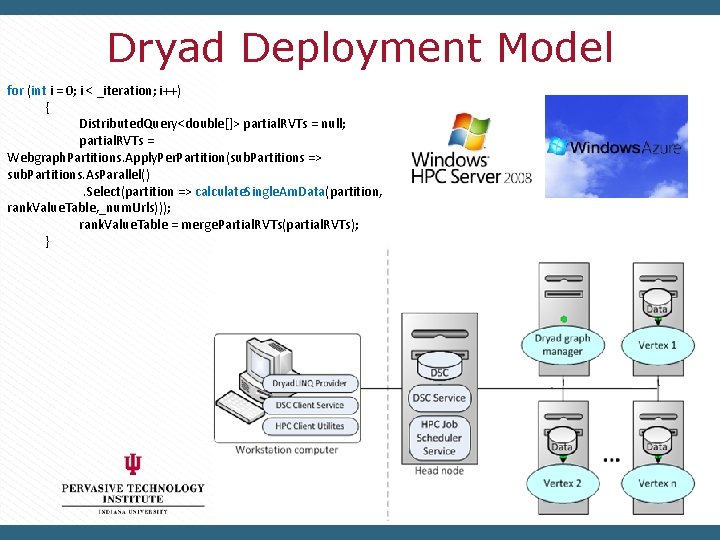
Dryad Deployment Model for (int i = 0; i < _iteration; i++) { Distributed. Query<double[]> partial. RVTs = null; partial. RVTs = Webgraph. Partitions. Apply. Per. Partition(sub. Partitions => sub. Partitions. As. Parallel(). Select(partition => calculate. Single. Am. Data(partition, rank. Value. Table, _num. Urls))); rank. Value. Table = merge. Partial. RVTs(partial. RVTs); }
Dryad Deployment Environment Windows HPC Cluster Low Network Latency Low System Noise Low Runtime Performance Fluctuation Azure High Network Latency High System Noise High Runtime Performance Fluctuation
Steps of Performance Modeling for Parallel Applications Identify parameters that influence runtime performance (runtime environment model) Identify application kernels (problem model) Determine communication pattern, and model the communication overhead Determine communication/computation overlap to get more accurate modeled results
Step 1 -a: Parameters affect Runtime Performance Latency Time delay to access remote data or service Runtime overhead Critical path work to required to manage parallel physical resources and concurrent abstract tasks Communication overhead Overhead to transfer data and information between processes Critical to performance of parallel applications Determined by algorithm and implementation of communication operations
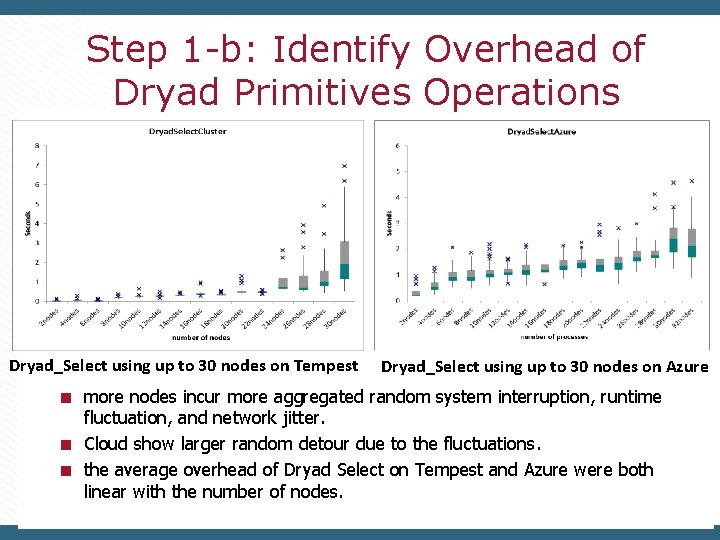
Step 1 -b: Identify Overhead of Dryad Primitives Operations Dryad use flat tree to broadcast messages to all of its vertices Dryad_Select using up to 30 nodes on Tempest Dryad_Select using up to 30 nodes on Azure more nodes incur more aggregated random system interruption, runtime fluctuation, and network jitter. Cloud show larger random detour due to the fluctuations. the average overhead of Dryad Select on Tempest and Azure were both linear with the number of nodes.
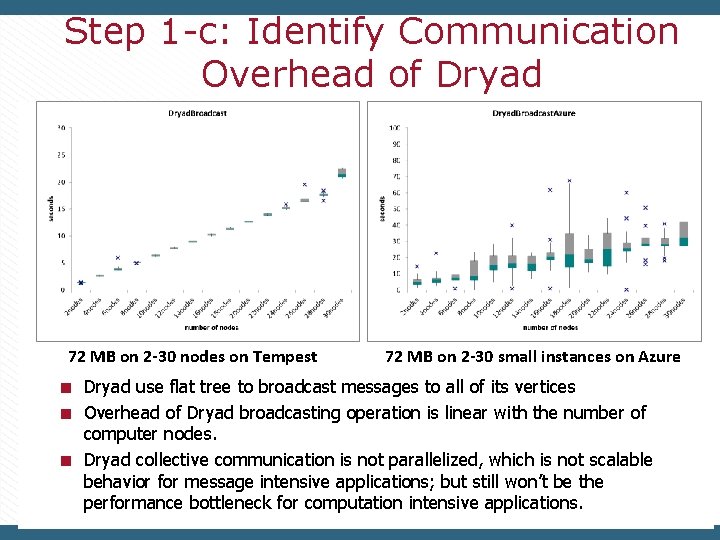
Step 1 -c: Identify Communication Overhead of Dryad 72 MB on 2 -30 nodes on Tempest 72 MB on 2 -30 small instances on Azure Dryad use flat tree to broadcast messages to all of its vertices Overhead of Dryad broadcasting operation is linear with the number of computer nodes. Dryad collective communication is not parallelized, which is not scalable behavior for message intensive applications; but still won’t be the performance bottleneck for computation intensive applications.
Step 2: Fox Algorithm of PMM Pseudo Code of Fox algorithm: Partitioned matrix A, B to blocks For each iteration i: 1) broadcast matrix A block (j, i) to row j 2) compute matrix C blocks, and add the partial results to the previous result of matrix C block 3) roll-up matrix B block Also named BMR algorithm, Geoffrey Fox gave the timing model in 1987 for hypercube machine has well established communication and computation pattern
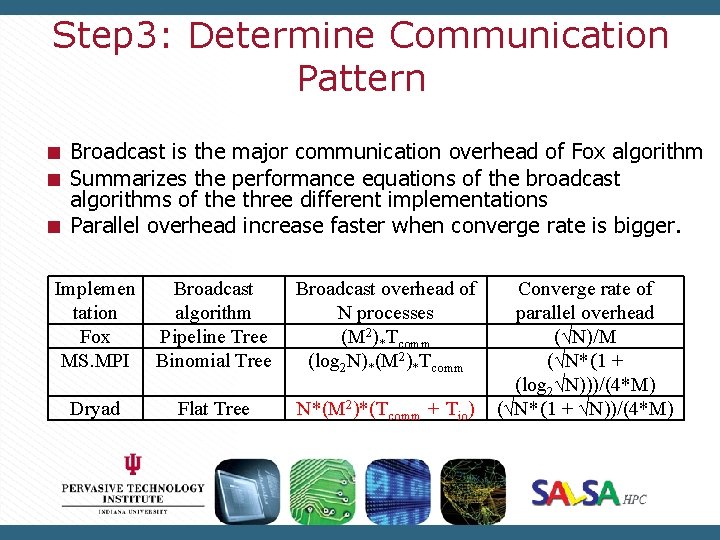
Step 3: Determine Communication Pattern Broadcast is the major communication overhead of Fox algorithm Summarizes the performance equations of the broadcast algorithms of the three different implementations Parallel overhead increase faster when converge rate is bigger. Implemen tation Fox MS. MPI Broadcast algorithm Pipeline Tree Binomial Tree Broadcast overhead of N processes (M 2)*Tcomm (log 2 N)*(M 2)*Tcomm Dryad Flat Tree N*(M 2)*(Tcomm + Tio) Converge rate of parallel overhead (√N)/M (√N*(1 + (log 2√N)))/(4*M) (√N*(1 + √N))/(4*M)
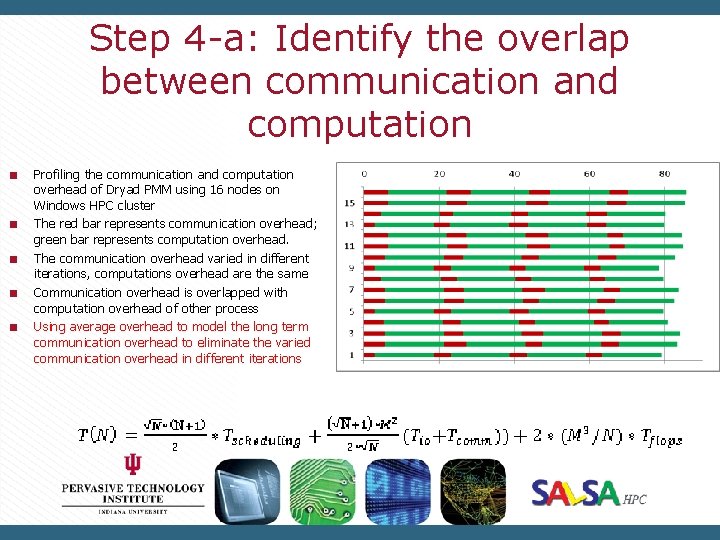
Step 4 -a: Identify the overlap between communication and computation Profiling the communication and computation overhead of Dryad PMM using 16 nodes on Windows HPC cluster The red bar represents communication overhead; green bar represents computation overhead. The communication overhead varied in different iterations, computations overhead are the same Communication overhead is overlapped with computation overhead of other process Using average overhead to model the long term communication overhead to eliminate the varied communication overhead in different iterations
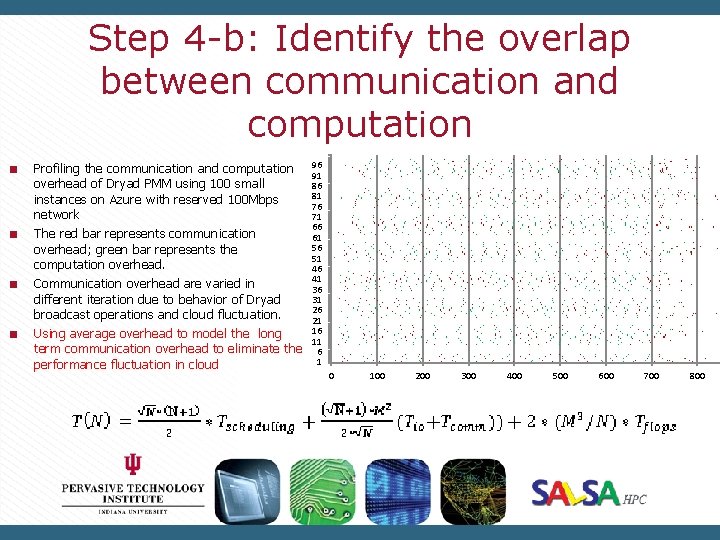
Step 4 -b: Identify the overlap between communication and computation Profiling the communication and computation overhead of Dryad PMM using 100 small instances on Azure with reserved 100 Mbps network The red bar represents communication overhead; green bar represents the computation overhead. Communication overhead are varied in different iteration due to behavior of Dryad broadcast operations and cloud fluctuation. Using average overhead to model the long term communication overhead to eliminate the performance fluctuation in cloud 96 91 86 81 76 71 66 61 56 51 46 41 36 31 26 21 16 11 6 1 0 100 200 300 400 500 600 700 800
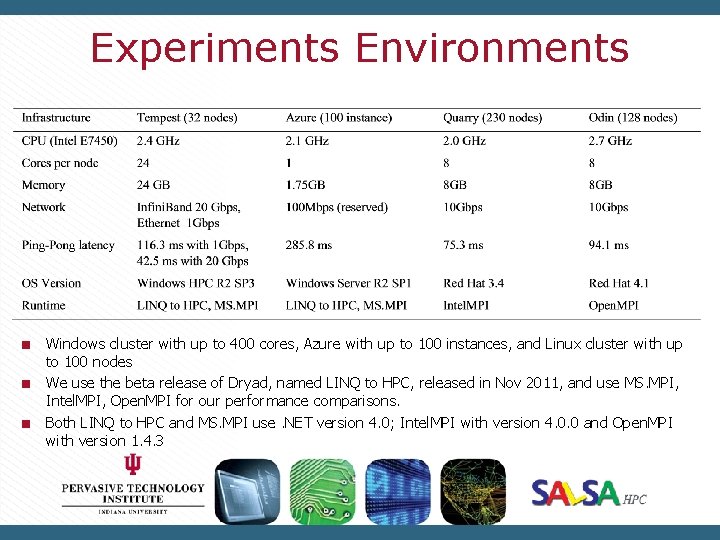
Experiments Environments Windows cluster with up to 400 cores, Azure with up to 100 instances, and Linux cluster with up to 100 nodes We use the beta release of Dryad, named LINQ to HPC, released in Nov 2011, and use MS. MPI, Intel. MPI, Open. MPI for our performance comparisons. Both LINQ to HPC and MS. MPI use. NET version 4. 0; Intel. MPI with version 4. 0. 0 and Open. MPI with version 1. 4. 3
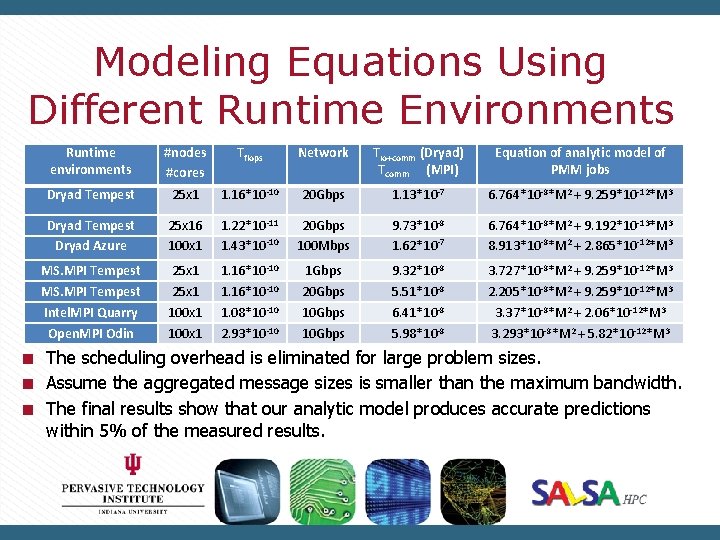
Modeling Equations Using Different Runtime Environments Runtime environments #nodes #cores Tflops Network Tio+comm (Dryad) Tcomm (MPI) Equation of analytic model of PMM jobs Dryad Tempest 25 x 1 1. 16*10 -10 20 Gbps 1. 13*10 -7 6. 764*10 -8*M 2 + 9. 259*10 -12*M 3 Dryad Tempest Dryad Azure 25 x 16 100 x 1 1. 22*10 -11 1. 43*10 -10 20 Gbps 100 Mbps 9. 73*10 -8 1. 62*10 -7 6. 764*10 -8*M 2 + 9. 192*10 -13*M 3 8. 913*10 -8*M 2 + 2. 865*10 -12*M 3 MS. MPI Tempest 25 x 1 1. 16*10 -10 1 Gbps 9. 32*10 -8 3. 727*10 -8*M 2 + 9. 259*10 -12*M 3 MS. MPI Tempest 25 x 1 1. 16*10 -10 20 Gbps 5. 51*10 -8 2. 205*10 -8*M 2 + 9. 259*10 -12*M 3 Intel. MPI Quarry 100 x 1 1. 08*10 -10 10 Gbps 6. 41*10 -8 3. 37*10 -8*M 2 + 2. 06*10 -12*M 3 Open. MPI Odin 100 x 1 2. 93*10 -10 10 Gbps 5. 98*10 -8 3. 293*10 -8*M 2 + 5. 82*10 -12*M 3 The scheduling overhead is eliminated for large problem sizes. Assume the aggregated message sizes is smaller than the maximum bandwidth. The final results show that our analytic model produces accurate predictions within 5% of the measured results.
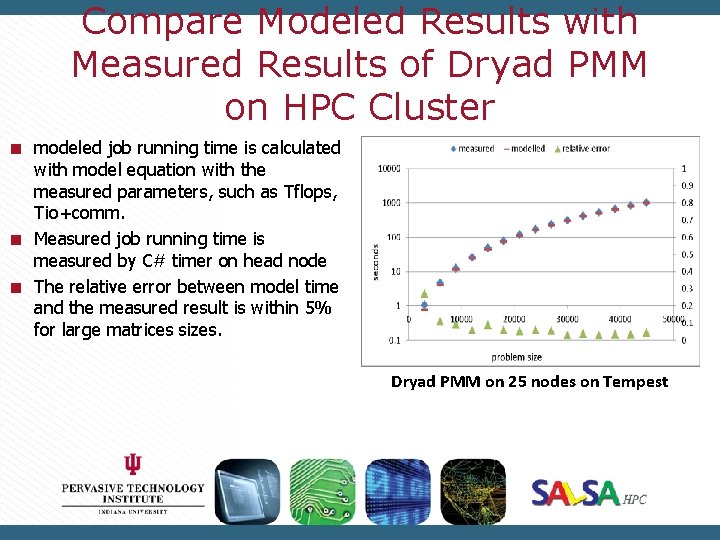
Compare Modeled Results with Measured Results of Dryad PMM on HPC Cluster modeled job running time is calculated with model equation with the measured parameters, such as Tflops, Tio+comm. Measured job running time is measured by C# timer on head node The relative error between model time and the measured result is within 5% for large matrices sizes. Dryad PMM on 25 nodes on Tempest
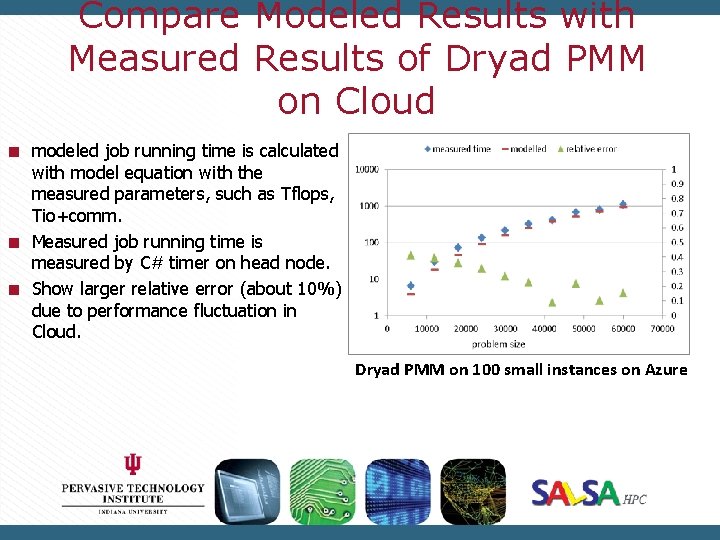
Compare Modeled Results with Measured Results of Dryad PMM on Cloud modeled job running time is calculated with model equation with the measured parameters, such as Tflops, Tio+comm. Measured job running time is measured by C# timer on head node. Show larger relative error (about 10%) due to performance fluctuation in Cloud. Dryad PMM on 100 small instances on Azure
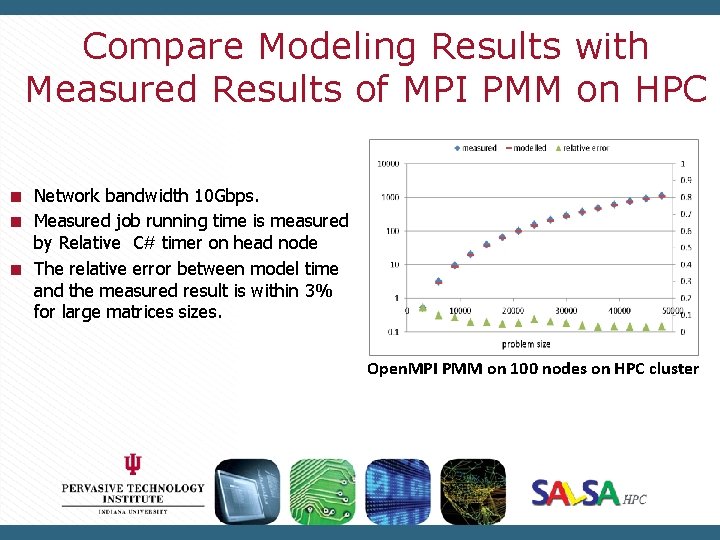
Compare Modeling Results with Measured Results of MPI PMM on HPC Network bandwidth 10 Gbps. Measured job running time is measured by Relative C# timer on head node The relative error between model time and the measured result is within 3% for large matrices sizes. Open. MPI PMM on 100 nodes on HPC cluster
Conclusions We proposed the analytic timing model of Dryad implementations of PMM in realistic settings. Performance of collective communications is critical to model parallel application. We proved some cases that using average communication overhead to model performance of parallel matrix multiplication jobs on HPC clusters and Cloud is the practical approach
Acknowledgement Advisor: Geoffrey Fox, Judy Qiu Dryad Team@Microsoft External Research UITS@IU Ryan Hartman, John Naab SALSAHPC Team@IU Yang Ruan, Yuduo Zhou
Question? Thank you!
Backup Slides
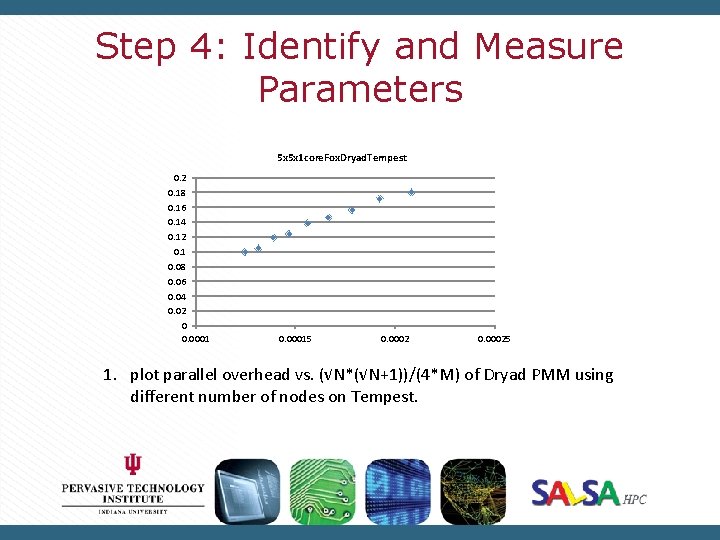
Step 4: Identify and Measure Parameters 5 x 5 x 1 core. Fox. Dryad. Tempest 0. 2 0. 18 0. 16 0. 14 0. 12 0. 1 0. 08 0. 06 0. 04 0. 02 0 0. 00015 0. 00025 1. plot parallel overhead vs. (√N*(√N+1))/(4*M) of Dryad PMM using different number of nodes on Tempest.
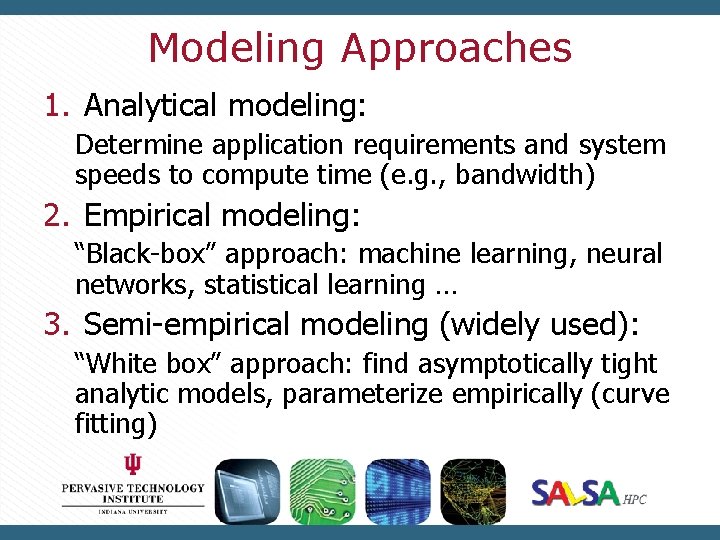
Modeling Approaches 1. Analytical modeling: Determine application requirements and system speeds to compute time (e. g. , bandwidth) 2. Empirical modeling: “Black-box” approach: machine learning, neural networks, statistical learning … 3. Semi-empirical modeling (widely used): “White box” approach: find asymptotically tight analytic models, parameterize empirically (curve fitting)
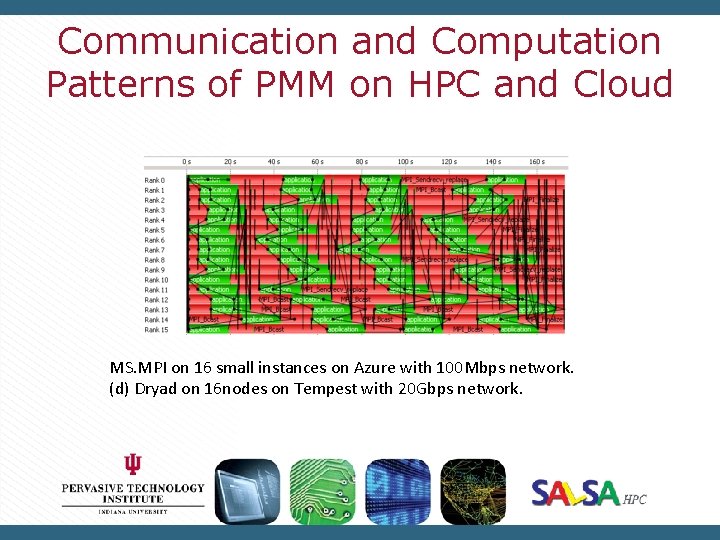
Communication and Computation Patterns of PMM on HPC and Cloud MS. MPI on 16 small instances on Azure with 100 Mbps network. (d) Dryad on 16 nodes on Tempest with 20 Gbps network.
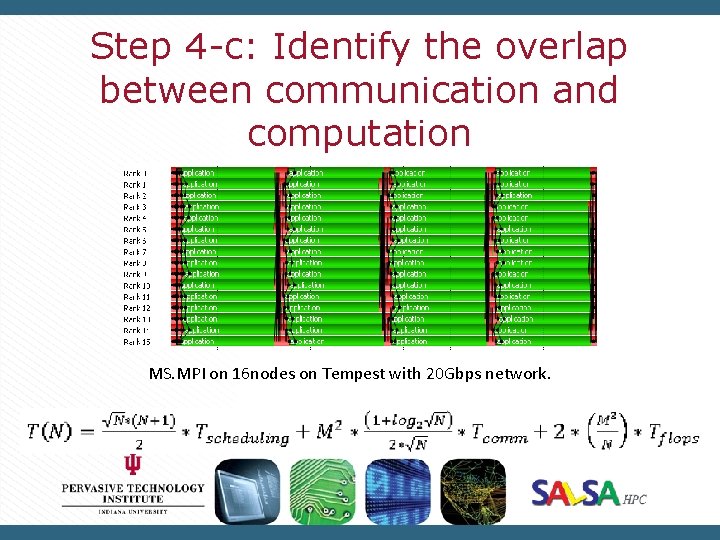
Step 4 -c: Identify the overlap between communication and computation MS. MPI on 16 nodes on Tempest with 20 Gbps network.