Performance measures Managerial Accounting David Fender A subunit

Performance measures Managerial Accounting David Fender

A subunit in an organization whose manager is held accountable for specified financial results.

Accountability Authority

Cost Center Revenue Center Segment has control over the incurrence of costs. Segment is responsible for the revenue of a unit. The Paint Department in an automobile plant. The Reservations Department of an airline

Profit Center Investment Center Segment has control over both costs and revenues. Segment has control over profits and invested capital. Company-owned restaurant in a fast-food chain. A division of a large corporation.

Evaluation Tool Cost Center Cost standards Profit Center Contribution income statement Investment Center Rate of return on invested funds or residual income

Cost Decision Rights oinput mix Revenue oproduct mix odistribution channel oprice Profit Investment oinput mix oproduct mix odistribution channel oprice oinput mix oproduct mix oprice ocapital Objective minimize costs maximize revenue maximize profit s. t. investment Performance Measure cost variances revenues profits ROI, RI, EVA

capital invested

ISSUE:

 2009 Pearson Prentice Hall. All rights reserved.")
(c) 2009 Pearson Prentice Hall. All rights reserved.
 Net operating income ROI = Average operating assets")
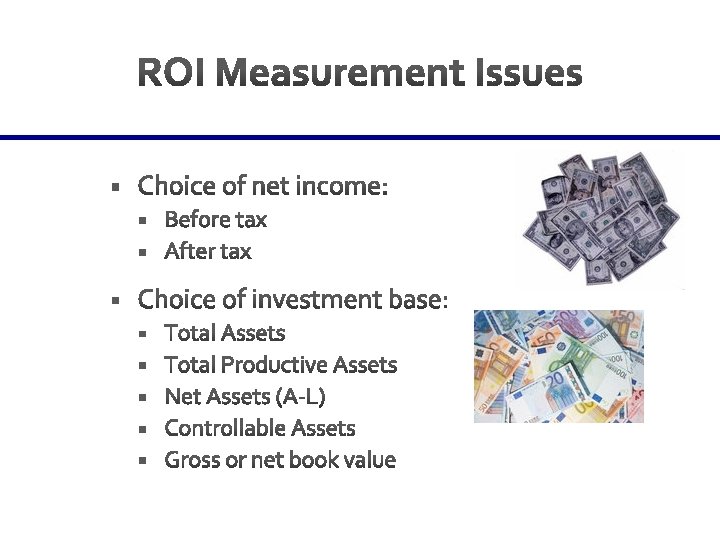
Income before interest and taxes (EBIT) Net operating income ROI = Average operating assets Cash, accounts receivable, inventory, plant and equipment, and other productive assets.

What is the ROI?

Income ROI = Invested Capital ROI = $30, 000 $200, 000 ROI = 15%

Three ways to improve ROI 2. Decrease Expenses 1. Increase Revenues 3. Lower Invested Capital

Income ROI = Invested Capital ROI = Income Sales Revenue Sales Margin Sales Revenue × Invested Capital Turnover
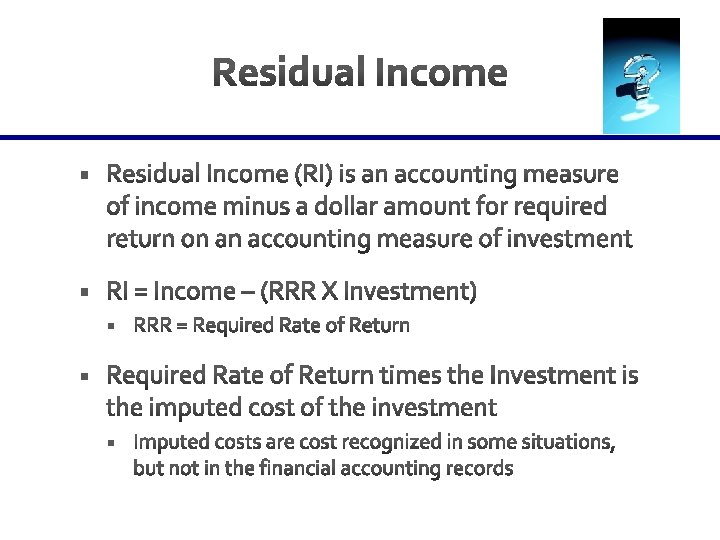
 Residual income measures net operating income earned less the minimum required return")
( ) Residual income measures net operating income earned less the minimum required return on average operating assets. (ROI measures net operating income earned relative to the investment in average operating assets. )

Investment center profit – Investment charge = Residual income Investment capital × Imputed interest rate = Investment charge Investment center’s minimum required rate of return

What is the residual income?

Investment center profit = $25, 000 – Investment charge = 20, 000 = Residual income = $ 5, 000 Investment capital = $100, 000 × Imputed interest rate = 20% = Investment charge = $ 20, 000 Investment center’s minimum required rate of return
 § Harder to compare (because")
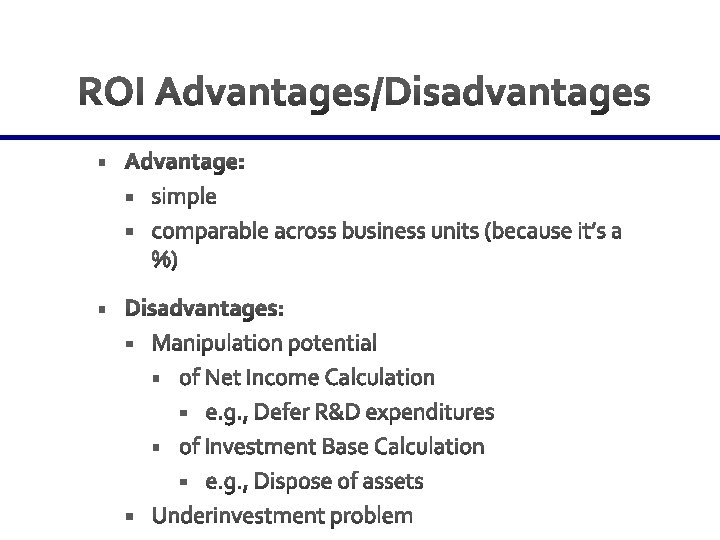
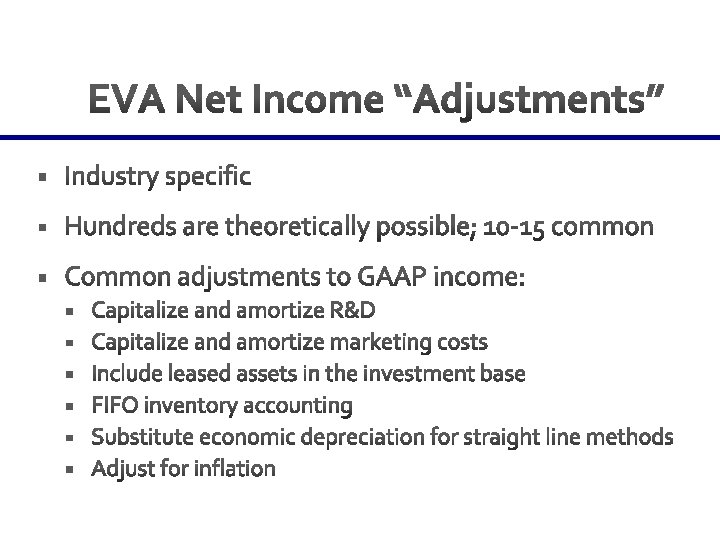
§ Disadvantages: § More complicated (calculating cost of capital) § Harder to compare (because not a %) § Arguably, the manipulation potential is the same § of Net Income Calculation § of Investment Base Calculation § Advantage: § Mitigates the underinvestment problem
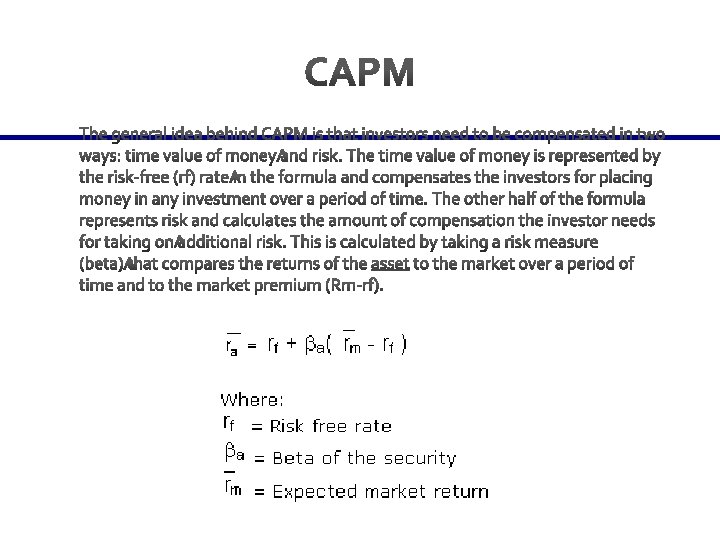

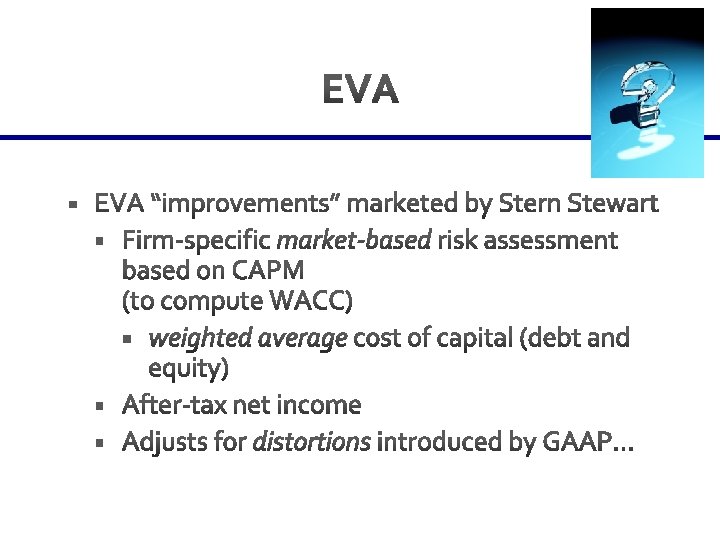
§ Interest rate for equity in RI and EVA is based on the capital asset pricing model (CAPM) § Interest equity = risk free interest rate + risk return Also referred to as “beta” – beta is an indicator of how much a stock changes in relative to changes in the overall market Beta is calculated on historical data For example: a stock has a beta of 0. 5 – this means the stock is less risky than the market; when the market decreases by 10% the stock decreases by 5% - on the same token, when the market increases by 10% the stock increases by 5%

censored
 2009 Pearson Prentice Hall. All rights reserved.")
(c) 2009 Pearson Prentice Hall. All rights reserved.

Investment center’s after-tax operating income – Investment charge = Economic Value Added ( Investment center’s total assets – ) Investment center’s current liabilities Weighted average cost of capital

WACC = % of debt of total capital x Debt interest rate + % of equity of total capital x Equity interest rate

The Atlantic Division of Suncoast Food Centers reported the following results for the most recent period: Compute Atlantic Division’s economic value added.
 ×")
First, let’s compute the weighted-average cost of capital (9% × (1 – 30%) × $40, 000) + (. 12 × $60, 000) $40, 000 + $60, 000 = 0. 0972
 $4, 725, 000 After-tax operating income –")
$6, 750, 000 × (1 – 30%) $4, 725, 000 After-tax operating income – 4, 315, 680 = $ 409, 320 Economic value added ($45, 000 – $600, 000) × 0. 0972 = $4, 315, 680 (9% × (1 – 30%) × $40, 000) + (. 12 × $60, 000) $40, 000 + $60, 000 = 0. 0972
- Slides: 43