Performance Management Refresher Workshop For Elected Members and

Performance Management Refresher Workshop For Elected Members and Board Members

Learning Outcomes • the importance of performance management • determine what can be measured • things you can do with a number • the Public Service Improvement Model • the Council’s performance management framework • what performance reports come to the Council Committees and are available to the public

Workshop Agenda • Performance RESULTS measurement – 40 Min • Intro – 15 min • Exercise – 15 min • Discussion – 10 Min • Performance Indicators in Dundee City Council – 20 Minutes • Examples – 10 Min • Discussion – 10 Min • Management for Continuous Improvement – The Public Service Improvement Framework – 30 min

Performance can hit the headlines

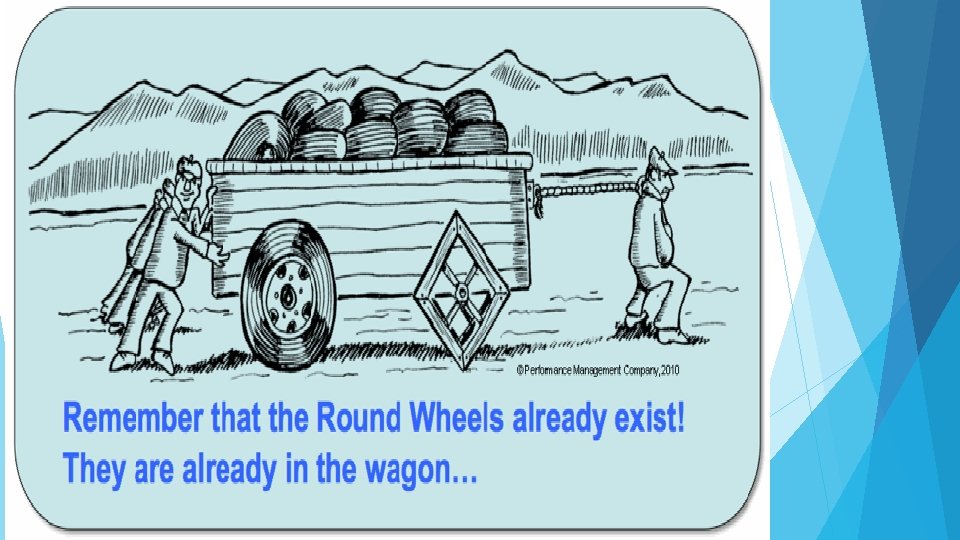
Science of performance

How to identify performance indicators Inputs Cost / Assets People Equipment Materials Buildings Information Processes Speed /Accuracy/Quality Teach Care / Make / Repair Request/Collect/Deliver Pay Request/Allocate Outputs Volume Pupils Population Area Income/Exp. Users Outcomes Benefits Attainment / Achievement Healthier Safer Happier / Needs met Sustainable /(Profit or Saving)

Exercise In groups 1. Take one organisation from the organisation pack Identify at least one key performance measurement you as a board member would like to see data on For An Input A Process A input / output An Outcome 2. After one round pick a persona from the persona pack and go around again designing performance measurements they will be interested in.

How to identify performance indicators Economy Inputs Effectiveness Efficiency Processes Outputs Outcomes Equity Environment Cost / Assets People Equipment Materials Buildings Information Speed /Accuracy/Quality Teach Care / Make / Repair Request/Collect/Deliver Pay Request/Allocate Volume Pupils Population Area Income/Exp. Users Benefits Attainment / Achievement Healthier Safer Sustainable /(Profit or Saving) Satisfaction / Needs met

things about numbers • Clarifies words like some, more, often, • Target up or down – plan improvement? • Trend - compare over time • Compare with other organisations / places • Correlation with another related number • Forecast next

Where do you find performance indicators about the Council ?

How we report on performance - Targets

Example of a Strategic Service Section of the Council Plan % Unemployed People Assisted into work from Council Funded/Operated Employability Programmes 18 16 14 12 10 8 6 4 2 0 2012 -13 2013 -14 2014 -15 2015 -16 2016 -17 2017 -18

Examples from the Local Government Benchmarking Framework Fair Work and Enterprise % Unemployed People Assisted into work from Council Funded/Operated Employability Programmes 18 16 14 12 10 8 6 4 2 0 % Earning less than the living wage % procurement spend on Local enterprises 25 45 40 20 35 30 15 25 20 10 15 10 5 5 0 2012 -13 2013 -14 2014 -15 2015 -16 2016 -17 2017 -18 0 2010 -11 2011 -12 2012 -13 2013 -14 2014 -15 2015 -16 2016 -17 2017 -18 Trends and comparison Dundee Family Group Scotland

Examples from the Local Government Benchmarking Framework Giving children and young people the best start in life Average Total Tariff SIMD Quintile 1 700 600 500 400 300 200 100 0 2011 -12 2012 -13 2013 -14 2014 -15 2015 -16 2016 -17 2017 -18 Trends and comparison Dundee Family Group Scotland

Dundee Performs The Council Public Performance Reporting Duty. We provide a special section of the website where we publish performance indicators , Comparisons with other local authorities and recent performance reports to the Council. We are modelling this on the National Performance Framework

The improvement cycle The cycle begins with the Plan step. This involves identifying a goal or purpose, formulating a theory, defining success metrics and putting a plan into action. These activities are followed by the Do step, in which the components of the plan are implemented, such as designing a new service. Next comes the Study step, where outcomes are monitored to test the validity of the plan for signs of progress and success, or problems and areas for improvement. The Act step closes the cycle, integrating the learning generated by the entire process, which can be used to adjust the goal, change methods, reformulate a theory altogether, or broaden the learning – improvement cycle from a small-scale experiment to a larger implementation Plan. These four steps can be repeated over and over as part of a never-ending cycle of continual learning and improvement.

Thoughts on management of performance and improvement

PSIF Public Service Improvement Framework Elected Members Training Sandra Lorimer March 2019

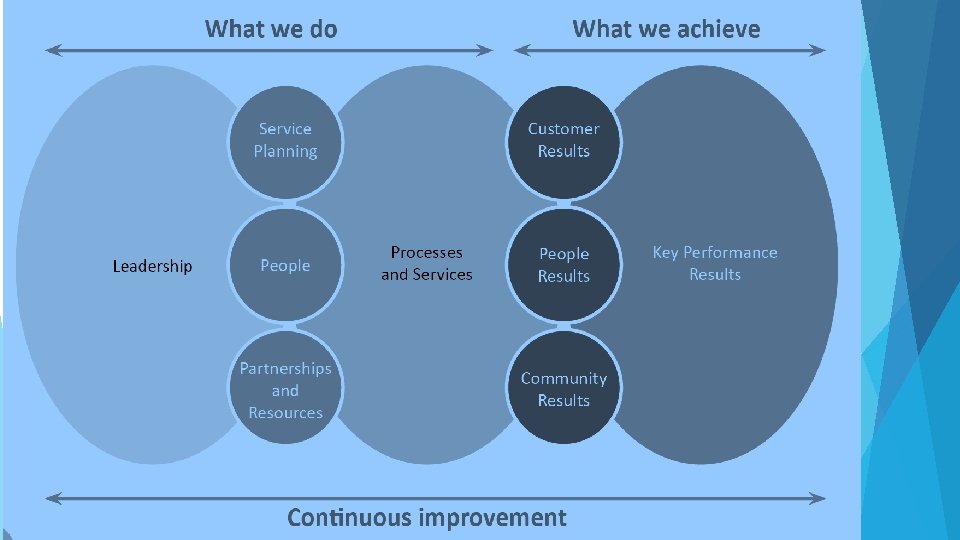
INTRODUCTION PSIF is a national performance improvement model using a self-assessment approach. Origins are EFQM Excellence Model PSIF encourages organisations to conduct a comprehensive review of their own activities and results. Promotes a holistic approach to continuous improvement Examines 6 key business themes PSIF IS NOT AN AUDIT

PSIF & Dundee City Council Management Team agreed a programme for PSIF All services to undertake an assessment Aim to deliver 4 per annum Checklist approach Highlights Strengths and Areas for Improvement Provides value adding feedback Outcome is an Improvement Plan Improved quality of service delivery for our Citizens

BENEFITS PSIF Programme will ensure Dundee City Council adopts a consistent approach to performance management and improvement planning Mapped with frameworks used by audit, inspection and regulatory bodies Recognise and accept evidence reducing duplication of effort Increased self-awareness of where we are strong and where we need to improve

BASIC PRINCIPLES OF PSIF FACILITATION “Where you find quality, you will find a craftsman, not a quality control expert” Robert Breault

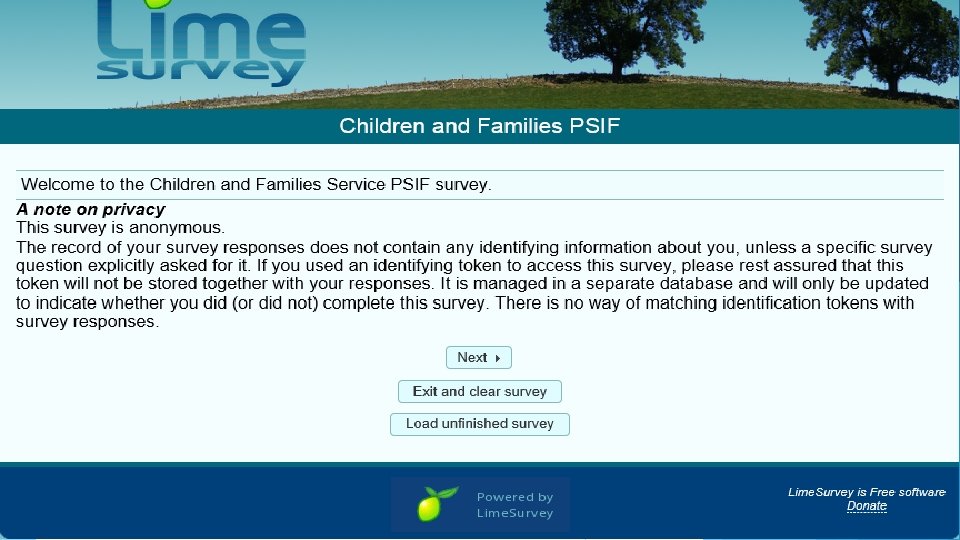
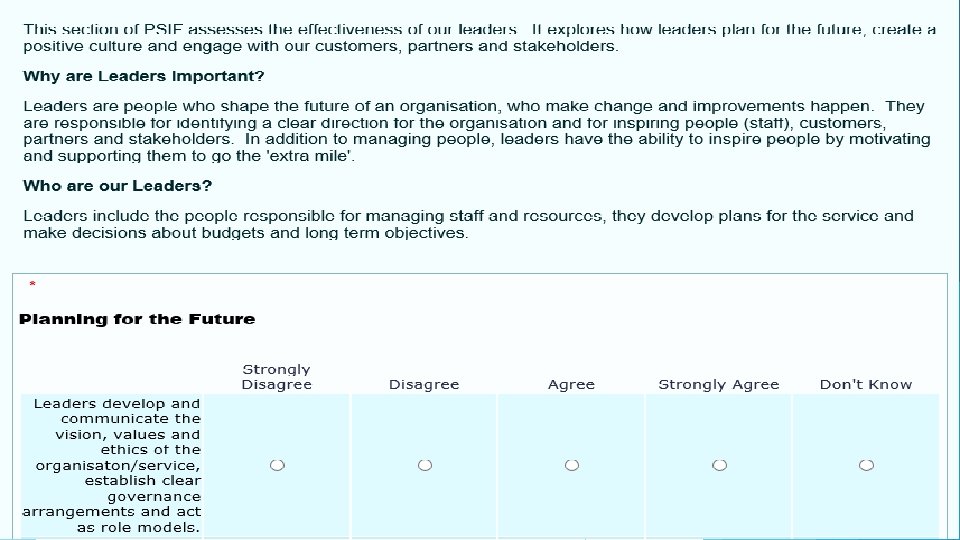
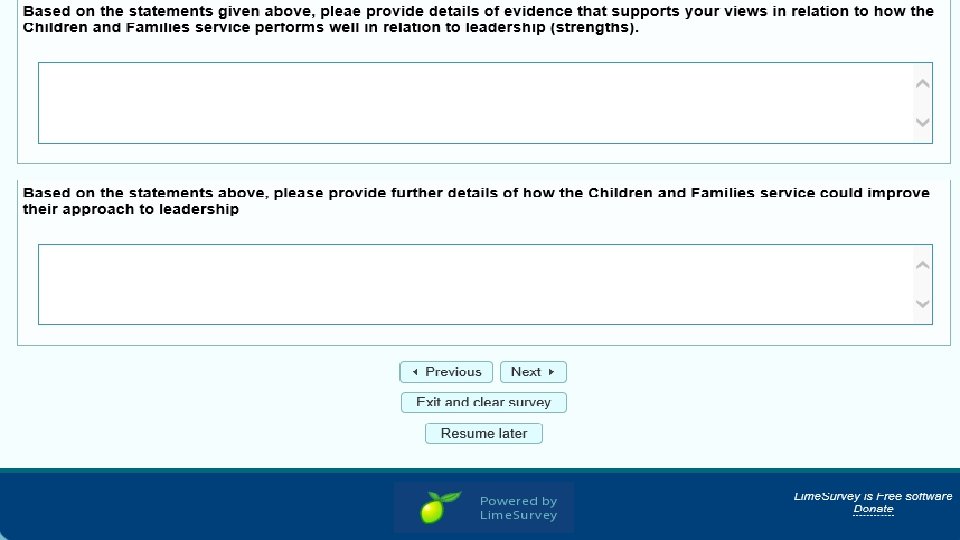
EXAMPLE PSIF Timeline Scoping discussions Awareness session Evidence Gathering Survey Distributed Open for 3 weeks Analyse evidence & prepare for Consensus 4 weeks from survey close Stakeholder Focus Groups Consensus session Improvement Planning Session Improvement Plan Agreed by Service Presented to Council Management Team Reported to Scrutiny Committee

Improvement Planning

Example Improvement Action Identify Measures to Reduce Drug & Alcohol Addiction in Dundee

How can we measure or know that the improvement action is being implemented OVERALL OUTCOME A Healthier and Safer Dundee What key actions need to happen to make this improvement action a reality? Establish the Baseline Consumer Surveys that Drug & Alcohol issues are reducing Develop a 3 to 5 year strategy to support City Plan Evidence of reduction in treatment Effective Consultation, engagement and support within communities Reduction in the number of children in care Can we assign an owner to the action Alcohol & Drugs Partnership Representatives City Plan Representatives Health & Wellbeing Executive Board David Lynch, Chief Officer, H&SCP Develop Measures to reduce Drug & Alcohol Addiction in Dundee When do we want to see the improvement action implemented by? Dates as outlined in the current Alcohol and Drugs Plan Move from treatment to prevention Build community capacity to support people in their local communities Are there any risks (financial or resources associated with the improvement action? We are unable to shift the balance from treatment to prevention due to demand for treatment Competing demand for resources in other priority areas

Improvement Planning

PSIF Complete Questions?

Performance Management Test and Evaluation
- Slides: 34