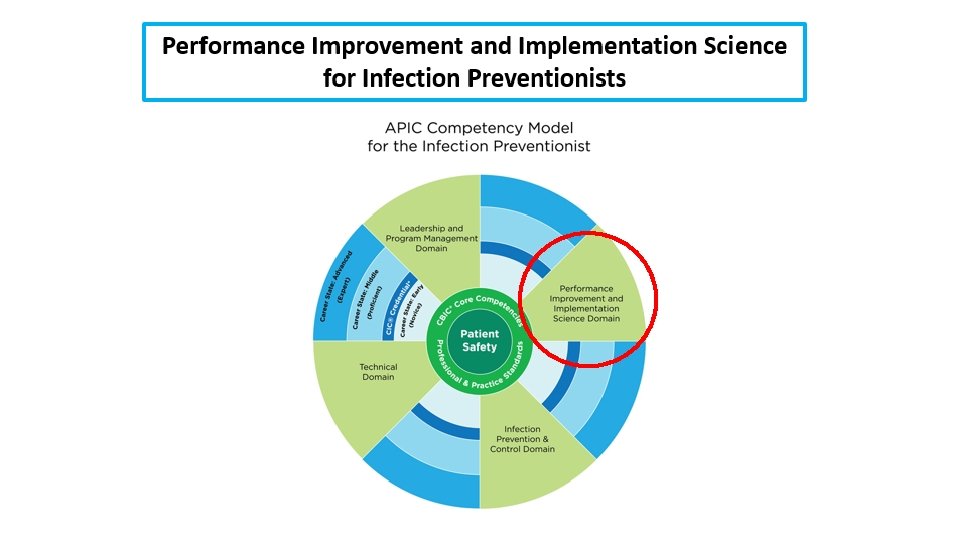
Performance Improvement and Implementation Science for Infection Preventionists


 Plan §")


 Write the effect you wish to influence in a box on the")


 • Failure Modes and Effects Analysis (FMEA) is a")
 Select a process to evaluate with FMEA. • Evaluation using FMEA")


 • The Plan-Do-Study-Act (PDSA) cycle")


- Slides: 52
Performance Improvement and Implementation Science for Infection Preventionists Ryan C. Lund, MPH, CPHQ Senior Manager, Quality and Patient Safety St. Luke’s Health System February 23 rd, 2018
Introduction • I am not a stranger to Infection Prevention • Former APIC Chapter President • Background in Performance Improvement, Infection Prevention, Patient Safety, Accreditation, Patient Experience • General interest in Quality Improvement Methodology and being a continuous learner
Objectives • Learn about different quality methodologies and frameworks • Learn about: • PDSA Worksheet • Cause and Effect Diagrams • Failure Modes Effects Analysis • Priority Matrix • flowchart/process map • Pareto Charts
Domain 4: Performance Improvement and Implementation Science 5 Elements that are required: • Identification of need for Performance Improvement • Assembly of PI Team • Tools and Methods • Implementation • Measuring Success
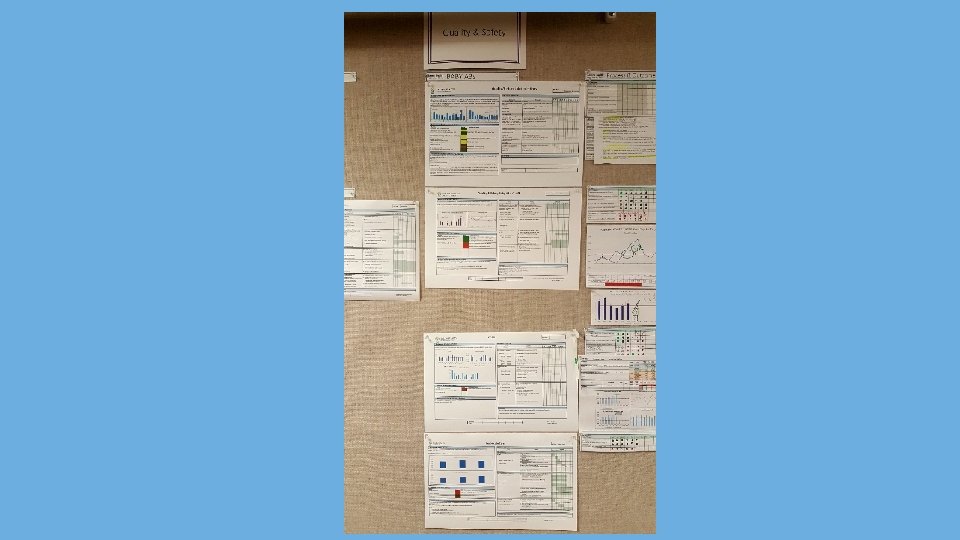
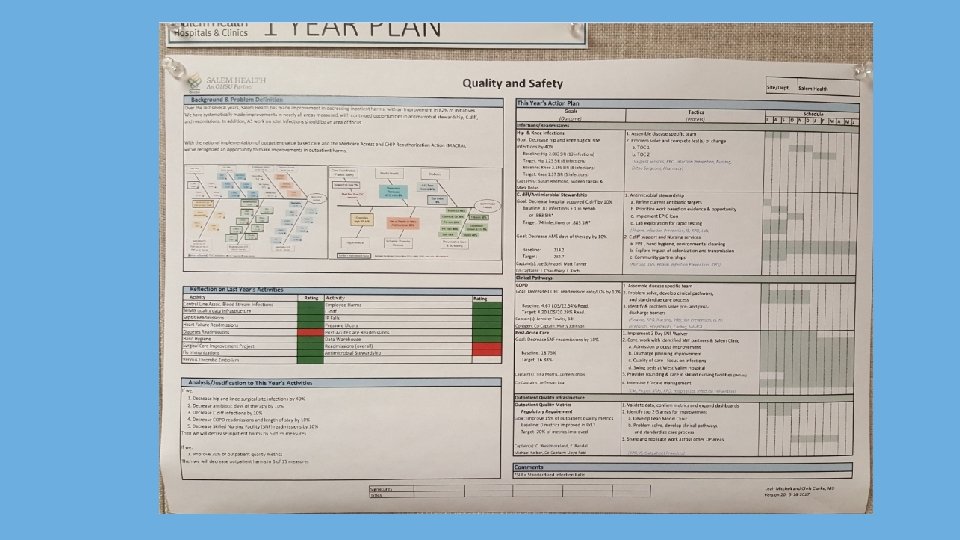
St. Luke’s Treasure Valley Quality and Safety Plan Quality Assessment/Performance Improvement (QAPI) Plan § § § § § Annual Quality and Patient Safety Plan Required by the Joint Commission Who We Are Governance and Leadership Outlines our Quality and Patient Safety Structure Highlights Goals, Initiatives, PI Projects Methodology, Data Systems, and Monitoring Evaluation of the Plan Approvals 7
Methodology § PDSA, the Institute for Healthcare Improvement model for improvement § Six Sigma § Lean § Additional tools may originate from evidenced based risk mitigation – Root Cause Analysis – Failure Modes Effects Analysis (FMEA) 8
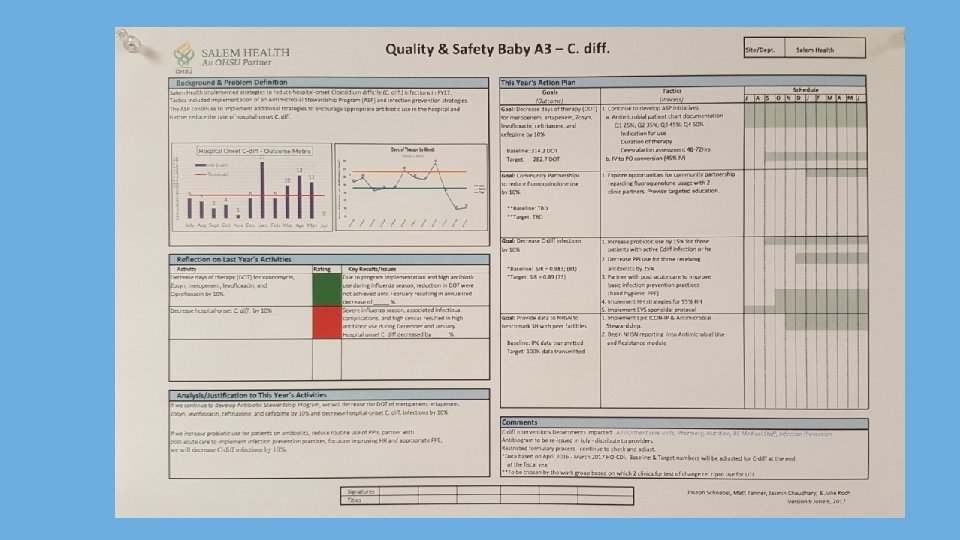
Salem Health—Outside of Portland, Oregon
IHI’s Model for Improvement
IHI’s Model for Improvement
Quality Improvement Essentials Toolkit • IHI’s QI Essentials Toolkit includes the tools and templates you need to launch a successful quality improvement project and manage performance improvement. • Each of the ten tools can be used with the Model for Improvement, Lean, or Six Sigma, and includes a short description, instructions, an example, and a blank template. http: //www. ihi. org/resources/Pages /Tools/Quality-Improvement. Essentials-Toolkit. aspx
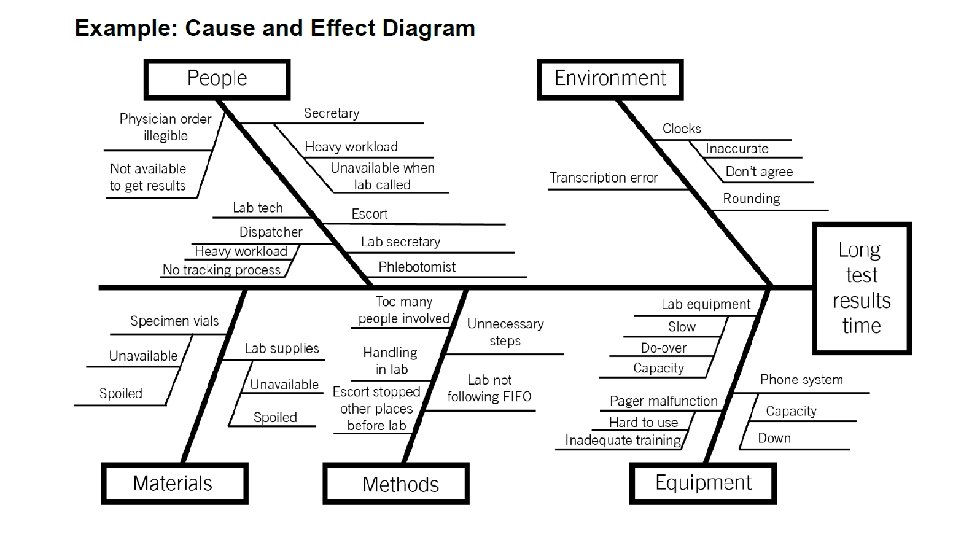
Cause and Effect Diagram • A common challenge for improvement teams is determining what changes they can test to improve a process. A cause and effect diagram is an organizational tool that helps teams explore and display the many causes contributing to a certain effect or outcome. It graphically displays the relationship of the causes to the effect and to each other, helping teams identify areas for improvement. • The cause and effect diagram is also known as an Ishikawa diagram, for its creator, or a fishbone diagram, for its resemblance to the bones of a fish. Teams list and group causes under the categories of Materials, Methods, Equipment, Environment, and People.
Instructions 1) Write the effect you wish to influence in a box on the right-hand side of the page. 2) Draw a horizontal line across the page to the left, starting at the box you just drew. 3) Decide on five or six categories of causes for the effect. The standard categories in a classic cause and effect diagram are Materials, Methods, Equipment, Environment, and People. 4) Draw diagonal lines above and below the horizontal line to create “fishbones, ” and label each line at the end with one of the categories you have chosen. Draw a box around each label. 5) For each category, generate a list of the causes that contribute to the effect. List the causes by drawing “branch bones. ” As necessary, draw additional branch bones from the causes to show subcauses. o Tip: Develop the causes by asking “Why? ” until you have reached a useful level of detail — that is, when the cause is specific enough to be able to test a change and measure its effects.
Do you really needing specific software?
Tips and Tricks • Sticky notes • Dry erase markers • Camera • Dry erase board or butcher paper Process Mapping
Failure Modes Effects Analysis (FMEA) • Failure Modes and Effects Analysis (FMEA) is a tool for conducting a systematic, proactive analysis of a process in which harm may occur. In an FMEA, a team representing all areas of the process under review convenes to predict and record where, how, and to what extent the system might fail. Then, team members with appropriate expertise work together to devise improvements to prevent those failures — especially failures that are likely to occur or would cause severe harm to patients or staff. • The FMEA tool prompts teams to review, evaluate, and record the following: • Steps in the process • Failure modes (What could go wrong? ) • Failure causes (Why would the failure happen? ) • Failure effects (What would be the consequences of each failure? ) • Teams use FMEA to evaluate processes for possible failures and to prevent them by correcting the processes proactively rather than reacting to adverse events after failures have occurred. This emphasis on prevention may reduce risk of harm to both patients and staff. FMEA is particularly useful in evaluating a new process prior to implementation and in assessing the impact of a proposed change to an existing process.
FMEA Instructions 1) Select a process to evaluate with FMEA. • Evaluation using FMEA works best on processes that do not have too many sub-processes. • If you’re hoping to evaluate a large and complex process, such as medication management in a hospital, divide it up. For example, do separate FMEAs on medication ordering, dispensing, and administration processes. 2) Recruit a multidisciplinary team. • Be sure to include everyone who is involved at any point in the process. Some people may not need to be part of the team throughout the entire analysis, but they should certainly be included in discussions of those steps in the process in which they are involved. For example, a hospital may utilize couriers to transport medications from the pharmacy to nursing units. It would be important to include the couriers in the FMEA of the steps that occur during the transport itself, which may not be known to personnel in the pharmacy or on the nursing unit.
FMEA Tool
FMEA Example
Example of a Project Prioritization Matrix
What is the difference between process mapping and flow charts? • Words are used interchangeably • Both refer to creating a diagram, algorithm, workflow, or process, that illustrates a business or work process • Only true difference is: • Process mapping refers to actual process for creating diagram • The diagram itself is called a flow chart
What is a flowchart/process map? • Process mapping is a method to graphically describe the steps that make up a process • It is one of the first steps of process improvement • It consists of a set of tools that enable us to systematically document, analyze, improve, and redesign a process
make a flowchart/process map? • Ability to visually understand document a process • Makes information visible to everyone • Produces a visual example of the process to better understand it and see areas for improvement • Develop true “buy-in” from the team • Develop a sense of pride • Create customer-focused processes (performance improvement)
Preparing for flowcharting/process mapping • It’s important to include everyone involved in the process (all stakeholders and departments) • Everyone involved needs to clearly understand: • Goals of the process • Deadlines • Have a general awareness of process mapping
General steps of creating a flowchart/process map • Step 1: Identify the problem: • What is the process that needs to be visualized. • Add the title to the top of the process map • Step 2: Brainstorm all the activities that will be involved: • At this point, sequencing steps is not important • Determine who does what and when is it done • Step 3: Figure out boundaries • Where or when does the process start and stop?
General Steps of creating a flowchart/process map • Step 4: Draw basic flowchart symbols: • Each element in a process map is represented by a specific flowchart symbol, which together represent a flowchart/process map • Ovals show the beginning or the ending of a process • Diamonds: show a point where a decision must be made (yes/no, True/False). • Rectangles: show an operation or activity that needs to be done • Arrows: represent the direction of flow • Parallelograms show inputs or outputs • Step 5: Finalize the flowchart/process map • Review the flowchart with stakeholders and gain agreement • Make sure you have included important chart information (titles, dates, created by)
Process Map § Graphical representation of the various steps and flows to complete an activity § Common symbols: Start / End Process Step Decision § Benefits: • Gain a collective understanding of the process • Depict customer-supplier relationships • Identify problem areas and improvement opportunities 32
Understand a Process There at least three versions of any process… What you think it is… What it actually is… What you want it to be… 33
Do you really needing specific process mapping software?
Tips and Tricks • Sticky notes • Dry erase markers • Camera • Dry erase board or butcher paper Process Mapping
Pareto Charts • According to the “Pareto principle” — also known as the “ 80/20 rule” — in any group of factors that contribute to an overall effect, roughly 80% of the effect comes from 20% of the causes. • A Pareto chart is a type of bar chart in which the various factors that contribute to an overall effect are arranged in order from the largest to the smallest contribution to the effect. This ordering helps identify the “vital few” (the factors that have the largest contribution to the effect and therefore warrant the most attention), as distinguished from the “useful many” (factors that, while useful to know about, have a relatively smaller contribution to the effect). • Using a Pareto chart helps teams concentrate their improvement efforts on the factors that have the greatest impact. It also helps teams explain their rationale for focusing on certain areas and not others.
Pareto Charts
Measures to Prevent Healthcare-Associated Infections It is important to track three types of measures when you are working to reduce healthcare -associated infections (HAIs). Outcome Measures These measures tell you whether changes are actually leading to improvement — that is, helping to achieve the overall aim of preventing HAIs. Examples include rate of occurrence of methicillin-resistant Staphylococcus aureus (MRSA) per 1, 000 patient days and percent of patients with Clostridium difficile associated disease (CAD). Process Measures To affect the outcome measure of preventing HAIs, you will make changes to improve processes intended to prevent transmission of bacteria and other organisms — including the processes for prevention of transmission from patient to patient, staff to patient, and environment to patient. Measuring the results of these process changes will tell you if the changes are leading to an improved, safer system. Examples include percent of patient encounters in compliance with hand hygiene procedure and percent of environmental cleanings completed appropriately. Balancing Measures Use these measures to make sure that changes to improve one part of the system aren’t causing new problems in other parts of the system. For example, the change of using a checklist for room cleaning might initially increase the amount of time spent cleaning a room.
Help with Process Measures
Run Charts and Control Charts • A run chart is a graph of data over time. It is a simple and effective tool to help you determine whether the changes you are making are leading to improvement. • Run charts help improvement teams formulate aims by depicting how well (or poorly) a process is performing, understand the value of a particular change, and begin to distinguish between common and special causes of variation. • Common-cause variation is the natural or expected variation inherent in a process. Special-cause variation arises because of specific circumstances that are not inherent in the process. • A control chart, which includes an upper control limit (UCL) and a lower control limit (LCL), goes further to help teams distinguish between common and special causes of variation within a process. Use a control chart when you have more than 15 data points and want more insight into your data. • Control charts help improvement teams identify special-cause variation in a process, identify early signs of success in an improvement project, and monitor a process to ensure it is holding the gains from a quality improvement effort.
Run Chart Example
Control Chart Example
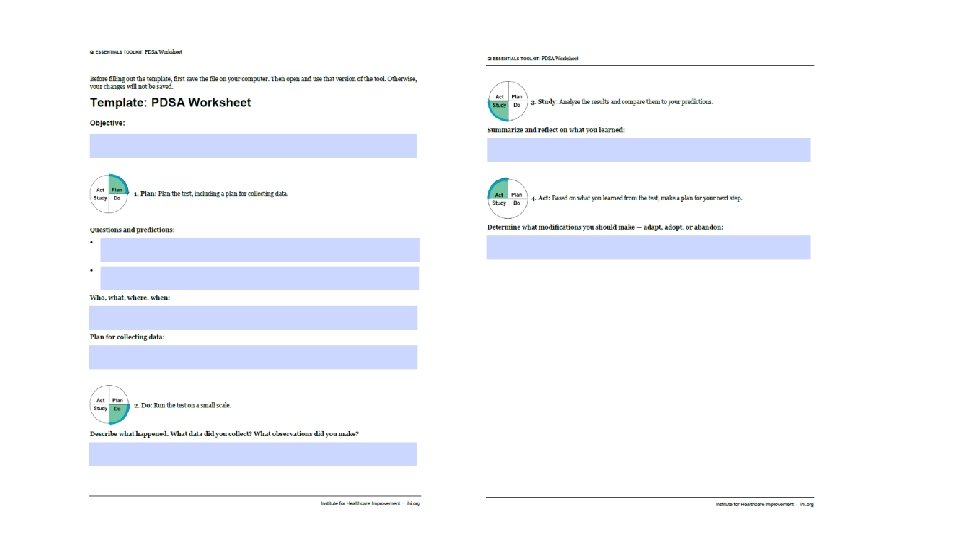
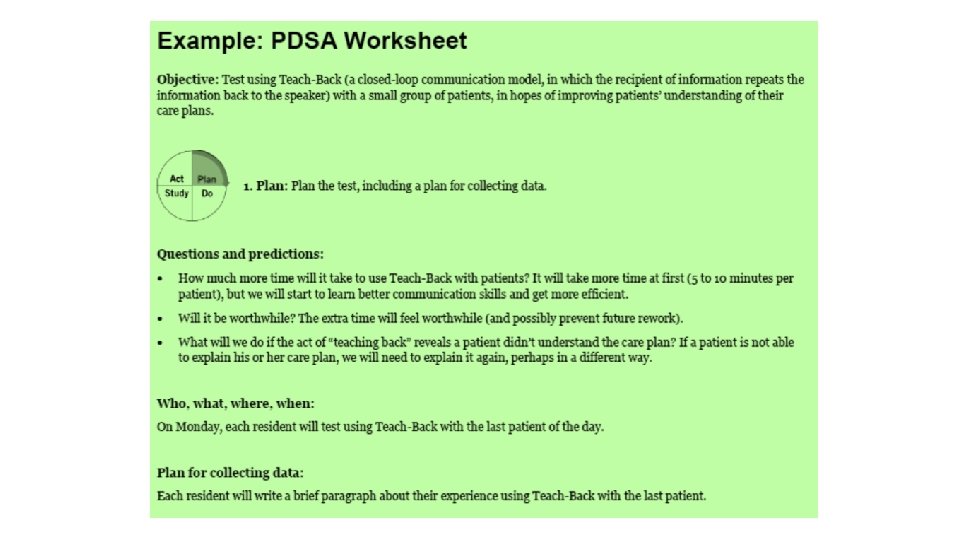
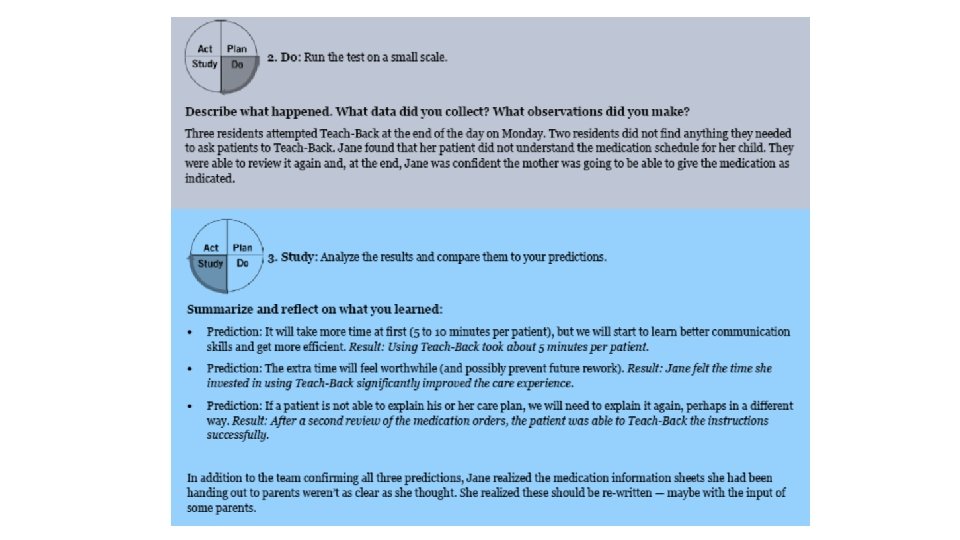
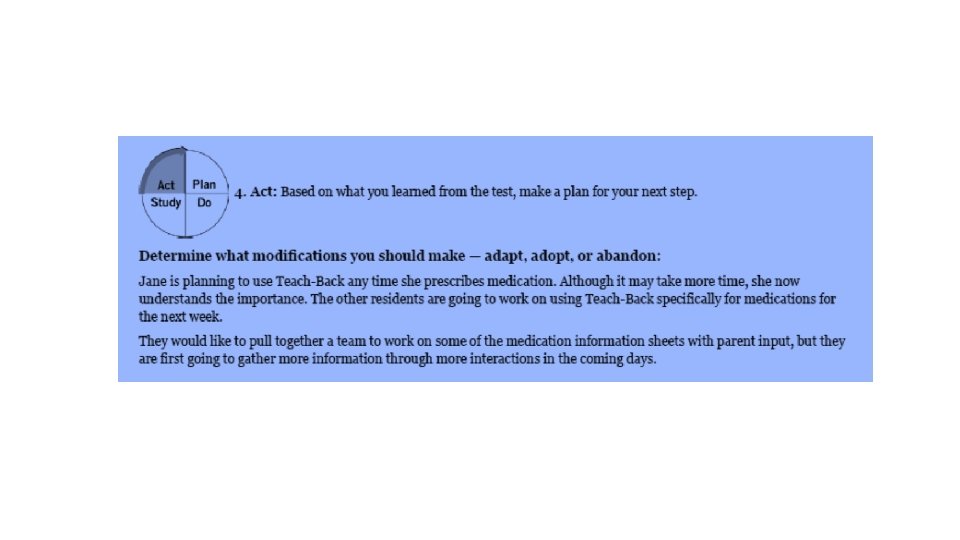
Plan – Do – Study – Act (PDSA Worksheet) • The Plan-Do-Study-Act (PDSA) cycle is a useful tool for documenting a test of change. Running a PDSA cycle is another way of saying testing a change —you develop a plan to test the change (Plan), carry out the test (Do), observe, analyze, and learn from the test (Study), and determine what modifications, if any, to make for the next cycle (Act). • Fill out one PDSA worksheet for each change you test. In most improvement projects, teams will test several different changes, and each change may go through several PDSA cycles as you continue to learn. Keep a file (either electronic or hard copy) of all PDSA cycles for all the changes your team tests.
PDSA Instructions
Project Planning Form • The Project Planning Form is a useful tool to help teams think systematically about their improvement project. By tracking a list of the changes that the team is testing — including all of the Plan-Do. Study-Act (PDSA) cycles, the person responsible for different aspects of each test, and the timeframe for each phase of the work — the form allows a team to see at a glance the full picture of a project.
Project Planning Form
Save the Date— 2018 Idaho Quality and Patient Safety Conference § April 19 th-20 th - Riverside Hotel, Boise § Sustaining Excellence – Davis Balestracci § Opioid Crisis – Lynn Webster, MD 51
Questions Ryan C. Lund, MPH, CPHQ Senior Manager, Quality & Patient Safety St. Luke’s Health System ( (208) 381 -1792 Ë (208) 724 -5817 + lundr@slhs. org