Performance Analysis and Optimization of Full GC in

![Memory-hungry environments Memory bloat phenomenon in large-scale Java applications [ISMM ’ 13] Limited per-application Memory-hungry environments Memory bloat phenomenon in large-scale Java applications [ISMM ’ 13] Limited per-application](https://slidetodoc.com/presentation_image/039f70163f1045b7d1f6638cd4a1ecf0/image-4.jpg)
![Effects of Garbage Collection GC suffers severe strain □ Accumulated stragglers [HOTOS ’ 15] Effects of Garbage Collection GC suffers severe strain □ Accumulated stragglers [HOTOS ’ 15]](https://slidetodoc.com/presentation_image/039f70163f1045b7d1f6638cd4a1ecf0/image-5.jpg)


- Slides: 32

Performance Analysis and Optimization of Full GC in Memory-hungry Environments Yang Yu, Tianyang Lei, Weihua Zhang, Haibo Chen, Binyu Zang Institute of Parallel and Distributed Systems (IPADS) Shanghai Jiao Tong University, China Fudan University, China VEE 2016 1

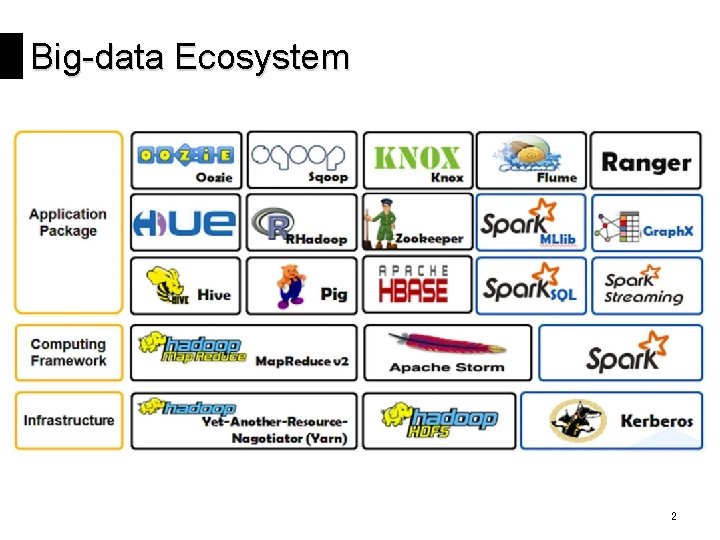
Big-data Ecosystem 2

JVM-based languages 3
![Memoryhungry environments Memory bloat phenomenon in largescale Java applications ISMM 13 Limited perapplication Memory-hungry environments Memory bloat phenomenon in large-scale Java applications [ISMM ’ 13] Limited per-application](https://slidetodoc.com/presentation_image/039f70163f1045b7d1f6638cd4a1ecf0/image-4.jpg)
Memory-hungry environments Memory bloat phenomenon in large-scale Java applications [ISMM ’ 13] Limited per-application memory in a shared-cluster design inside companies like Google [Euro. Sys ‘ 13] Limited per-core memory in many-core architecture (e. g. , Intel Xeon Phi) 4
![Effects of Garbage Collection GC suffers severe strain Accumulated stragglers HOTOS 15 Effects of Garbage Collection GC suffers severe strain □ Accumulated stragglers [HOTOS ’ 15]](https://slidetodoc.com/presentation_image/039f70163f1045b7d1f6638cd4a1ecf0/image-5.jpg)
Effects of Garbage Collection GC suffers severe strain □ Accumulated stragglers [HOTOS ’ 15] □ Amplified tail latency [Commun. ACM] Where exactly is the bottleneck of GC in such memory-hungry environments ? 5

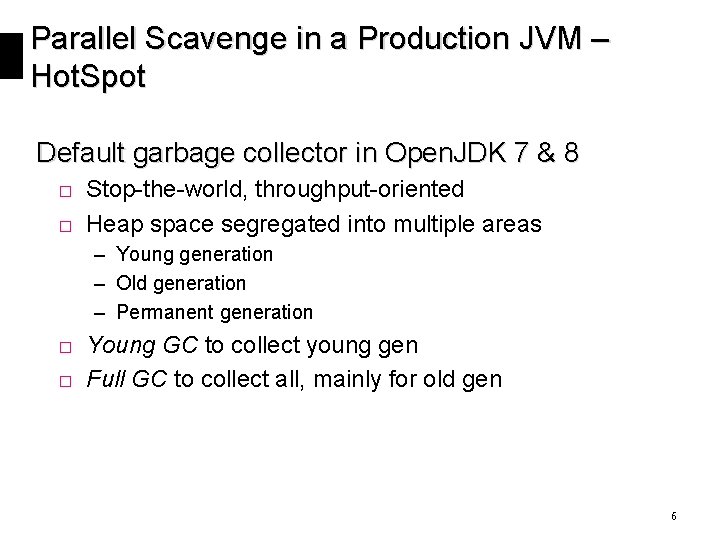
Parallel Scavenge in a Production JVM – Hot. Spot Default garbage collector in Open. JDK 7 & 8 □ Stop-the-world, throughput-oriented □ Heap space segregated into multiple areas – Young generation – Old generation – Permanent generation □ Young GC to collect young gen □ Full GC to collect all, mainly for old gen 6

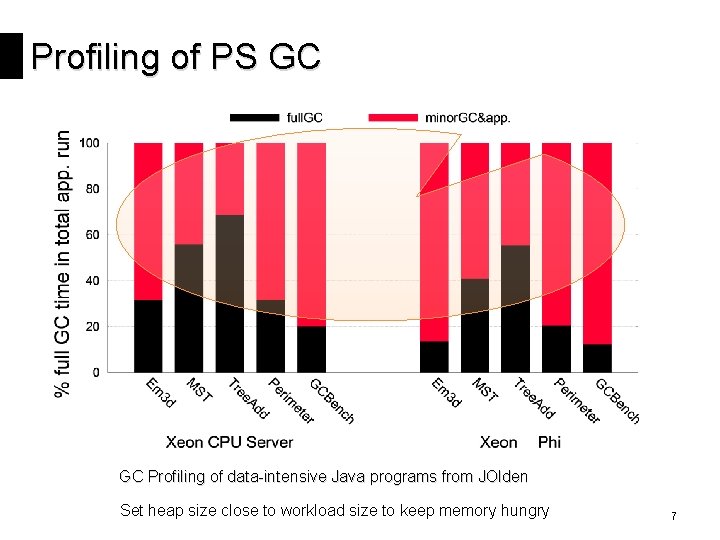
Profiling of PS GC GC Profiling of data-intensive Java programs from JOlden Set heap size close to workload size to keep memory hungry 7

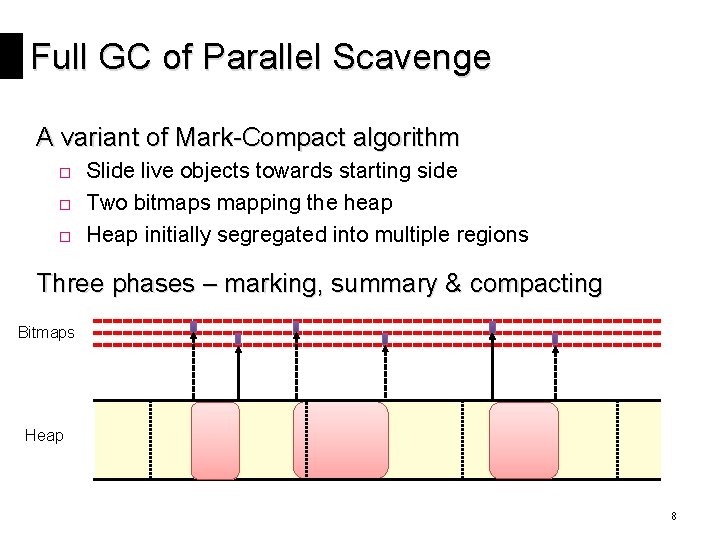
Full GC of Parallel Scavenge A variant of Mark-Compact algorithm □ Slide live objects towards starting side □ Two bitmaps mapping the heap □ Heap initially segregated into multiple regions Three phases – marking, summary & compacting Bitmaps Heap 8

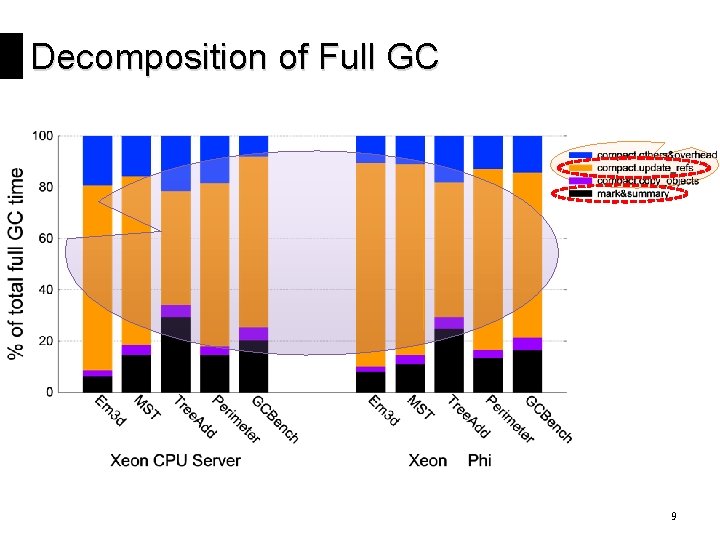
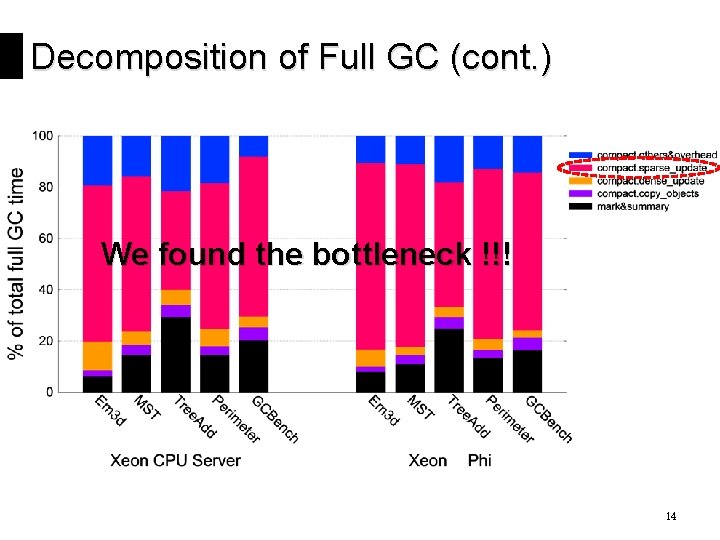
Decomposition of Full GC 9

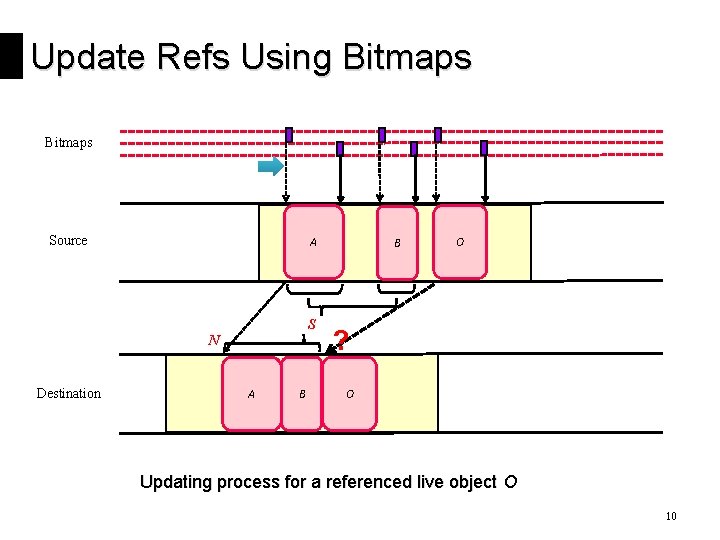
Update Refs Using Bitmaps Source A B S N Destination A B O ? O Updating process for a referenced live object O 10

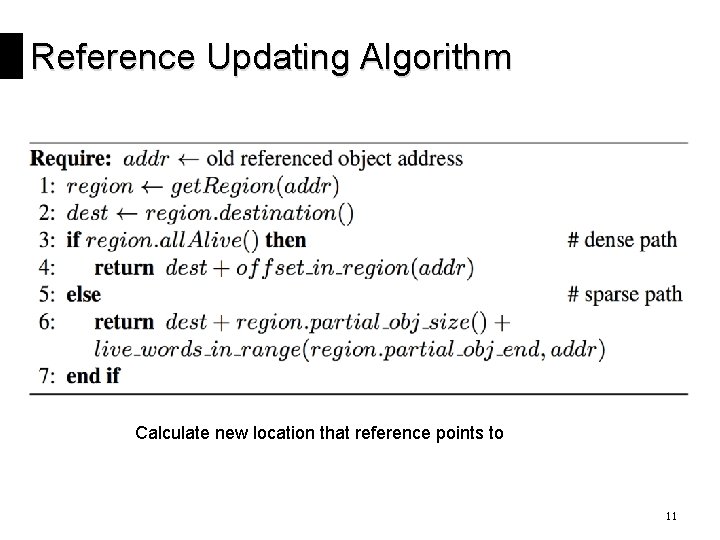
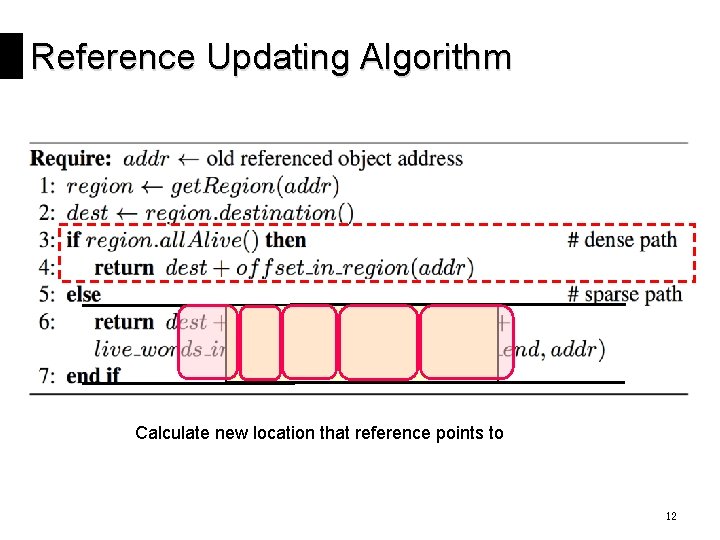
Reference Updating Algorithm Calculate new location that reference points to 11

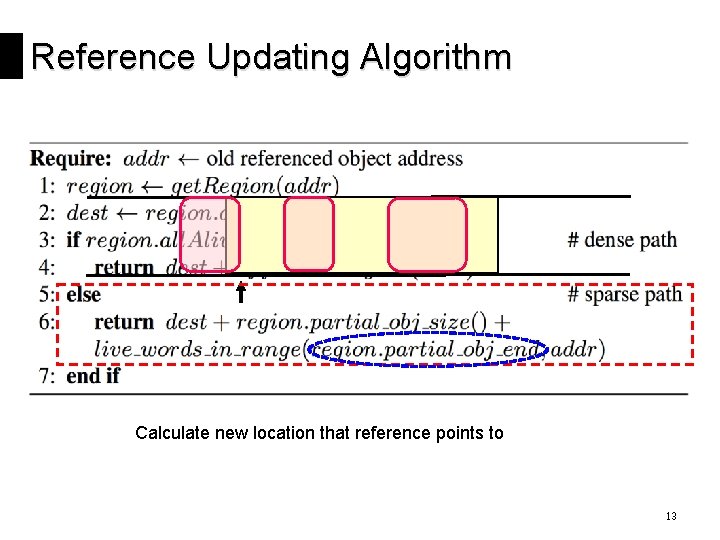
Reference Updating Algorithm Calculate new location that reference points to 12

Reference Updating Algorithm Calculate new location that reference points to 13

Decomposition of Full GC (cont. ) We found the bottleneck !!! 14

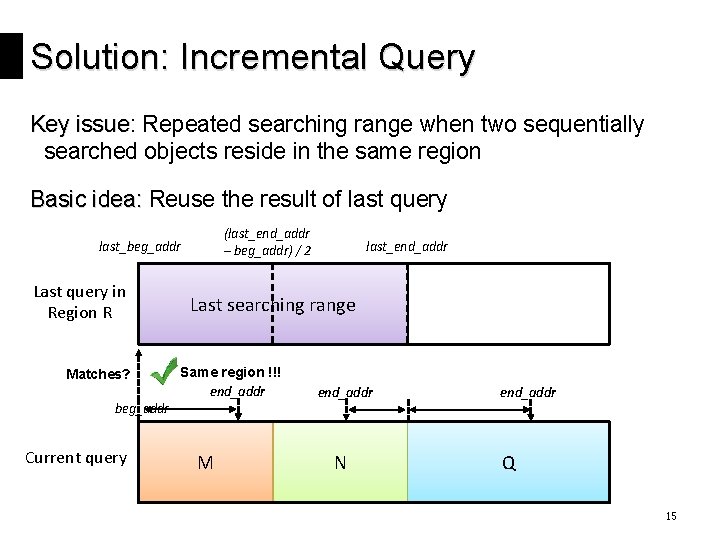
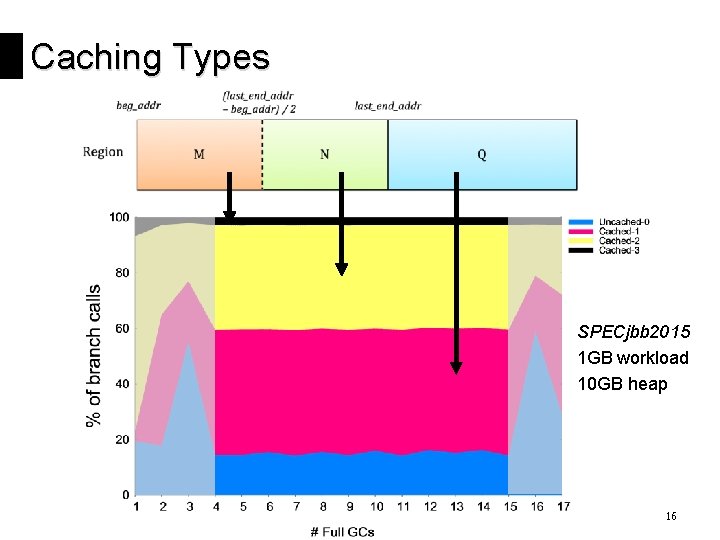
Solution: Incremental Query Key issue: Repeated searching range when two sequentially searched objects reside in the same region Basic idea: Reuse the result of last query (last_end_addr – beg_addr) / 2 last_beg_addr Last query in Region R Matches? beg_addr Current query last_end_addr Last searching range Same region !!! end_addr M end_addr N end_addr Q 15

Caching Types SPECjbb 2015 1 GB workload 10 GB heap 16

Query Patterns Local pattern □ Sequentially referenced objects tend to lie in same region □ Results of last queries could thus be easily reused Random pattern □ Sequentially referenced objects always lie in random regions □ Incapable to reuse last results directly Most applications are mixed with two query patterns, differentiated by respective proportions 17

Optimistic IQ (1/3) A straightforward implementation □ Complies with the basic idea □ Each GC thread maintains one global result of last query for all the regions Pros & cons □ Pros: Little overhead for both memory utilization and calculation □ Cons: Rely heavily on the local pattern to take good effect 18

Sort-based IQ (2/3) Dynamically reorder refs with a lazy update □ References first filled into a buffer before updating □ Once filled up, reorder refs based on region indexes □ Buffer size close to L 1 cache line size Pros & cons □ Pros: Gather refs in same region periodically □ Cons: Calculation overhead due to the extra sorting procedure 19

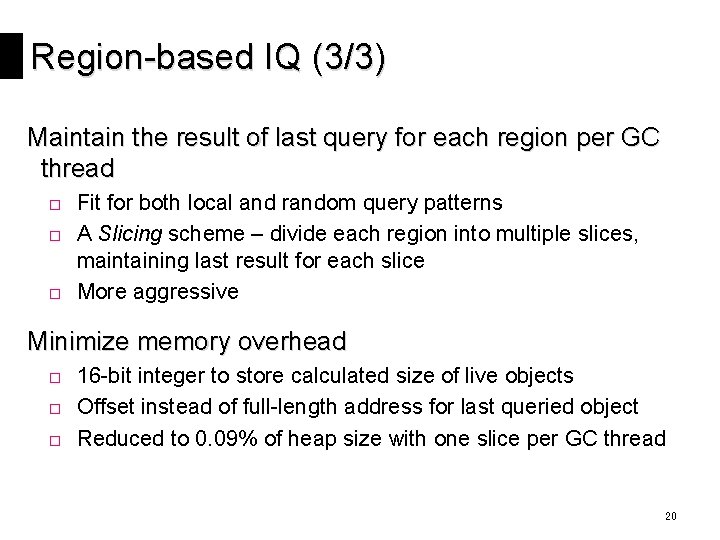
Region-based IQ (3/3) Maintain the result of last query for each region per GC thread □ Fit for both local and random query patterns □ A Slicing scheme – divide each region into multiple slices, maintaining last result for each slice □ More aggressive Minimize memory overhead □ 16 -bit integer to store calculated size of live objects □ Offset instead of full-length address for last queried object □ Reduced to 0. 09% of heap size with one slice per GC thread 20

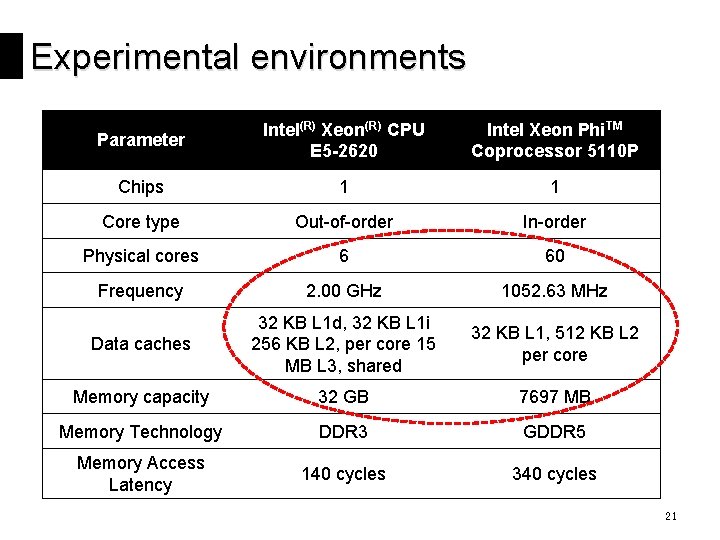
Experimental environments Parameter Intel(R) Xeon(R) CPU E 5 -2620 Intel Xeon Phi. TM Coprocessor 5110 P Chips 1 1 Core type Out-of-order In-order Physical cores 6 60 Frequency 2. 00 GHz 1052. 63 MHz Data caches 32 KB L 1 d, 32 KB L 1 i 256 KB L 2, per core 15 MB L 3, shared 32 KB L 1, 512 KB L 2 per core Memory capacity 32 GB 7697 MB Memory Technology DDR 3 GDDR 5 Memory Access Latency 140 cycles 340 cycles 21

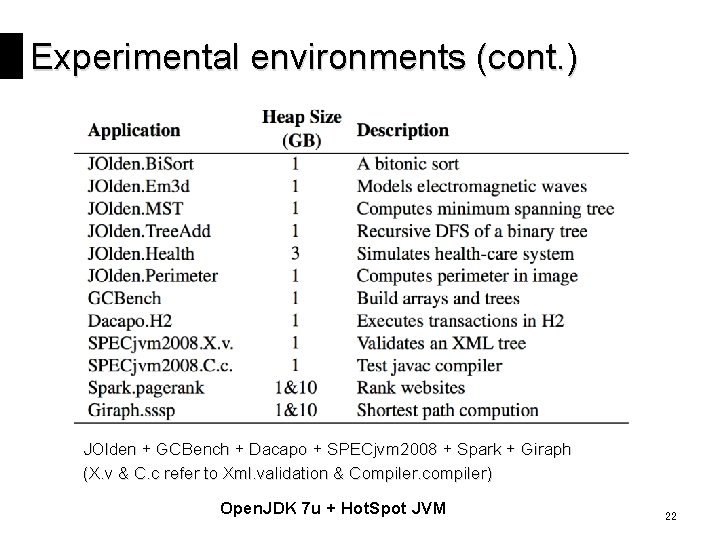
Experimental environments (cont. ) JOlden + GCBench + Dacapo + SPECjvm 2008 + Spark + Giraph (X. v & C. c refer to Xml. validation & Compiler. compiler) Open. JDK 7 u + Hot. Spot JVM 22

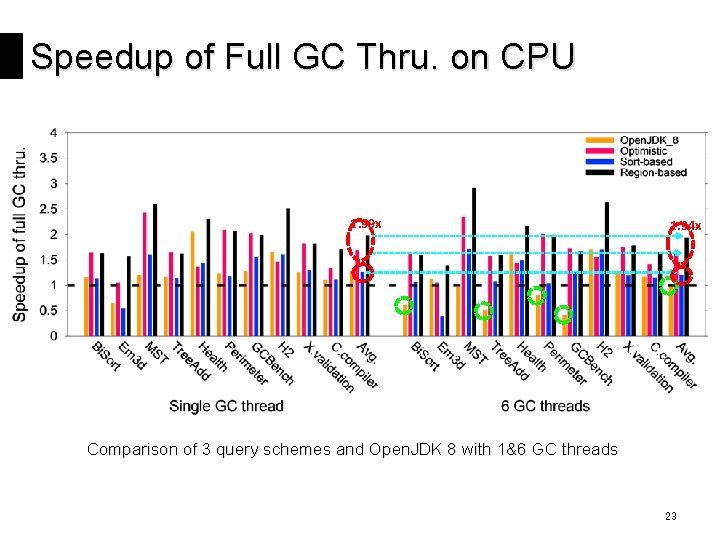
Speedup of Full GC Thru. on CPU 1. 99 x 1. 94 x Comparison of 3 query schemes and Open. JDK 8 with 1&6 GC threads 23

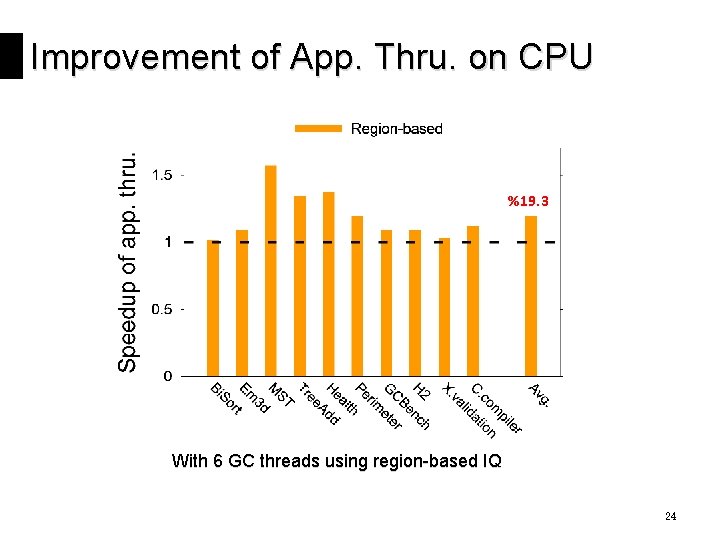
Improvement of App. Thru. on CPU %19. 3 With 6 GC threads using region-based IQ 24

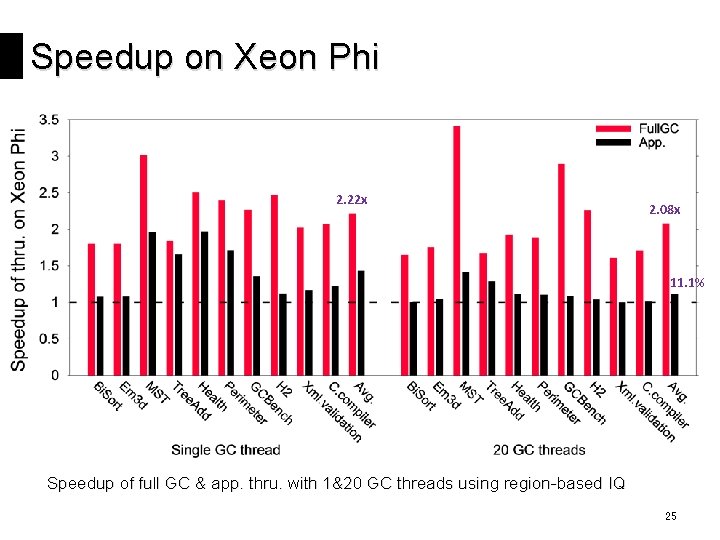
Speedup on Xeon Phi 2. 22 x 2. 08 x 11. 1% Speedup of full GC & app. thru. with 1&20 GC threads using region-based IQ 25

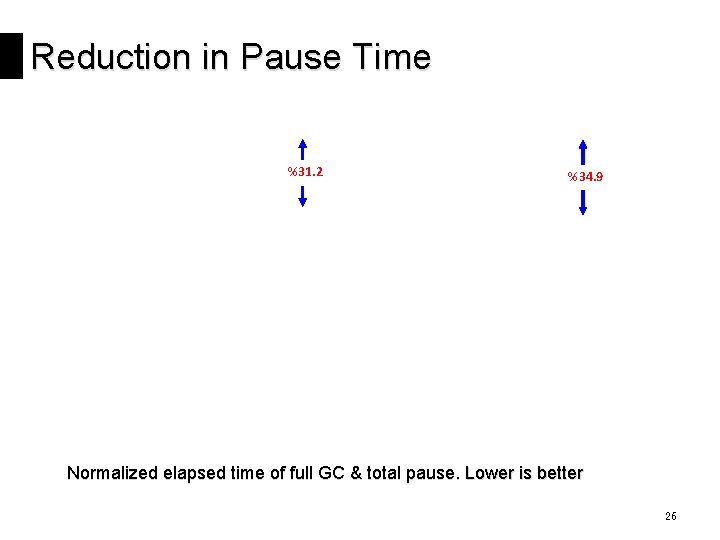
Reduction in Pause Time %31. 2 %34. 9 Normalized elapsed time of full GC & total pause. Lower is better 26

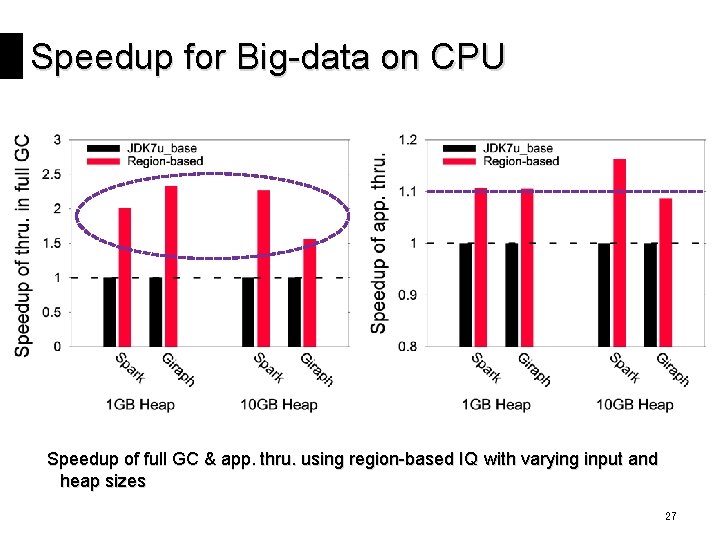
Speedup for Big-data on CPU Speedup of full GC & app. thru. using region-based IQ with varying input and heap sizes 27

Conclusions A thorough profiling-based analysis of Parallel Scavenge in a production JVM – Hot. Spot An incremental query model and three different schemes Integrated into Open. JDK main stream □ JDK-8146987 28

Thanks Questions 29

Backups 30

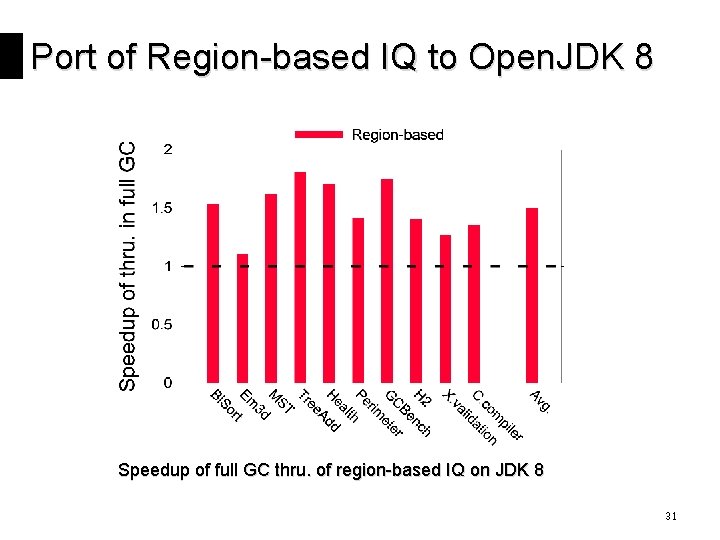
Port of Region-based IQ to Open. JDK 8 Speedup of full GC thru. of region-based IQ on JDK 8 31

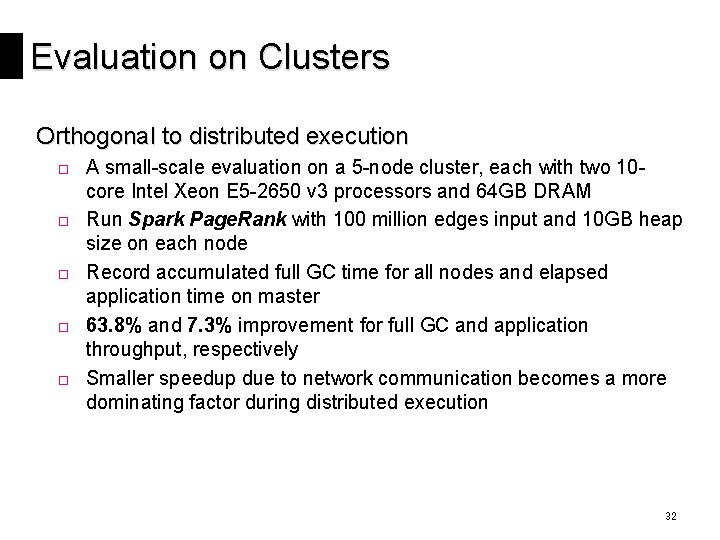
Evaluation on Clusters Orthogonal to distributed execution □ A small-scale evaluation on a 5 -node cluster, each with two 10 core Intel Xeon E 5 -2650 v 3 processors and 64 GB DRAM □ Run Spark Page. Rank with 100 million edges input and 10 GB heap size on each node □ Record accumulated full GC time for all nodes and elapsed application time on master □ 63. 8% and 7. 3% improvement for full GC and application throughput, respectively □ Smaller speedup due to network communication becomes a more dominating factor during distributed execution 32