Perfecto Automation with Cucumber Smart Reporting Perfecto by

Perfecto Automation with Cucumber Smart Reporting Perfecto by Perforce © 2020 Perforce Software, Inc.

Agenda 2 | Perfecto by Perforce © 2020 Perforce Software, Inc. 1 Introduction 2 The Reporting Views 3 Tagging 4 Questions? perfecto. io

Introduction

Smart Reporting • Perfecto’s reporting app contains much more than just viewing the script execution. • The Reporting views allow you to view your project’s health by multiple criteria • • CI Jobs Tags Devices – includes physical devices, OS versions and more Tests running across devices 4 | Perfecto by Perforce © 2020 Perforce Software, Inc. perfecto. io

Smart Reporting – the different views • Let’s go in and look at the different views provided: • • Report Library CI Dashboard Heatmap Live Stream 5 | Perfecto by Perforce © 2020 Perforce Software, Inc. perfecto. io

Reporting Views

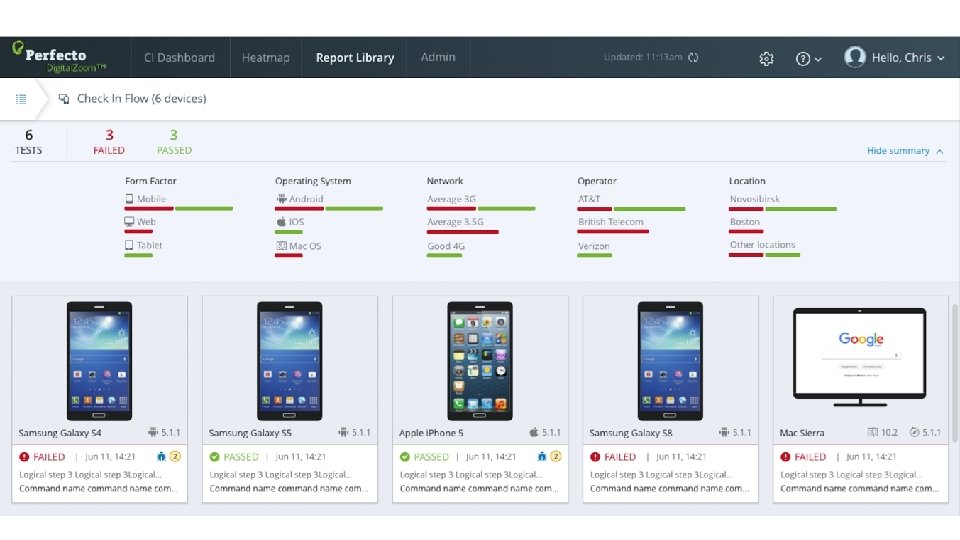
Report Library • Lists all the tests that were run on the cloud • View is configurable – allows filtering by dates, devices, jobs, tags and more. • Views can be saved and shared 7 | Perfecto by Perforce © 2020 Perforce Software, Inc. perfecto. io

Reports Library - Testing at scale and drill down on specific quality areas

CI Dashboard • Tests run from CI appear in this view • Track your tests by Job • Constantly updated view of success/fail and performance over time • An ideal view for troubleshooting 10 | Perfecto by Perforce © 2020 Perforce Software, Inc. perfecto. io

CI Dashboard – Fast feedback for Continuous Integration users: get instant build quality visibility The CI Dashboard delivers a historical view of test suite results. The primary user of the view is management to understand overall quality trending.

CI Dashboard – Enjoy Pipeline Quality visibility across different Feature Branches

Heat. Map • The heatmap provides a view of all your tests, according to different devices. • Provides a visual cue on how tests run across devices • Click directly on areas of interest to access reports 13 | Perfecto by Perforce © 2020 Perforce Software, Inc. perfecto. io

Heatmap Dashboard – Executive/team level quality assessment
")
Heatmap Dashboard – filter to identify risk areas)

Live Stream • Displays real time video of scripts currently running • Allows you to see your code run live on a device 16 | Perfecto by Perforce © 2020 Perforce Software, Inc. perfecto. io

Tagging

Tagging • The reporting app works out of the box when you use Perfecto’s Quantum framework. • To improve results, use tagging • Tag each test in the feature file • Tag on the feature & scenario level • Multiple tags supported • Tags can be used as filters when viewing results 18 | Perfecto by Perforce © 2020 Perforce Software, Inc. perfecto. io

Questions

THANK YOU
- Slides: 20