Percentage Increase Decrease Calculator Worksheet A Worksheets increase


- Slides: 8
Percentage – Increase & Decrease – Calculator – Worksheet A Worksheets increase in difficulty and are in 2 sizes. Dice required. Worksheet 1 : 5 & 10 percentages Worksheet 2 : Decimal & integer percentages
Printing To print handouts from slides Select the slide from the left. Then click: File > Print > ‘Print Current Slide’ To print multiple slides Click on a section title to highlight all those slides, or press ‘Ctrl’ at the same time as selecting slides to highlight more than one. Then click: File > Print > ‘Print Selection’ To print double-sided handouts Highlight both slides before using ‘Print Selection’. Choose ‘Print on Both Sides’ and ‘Flip on Short Edge’.
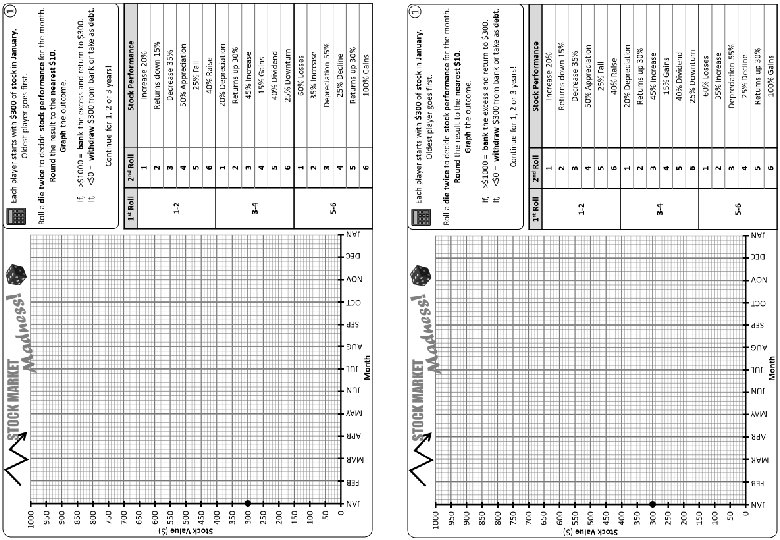
Each player starts with $300 of stock in January. Oldest player goes first. 1000 Roll a die twice to decide stock performance for the month. Round the result to the nearest $10. Graph the outcome. 950 900 850 If, >$1000 = bank the excess and return to $300. If, <$0 = withdraw $300 from bank or take as debt. 800 Continue for 1, 2 or 3 years! 750 700 1 st Roll 650 600 550 1 -2 500 450 400 350 300 3 -4 250 200 150 100 50 JAN DEC OCT SEP NOV Month AUG JUL JUN MAY APR FEB MAR 5 -6 0 JAN Stock Value ($) ① 2 nd Roll 1 2 3 4 5 6 Stock Performance Increase 20% Returns down 15% Decrease 35% 50% Appreciation 25% Fall 40% Raise 20% Depreciation Returns up 30% 45% Increase 15% Gains 40% Dividend 25% Downturn 60% Losses 35% Increase Depreciation 55% 25% Decline Returns up 30% 100% Gains
Each player starts with $300 of stock in January. Oldest player goes first. 1000 Roll a die twice to decide stock performance for the month. Round the result to the nearest $10. Graph the outcome. 950 900 850 If, >$1000 = bank the excess and return to $300. If, <$0 = withdraw $300 from bank or take as debt. 800 Continue for 1, 2 or 3 years! 750 700 1 st Roll 650 600 550 1 -2 500 450 400 350 300 3 -4 250 200 150 100 50 JAN DEC OCT SEP NOV Month AUG JUL JUN MAY APR FEB MAR 5 -6 0 JAN Stock Value ($) ① 2 nd Roll 1 2 3 4 5 6 Stock Performance Increase 20% Returns down 15% Decrease 35% 50% Appreciation 25% Fall 40% Raise 20% Depreciation Returns up 30% 45% Increase 15% Gains 40% Dividend 25% Downturn 60% Losses 35% Increase Depreciation 55% 25% Decline Returns up 30% 100% Gains
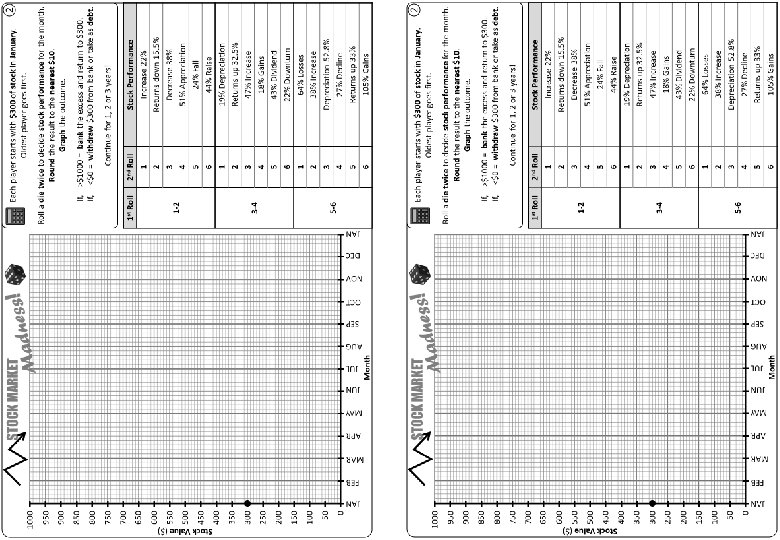
Each player starts with $300 of stock in January. Oldest player goes first. 1000 Roll a die twice to decide stock performance for the month. Round the result to the nearest $10. Graph the outcome. 950 900 850 If, >$1000 = bank the excess and return to $300. If, <$0 = withdraw $300 from bank or take as debt. 800 Continue for 1, 2 or 3 years! 750 700 1 st Roll 650 600 550 1 -2 500 450 400 350 300 3 -4 250 200 150 100 50 JAN DEC OCT SEP NOV Month AUG JUL JUN MAY APR FEB MAR 5 -6 0 JAN Stock Value ($) ② 2 nd Roll 1 2 3 4 5 6 Stock Performance Increase 22% Returns down 15. 5% Decrease 38% 51% Appreciation 24% Fall 44% Raise 19% Depreciation Returns up 32. 5% 47% Increase 18% Gains 43% Dividend 22% Downturn 64% Losses 38% Increase Depreciation 52. 8% 27% Decline Returns up 33% 105% Gains
Questions? Comments? Suggestions? …or have you found a mistake!? Any feedback would be appreciated . Please feel free to email: tom@goteachmaths. co. uk